
Abstract
Objectives
Improving medical student placements relies on being able to reliably evaluate how students experience clinical learning environments. The Undergraduate Clinical Education Environment Measure (UCEEM) is an increasingly used validated tool designed to allow such evaluations. This study aims to further characterize how the UCEEM relates to qualitative evaluation.
methods
Students on placement at one hospital were invited to complete the UCEEM before and after the implementation of an innovative new placement structure. Additionally, focus groups were employed to collect qualitative data on their experiences. a novel protocol to triangulate the output of the UCEEM with the qualitative data was developed.
Results
The UCEEM showed good internal consistency (Cronbach's Alpha 0.79-0.91) and internal correlation. Implementation of the intervention created significant improvements in the overall UCEEM scores (P = .008) and in the “Learning in and through work and quality of supervision” (P = .048), “Preparedness for student entry” (P = .033) and “Workplace interaction patterns and student inclusion” (P = .039) domains. The triangulation of qualitative data with UCEEM output showed that the UCEEM allowed evaluation of some perceptions not reached through open questioning. However, mixed interpretations of UCEEM items by students led to the conflation of themes and challenges in deriving the meaning behind the score. This appeared to be the case for 14 of the 24 UCEEM items.
Conclusion
This investigation adds to the literature supporting the UCEEM as a validated tool. It also elucidates the limitations and relationships to qualitative data that investigators need to be aware of in its use.
Introduction
A key challenge in medical education is designing and improving placements within a clinical learning environment (CLE). This term aims to capture everything that impacts the experiences of students on clinical placement and encompass interactions between students, clinicians, educators, and the working hospital. 1
Importantly, educational outcomes are strongly linked to the learning climate.2-4 Essential qualities highlighted in “Tomorrow's Doctors,” such as empathy and professionalism are eroded by poor learning climates.5,6
Evaluation of the Clinical Learning Environment
To evaluate the quality of their courses educators must be able to assess the quality of a given CLE, both at a single point in time and over time. The complex nature of CLEs makes this a challenge. 7
Typically, aspects of the CLE are investigated by proxy—student reported experience. Standardized and validated quantitative tools may offer reliable and statistically robust means to assess clinical environments quickly and effectively over time, at the cost of losing breadth and depth of information and the ability to discover unexpected points offered by qualitative methods such as focus groups.8,9
The Undergraduate Clinical Educational Environment Measure
The Undergraduate Clinical Educational Environment Measure (UCEEM) is one such validated 25-item questionnaire developed specifically to “measure the undergraduate medical student perceptions of multiple dimensions of the education environment in the clinical workplace.” 10 The 25 items were clustered through exploratory factor analysis to correspond to 4 underlying “factors”, grouped into 2 pairs. These are “opportunities to learn in and through work and quality of supervision” (A1), “preparedness [of the clinical environment] for student entry” (A2), which together are grouped as “Experiential learning” factors, and “workplace interaction patterns and student inclusion” (B1), and “equal treatment” (B2), which are grouped as the “Social Participation” factors.
The UCEEM differs from previous measures such as the frequently used 50-item Dundee Ready Education Environment Measure (DREEM) 11 in that it aims to specifically evaluate student experience of work-based, supervision-based and self-directed learning within a given clinical setting, rather than more broadly assessing the academic environment of an entire medical school. Among the 36 environmental evaluation tools evaluated by Irby and colleagues in a recent review, it was 1 of only 6 which are “clinically oriented learning environment instruments designed for general-purpose use in medical education”, and 1 of only 2 that evaluated all 4 of the domains they defined as important. 12 It has now been used in diverse settings internationally.13-16 The UCEEM thus fills an important niche for educators looking to evaluate the environment experienced by clinical students.
However, literature on the real-world usage of the UCEEM is so far limited. The creators suggested “that future research directions combine UCEEM measures with additional qualitative data to further deepen understanding of the various elements of optimal and suboptimal workplace learning environments for this group of learners”, and potentially use “pre and post quality improvement measures.” 10 Further interviews of stakeholders about their interpretation of UCEEM items found that different stakeholders may interpret items in different ways, reinforcing and deepening the need for mixed-methodology studies to better understand the usefulness of the tool. 17
Intervention
Royal Papworth Hospital (RPH) recently introduced a new innovative intervention designed to improve the CLE and to enhance student's ability to engage in self-directed learning.
The educational intervention consisted of the application of new resources to design and implement a new structure for learning activities and student support. The intervention introduced two elements: first, education fellows acted as mentors to the students. They met with students weekly, guiding students to refine SMART goals, 18 pointing them towards activities, aiding integration with the hospital teams, and assisting them in reflecting on the efficacy of their learning methodology. Second, a “toolbox” of educational opportunities was made available, which students could sign up for in accordance with applicability to their goals. This included a wide variety of options such as supervised ABG practice in the Respiratory Support center, OSCE-focused bedside supervision, pharmacist shadowing, and simulated on-call.
The aim of the intervention was to increase access to high-quality educational supervision, improve the ability of students to engage with clinical teams, and facilitate and encourage self-directed learning and the development of self-directed learning skills. These elements are among those evaluated in the UCEEM.
Objectives
This study evaluated the impact of this intervention using the UCEEM questionnaire before and after implementation and using focus groups after the intervention. It therefore had the opportunity to provide the first published example of the UCEEM being used before and after an intervention to evaluate change and to triangulate and compare the outcomes of the UCEEM with qualitative data about the same course gathered in parallel, elucidating the relative performance of each method. It is hypothesized that (1) the UCEEM would be responsive to an intervention designed to improve the CLE, and that (2) qualitative data gathered in parallel would reveal information important to understanding how the UCEEM results can be interpreted.
This provides evidence as to the usefulness of the UCEEM in new settings, as well as how the information it offers relates to and complements parallel qualitative evaluations of a clinical environment.
Methods
This study used a mixed-methods approach, combining quantitative evaluation of a CLE using a validated tool and qualitative evaluation with focus groups and thematic analysis to allow for triangulation between the 2 methods and enhance understanding of the quantitative tool.
Population
The intervention and evaluation took place in RPH, Cambridgeshire, UK. Students were final-year medical students attending the University of Cambridge. They attend RPH for a 2-week placement, during which they are attached to 1 medical or surgical team. The evaluation took place between August 2019 and August 2021. There were 6 iterations of the 2-week placement pre-intervention, and 39 iterations post-intervention.
Quantitative Data Collection and Analysis—UCEEM
All students were offered the chance to complete the UCEEM via Google Forms at the end of their 2-week placement at Royal Papworth alongside routine course evaluation, with additional consent gained for use of the data for research. No incentive was offered for filling out the UCEEM questionnaire, and completion was not mandatory, though the total number of potential students filling out the questionnaire was known. The researchers provided teaching and educational supervision to some of the students who completed the UCEEM questionnaire as part of a team of 5 Clinical Fellows.
Data analysis was carried out using the XRealStats add on to Microsoft Excel. 19 The internal consistency of the UCEEM was assessed using Cronbach's Alpha. Floor and Ceiling effects were calculated. Changes in UCEEM scores before and after the intervention were assessed through a Mann-Whitney U test as the UCEEM produces ordinal data (alpha = 0.05).
Qualitative Data Collection—Focus Group Methodology
At the end of each academic year, all students who attended the placement post-implementation of the intervention were invited via email to take part in a 60-min focus group (convenience sampling). A £10 voucher was offered as compensation for their time. All respondents took part in focus group interviews carried out by 1 of the investigators (JH, MBBChir, PGDip MedEd, Clinical Fellow in Medical Education, RPH). The researchers trained in qualitative methodologies in their postgraduate medical education study. Focus groups took place over the video conference tool Zoom.
The focus group employed open questions to initiate discussion in areas that match the domains of the UCEEM questionnaire, explore areas of interest to the design of the intervention, offer opportunities for ideas outside the scope of the UCEEM, and investigate outcomes that were specific aims of the educational intervention. The interview format is available in Appendix 1. Focus groups were recorded and transcribed manually by JH and AJ.
Qualitative Data Analysis
After anonymization, responses were analyzed using a constant comparative thematic analysis approach.20,21 The theoretical underpinnings were constructivist in epistemology, experiential in orientation, and inductive in analysis, using latent, open, and axial coding to explore the ideas behind the data.21,22 Iterative discussion of the transcripts was employed to define underlying ideas, patterns, or assumptions, to which codes were assigned. The data was fractured based on these codes (open coding) and rearranged to further identify patterns (axial coding). All coding was completed manually by the principal researchers (JH and AJ).
The principal researchers worked as Clinical Fellows in Medical Education. They were also clinical students at the same institution as the study, providing insight into the clinical student experience. The researchers have a personal interest in medical education that developed in observations of the curriculum in question when they were students. The principal researchers designed the educational intervention and were therefore invested in the evaluation and future development of the program. The researchers utilized this positionality reflexively in the thematic analysis. 23 None of the interviewed students were students of the interviewer. Findings are reported following the recommendations outlined in the Consolidated Criteria for Reporting Qualitative Research checklist, and a completed checklist is available as Supplementary Table S1.
R and the RQDA package were used for data management. 24
Triangulation Protocol
Triangulation was performed between UCEEM data and focus group data postintervention.
To robustly compare the data from the UCEEM and focus groups, a data triangulation protocol was developed to compare any qualitative dataset to a quantitative inventory, adapting from a triangulation protocol described in “Developing and Implementing a Triangulation Protocol for Qualitative Health Research” by Farmer et al 25 for comparing 2 qualitative datasets. The steps in the adapted protocol are shown in Table 1, and the stages up to the end of “Convergence coding” are summarized in Figure 1.
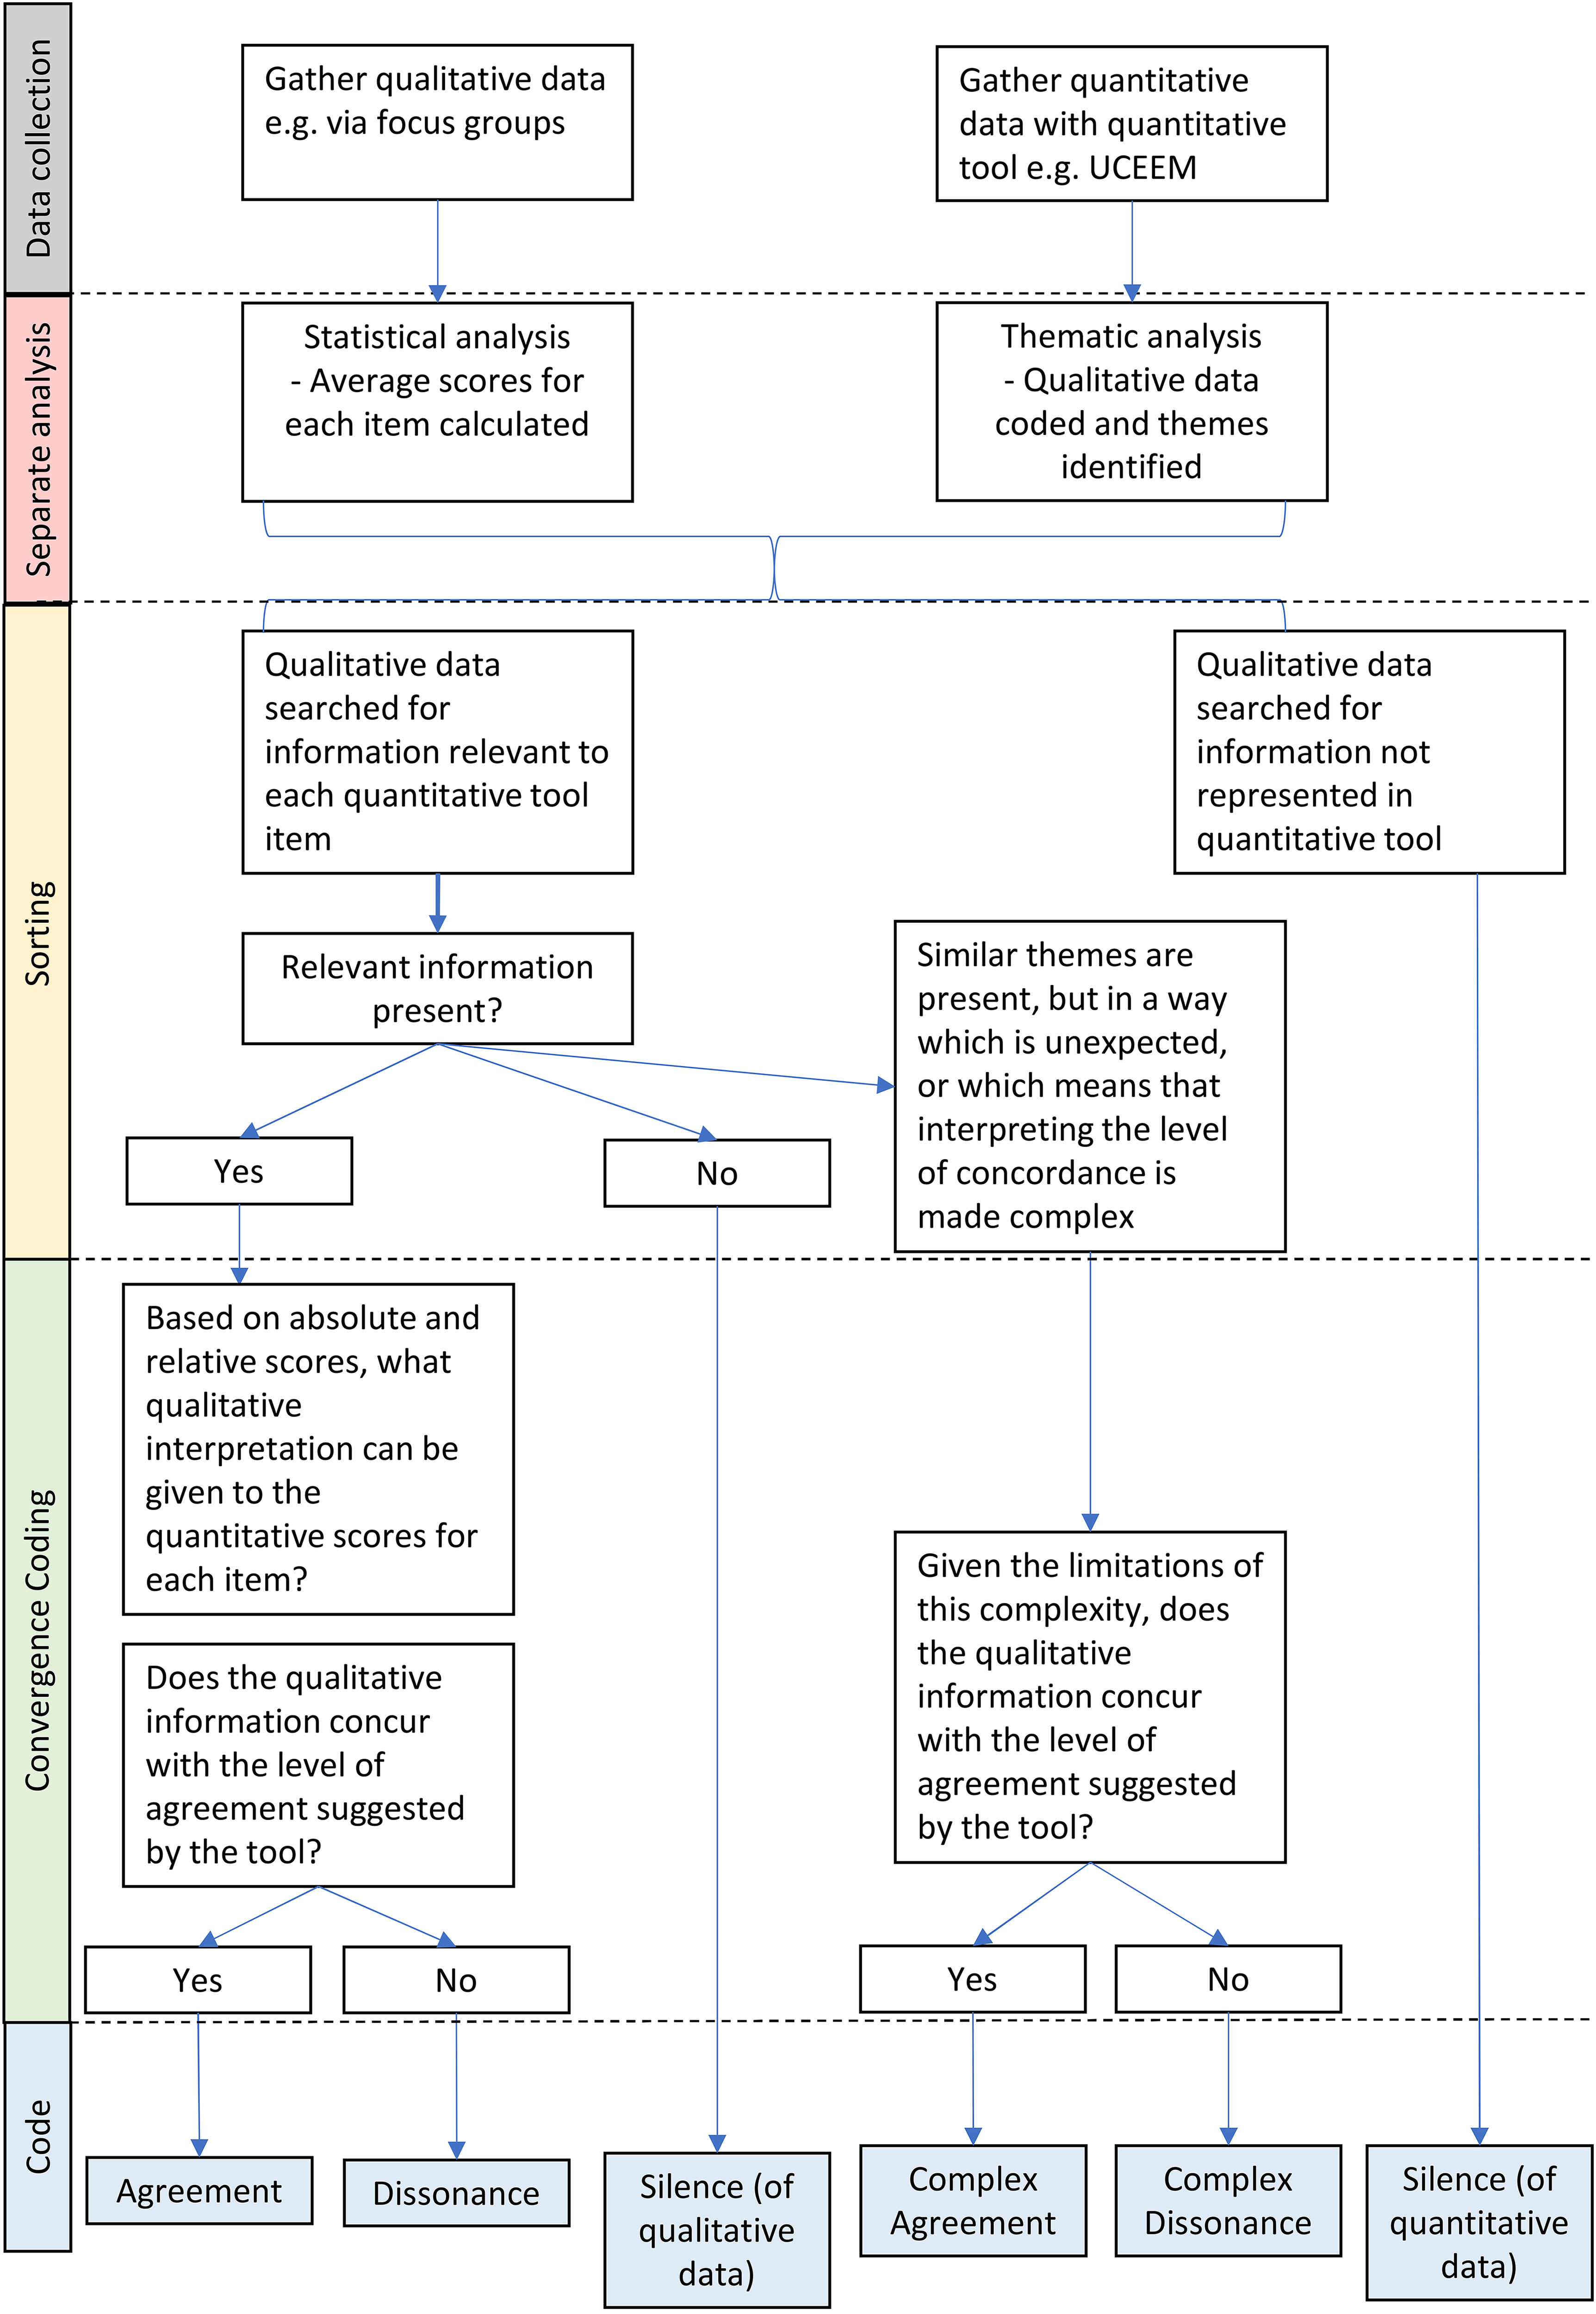
Summary of the triangulation process.
Stages of the triangulation protocol.

Two stipulations are relevant to this use case. The 2 researchers independently analyzed the datasets before meeting to discuss and integrate their work. UCEEM scores were interpreted by quartile rather than absolute value. This was necessary due to pronounced ceiling effects—even “low” scores had a high absolute value. The first quartile was interpreted as “Poor,” second as “Acceptable,” third as “Good,” and fourth as “Excellent.”
An alternative way to evaluate scores in a dataset with fewer ceiling effects would be to utilize the interpretation of the DREEM scoring system offered by McAleer et al. 26
Ethical Review
The project was reviewed and approved by the Cambridge Higher Education Research Ethics Committee (CHESREC)—Reference number 2020.ET.16_Jones.
Results
Study Population and Response Rate
The preintervention course was delivered to 54 students. The postintervention course was delivered to 256 students. All students were invited to fill out the UCEEM. Preintervention, 11 students completed the questionnaire; postintervention, 73. The response rate was thus 20.4% and 28.5%, respectively. The distribution of respondents by age and sex is shown in Table 2.
Characteristics of the population.

All students who attended the course postimplementation of the intervention were invited to take part in a focus group. In total, 11 students were interviewed over the course of 5 focus groups, 4 of which had 2 participants; the remaining had 3 (response rate 4.3%).
Statistical Properties of UCEEM
Correlations and Distributions of Scores
The mean scores for each domain (as a percentage of the maximum possible) and for the UCEEM overall are shown in Table 3, alongside ceiling effect values for each domain. There are notable ceiling effects in most domains but zero floor effects and these were therefore omitted from the table.
Undergraduate Clinical Education Environment Measure (UCEEM) scores preintervention and postintervention by domain.

Internal Consistency
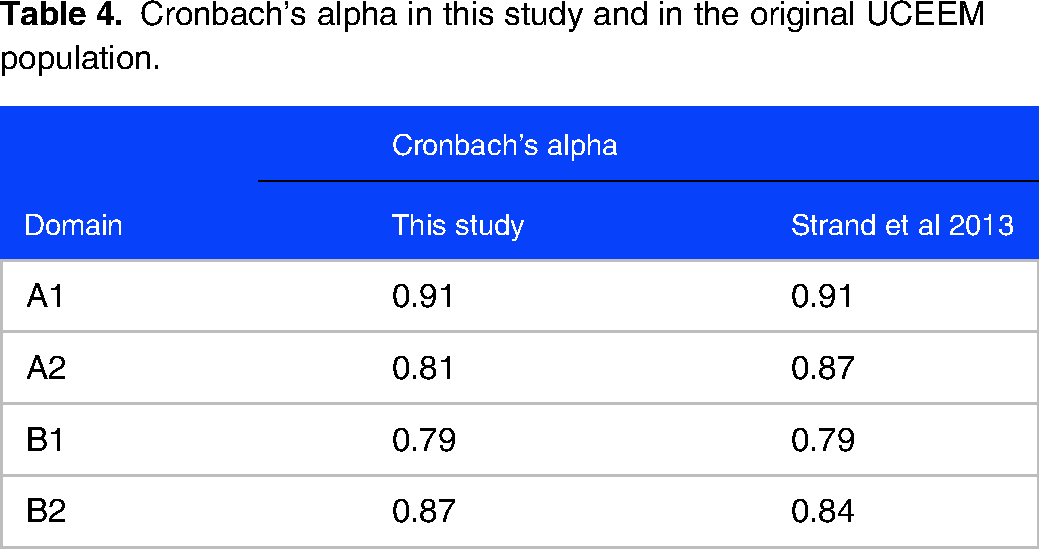
Table 4 shows the Cronbach's Alpha for each domain alongside the Cronbach's alpha calculated when the tool was constructed.
Cronbach's alpha in this study and in the original UCEEM population.
Response of UCEEM to Intervention
Significant improvements in the score were found in domains A1, A2, and B1: “Learning in and through work and the quality of supervision” (P = .048), “Preparedness for student entry” (P = .033), and “Workplace interaction patterns and student inclusion” (P = .039). No significant change was found in domain 4, “Equal treatment” (Table 3).
There was a significant increase in the total UCEEM score (P = .008).
Thematic Analysis
Data was coded under 3 categories that arose in the discussion; ideas relating to clinical placements in general, to the placement under investigation and to learning methodology.
In the thematic analysis, 3 key themes relating to what students found important in their view of any CLE were identified, each with 3 subthemes. One overall theme about student's perception of the postintervention environment at Papworth was also identified. These are summarized in Table 5. A full exploration of the thematic analysis, with representative quotations, is available in Appendix 2.
Results of the thematic analysis.

Triangulation
Comparison of the UCEEM results with focus group data as per the novel triangulation protocol revealed an overall moderate agreement between the 2 data types, with several layers of complexity and nonoverlapping elements. A summary of the concordance between UCEEM and thematic analysis can be found in Table 6. A detailed summary of the triangulation is given in Appendix 3.
Summary of the findings of the triangulation of quantitative and qualitative data.

There are 6 UCEEM items where passages from the focus groups directly referred to the idea at hand and agreed with the quantitative evaluation of success in that area. No ideas that appear in both data sets were in clear opposition to each other. Four ideas evaluated in the UCEEM did not appear in the qualitative data.
Meanwhile, 1 idea that was prominent in thematic analysis was not evaluated by the UCEEM—receiving appropriate levels guidance as to what needs to be learned and how to learn it within a given environment.
For the remaining 14 UCEEM items there was “complex agreement,” as students in the focus groups raised related ideas, either on their own or alongside direct mentions of the “pure” UCEEM idea.
Discussion
Summary of Main Findings
This study has 2 main findings. First, the comparison of UCEEM scores from before and after an educational intervention shows good internal consistency and responsiveness to change but notable ceiling effects in this educational context. Second, the parallel qualitative evaluation of the intervention and CLE and subsequent triangulation with the UCEEM shows that student's stated impressions and concerns overlap with the content of the UCEEM, but some ideas are discordant or complex in the way they relate to each other. These findings complement previous research and have important implications for the interpretation of the UCEEM as a tool.
Interpretation of the Results and Comparison with Previous Studies
Performance of the UCEEM in Measuring the Impact of an Educational Intervention
The quantitative performance of the UCEEM in assessing the impact of the intervention has implications when considering the internal consistency, responsiveness, and construct validity of the measure.27,28
This study replicates measures of internal consistency (Cronbach's alpha) reported by other studies: Those of Strand et al using their initial construction dataset 7 and those in a recent analysis of the tool by Fouad et al13,16,29
Furthermore, this study demonstrates the UCEEM is responsive to interventions targeting the CLE. Previous works compare scores over different specialties or between students of different types, but not in response to interventions.14,30 This study found that the UCEEM was able to detect significant improvements in 3 of its 4 domains.
However, the data also demonstrates that the UCEEM can be subject to significant ceiling effects in all 4 domains. This is not what was described in the data set used to construct the UCEEM, in which there were no ceiling effects except in domain B2, “Equal treatment” (35.8%). 10 Meanwhile, a large study based in the United Kingdom reports median UCEEM scores more than of 4 out of 5 for questions within domain B2, also indicating significant ceiling effects. 14 Studies based in Iran and a further study in Sweden do not report ceiling or floor effects at all.15,29 This finding may have 1 of 2 implications: Either the range of UCEEM scores used by students differs in different populations (in other words, there may be reduced cross-cultural validity), or the CLE in this study was particularly favorable, accounting for the high ceiling effects and higher scores. If this is the case, the UCEEM may have reduced discriminatory ability in these highly favorable settings. Further experience with the UCEEM in a range of settings is needed to clarify this effect.
Relationship of the UCEEM to Parallel Qualitative Data
This work is the first to the knowledge of the authors using mixed methods to compare the output of the entire UCEEM to qualitative data in the context of evaluating a new educational intervention, an area of research highlighted as important by the creators of the tool.17,31 This has implications for the content validity (which can be divided into relevance and comprehensiveness) and comprehensibility of the UCEEM.27,32
Content Validity
The themes defined from the qualitative data echo the UCEEM domains, confirming the relevance of the UCEEM content across settings. Theme 1 and its subthemes build a picture of an environment in which students are included and integrated, mirroring UCEEM domains B1 and B2. Theme 2 concerns how students access learning opportunities, which appears in UCEEM domains A1 and A2. Elements of sociocultural learning theory and social constructivism can be seen in both these themes. 33 Meanwhile, the focus on adult learning and consideration of individual needs identified in Theme 3 parallels the UCEEM domain B1.
No significant themes were identified that do not appear in the UCEEM, suggesting a high degree of comprehensiveness. Only one such idea was identified—that “Receiving appropriate levels of guidance as to what needs to be learned and how to learn it within a given environment” is important to an effective CLE. Conversely, there were several items represented in domain A1 of the UCEEM that did not appear in the qualitative data. This included affording students the opportunity to discuss their own learning rationale or develop their own problem-solving skills. Thus, the areas of silence in each dataset both concern learning methodology. This component of student learning may therefore be less well investigated through routes that are theoretically tied to the concept of the CLE. The qualitative data also failed to include “Feeling welcome in the staff room/lunch room,” which may be unlikely to arise spontaneously unless there were concerns.
Overall, the qualitative data suggests that the content of the UCEEM is both relevant and largely comprehensive. This aligns with previous work. Gruppen and others have used a 4-domain model to evaluate CLEs, breaking them down into the personal, the social, the organizational and the material.34-36 A review of different measures of the learning environments suggested that the UCEEM adequately covers all 4 of these domains and indeed this sample gathered the aforementioned information in the social and organizational domains missed by qualitative interviews. 12
Comprehensibility
Turning to the comprehensibility of the UCEEM: Previous work has found that found that that there may be a disconnection between how investigators interpret the output of domain 4 of the UCEEM (Equal treatment) and the true student perception of that area, with nuance swept “under the rug”. 31 This study did not replicate this finding; however, it did find several areas where there was “complex agreement” between the triangulated data. It seemed that some UCEEM scores were driven by different factors than those intended in the tool's design. Two areas were affected: First, items where students were asked about work activities (eg A1-a, A1-b), and second, items where students were asked about the quality of supervision. Regarding work activities, students seem to conflate time in educational activities (eg classroom-based simulation training) with time in clinical environments (eg supervised ABG practice). This effect was revealed in triangulation, where interview questions based on UCEEM items that reference “work” can illicit responses that either refer to clinical or educational work. UCEEM scores in the same items were also variable, likely for the same reason. Regarding supervision, students seem to conflate educational supervision (one on one mentoring or classroom-based teaching) with clinical supervision (observation, feedback, and teaching in clinical settings). This included items asking whether supervisors were adequately prepared, whether there was adequate access to supervision, and how supervisors worked to allow students to learn. UCEEM scores were strongly positive, reflecting similarly positive accounts of educational supervision in the focus groups, but not revealing the more variable experience of clinical supervision which the focus group data demonstrated. This conflation is likely amplified by the intervention university's terminology, in which “supervisions/supervisors” are synonymous with small group teaching sessions. This complexity in interpretation is specific to the context in which the questionnaire is employed, illustrating the risks of superficial interpretation of the UCEEM in isolation.
Strengths and Limitations
This work is best understood in the context of its limitations. Importantly, the response rate for both questionnaires and focus group invitations was low, and a power calculation was not used to determine the minimum group size to detect an effect of the intervention (though an effect was in fact detected, suggesting the samples to be adequate). The low response rate to questionnaires may reflect the lack of incentives and the high frequency of feedback questionnaires that students are asked to complete. This may introduce selection bias into the results, with students holding strong opinions or those more engaged with their education process being over-represented. This may explain some of the ceiling effects observed. However, one would expect a similar cohort of students to respond to both the questionnaire and focus group invitation, meaning that the triangulation is likely still valid. Furthermore, only 6 out of 135 codes (4%) were added in the final focus group, suggesting the study was approaching data saturation.
The students in the pre and postintervention groups were not the same but were at the same point in their clinical curriculum and therefore the cohorts are likely to be comparable. Not all students who completed the UCEEM questionnaire were interviewed in the qualitative portion of the study. While identical participant groups may add confidence in the validity of the triangulation, different samples are appropriate for mixed methodology triangulation with concurrent data collection. 37 The sample sizes are representative of likely use cases for each methodology.
The questions asked during the focus groups may represent another point of limitation. The focus group template loosely evoked the domains of the UCEEM (Appendix 1), ensuring that the gathered data was appropriate for triangulation. An alternative decision would have been to use a more unstructured approach to investigate the degree to which UCEEM items arose spontaneously among student concerns. 38 Future investigations may take this approach, likely using a broader base of students to achieve saturation of ideas.
Implications of the Study
The ultimate goal of measuring any CLE is to be able to improve it. As the UCEEM becomes more widely utilized, it is essential to understand whether it is reliable, valid, and comprehensible in different settings compared to interviews. This work demonstrates that the tool maintains statistical integrity and is able to detect change in response to targeted interventions, though can be subject to ceiling effects. In addition, this novel triangulation protocol, applied to the UCEEM and qualitative data shows that UCEEM remains relevant and comprehensive in a new setting. However, it also highlights that UCEEM scores should be interpreted with caution—in a given setting, their correspondence with the lived experience of students may be complex. A firm understanding of local context and strong qualitative support remain key. Further work replicating triangulation in other settings will further define this complexity and lend further confidence to investigators choosing to employ this tool.
Supplemental Material
sj-docx-1-mde-10.1177_23821205231202335 - Supplemental material for Validity of the UCEEM in use: How Does it Triangulate with Qualitative Data in Measuring the Effect of an Educational Intervention?
Supplemental material, sj-docx-1-mde-10.1177_23821205231202335 for Validity of the UCEEM in use: How Does it Triangulate with Qualitative Data in Measuring the Effect of an Educational Intervention? by Alexander Jones, James Hartley and Nicola Jones in Journal of Medical Education and Curricular Development
Supplemental Material
sj-docx-2-mde-10.1177_23821205231202335 - Supplemental material for Validity of the UCEEM in use: How Does it Triangulate with Qualitative Data in Measuring the Effect of an Educational Intervention?
Supplemental material, sj-docx-2-mde-10.1177_23821205231202335 for Validity of the UCEEM in use: How Does it Triangulate with Qualitative Data in Measuring the Effect of an Educational Intervention? by Alexander Jones, James Hartley and Nicola Jones in Journal of Medical Education and Curricular Development
Supplemental Material
sj-docx-3-mde-10.1177_23821205231202335 - Supplemental material for Validity of the UCEEM in use: How Does it Triangulate with Qualitative Data in Measuring the Effect of an Educational Intervention?
Supplemental material, sj-docx-3-mde-10.1177_23821205231202335 for Validity of the UCEEM in use: How Does it Triangulate with Qualitative Data in Measuring the Effect of an Educational Intervention? by Alexander Jones, James Hartley and Nicola Jones in Journal of Medical Education and Curricular Development
Supplemental Material
sj-docx-4-mde-10.1177_23821205231202335 - Supplemental material for Validity of the UCEEM in use: How Does it Triangulate with Qualitative Data in Measuring the Effect of an Educational Intervention?
Supplemental material, sj-docx-4-mde-10.1177_23821205231202335 for Validity of the UCEEM in use: How Does it Triangulate with Qualitative Data in Measuring the Effect of an Educational Intervention? by Alexander Jones, James Hartley and Nicola Jones in Journal of Medical Education and Curricular Development
Footnotes
Acknowledgments
The authors acknowledge the work of Zilley Khan, Royal Papworth Hospital, Cambridge UK—for general supervision of the research and teaching; Rosie Thompson,—for assistance in the conceptualization of the work. The authors thank Professor Claire Morris for advice; Daniel Watkins and Veena Surendrakumar for assistance in designing and delivering the program.
Author's Contributions
AJ and JH are joint first authors. AJ conceived the initial research concept and educational intervention. JH carried out the qualitative data collection. JH and AJ jointly completed the thematic analysis and prepared the manuscript. NJ provided advice and review of all steps of the project and review of the manuscript.
Declaration of Conflicting Interests
The authors declared no potential conflicts of interest with respect to the research, authorship, and/or publication of this article.
Funding
This research received no special funding. The authors were employed by Royal Papworth Hospital at the time of the research.
Ethical Approval
The project was reviewed and approved by the Cambridge Higher Education Research Ethics Committee (CHESREC)—Reference number 2020.ET.16_Jones.
Informed Consent
Written informed consent for use of questionnaire or focus group data was gathered from all participants.
Data and Material Availability
The datasets used and/or analyzed during the current study are available from the corresponding author upon reasonable request.
Supplemental Material
Supplemental material for this article is available online.
References
Supplementary Material
Please find the following supplemental material available below.
For Open Access articles published under a Creative Commons License, all supplemental material carries the same license as the article it is associated with.
For non-Open Access articles published, all supplemental material carries a non-exclusive license, and permission requests for re-use of supplemental material or any part of supplemental material shall be sent directly to the copyright owner as specified in the copyright notice associated with the article.