
Abstract
Highlights
Targeted screening for asymptomatic carotid artery stenosis may be cost-effective only for adults aged 50 to 80 y at high atherosclerotic cardiovascular disease (ASCVD) risk.
Screening individuals with a 10-y ASCVD risk greater than 30% could substantially reduce lifetime stroke burden while remaining within accepted US cost-effectiveness thresholds.
Screening lower-risk (0%–20% 10-y ASCVD risk) adults provides minimal health gains at significantly higher costs and should not be recommended.
Findings offer a decision-analytic framework to inform future screening guidelines and policy decisions as results from ongoing trials, such as CREST-2, become available.
Stroke is the fifth leading cause of mortality and a major cause of disability in the United States. 1 Of all strokes, 14% can be attributed to thromboembolism from previously asymptomatic stenosis (50%–99%) of the extracranial internal carotid artery. 2 Population-level screening with duplex ultrasonography (DUS) offers potential early intervention for those with asymptomatic carotid artery stenosis (ACAS), but this approach is controversial given evidence gaps regarding its effectiveness and risks. 2
For patients with severe carotid artery stenosis, previous trials involving both symptomatic and asymptomatic patients have found benefits associated with revascularization procedures such as carotid endarterectomy (CEA) or carotid artery stenting (CAS).3–5 However, these procedures also carry a risk of complications, and the optimal approach for managing ACAS remains unclear. The Carotid Revascularization and Medical Management for Asymptomatic Carotid Stenosis Trial (CREST-2) is currently underway to evaluate the risks and benefits of these procedures compared with modern intensive medical management. 6
Currently, the US Preventive Services Task Force (USPSTF) and most US professional societies recommend against universal ACAS screening.7–10 However, several societies recommend considering DUS screening and potential revascularization for asymptomatic patients with multiple stroke risk factors,7,9,10 and evidence suggests a substantial volume of screenings is still being performed in the United States.11–13 Because several factors increase the risk for both carotid artery stenosis and ischemic stroke (IS) (e.g., older age, male sex, hypertension),1,7 targeted screening in high-risk subgroups could reduce the number needed to screen to prevent 1 IS event. The 2021 USPSTF Evidence Review highlighted the necessity for improved risk identification tools. 8 In response to this need, we sought to estimate the cost-effectiveness of one-time, targeted ACAS screening of the US adult population, stratified by atherosclerotic cardiovascular disease (ASCVD) risk using the American Heart Association’s pooled cohort equations (PCEs). 14
Methods
Study Cohort
We developed a microsimulation model of ACAS and stroke for a hypothetical cohort representative of all US adults aged 50 to 80 y without prior transient ischemic attack (TIA) or stroke history (N = 100,473,000). 1 Model individuals were sampled by weights from the 2013–2014, 2015–2016, and 2017–2018 waves of the National Health and Nutrition Examination Survey (NHANES). Extracted characteristics included age, sex, race, history of diabetes, smoking status (current v. any other), total and high-density lipoprotein cholesterol levels, systolic and diastolic blood pressure, history of ASCVD, and hypertension treatment. Since NHANES did not collect carotid artery stenosis status, we probabilistically assigned individuals to initial stenosis categories based on detailed methods described below.15,16
Simulation Model
The model, outlined in Figure 1, tracks individuals’ annual progression or regression of carotid artery stenosis and the occurrences of TIA and IS while monitoring their health outcomes and associated costs over their lifetime. Prestroke natural history followed our previously published carotid stenosis model, which tracked stenosis progression, regression, and revascularization and the incidence of IS based on stenosis category; we added extensions incorporating ACAS screening and TIA incidence for this analysis. 17 Acute and postacute IS events and outcomes were based on another published stroke model that we previously developed and validated. 18 All individuals are subject to age- and sex-specific, non–stroke-related background mortality drawn from the US life tables. 19

Model schematic. Individuals with no history of stroke can progress or regress in carotid artery stenosis severity. Severity of carotid artery stenosis affects individuals’ probability of experiencing a transient ischemic attack (TIA) or stroke. Following a revascularization procedure, individuals are categorized as having 0% to 49% carotid artery stenosis.
Each year, individuals in the 0% to 49% narrowing category may progress to a 50% to 69% stenosis state, while those with 50% to 99% stenosis may advance up to 3 categories (e.g., from 50%–69% to 70%–79%, 80%–99%, or 100%) or regress by 1 annually. We assumed that patients with 100% stenosis cannot regress and are ineligible for revascularization. A higher stenosis severity is associated with an increased annual risk of TIA and IS. Individuals’ risk of TIA is based on their age, sex, and stenosis severity. 20 Any individual who experiences a TIA receives a confirmatory diagnostic test of computed tomography angiography or magnetic resonance angiography in the same year and undergoes revascularization if the confirmatory test reveals carotid stenosis.
Once an individual develops a stroke event, they transition into our previously published acute and postacute stroke model. 18 In brief, patients’ acute stroke outcomes are governed by their resulting modified Rankin Scale score (mRS; a discrete score between 0 and 6, where mRS = 0 indicates no symptoms and mRS = 6 indicates death). A more severe mRS is assigned a higher recurrent stroke risk, higher mortality, lower utility weight, and higher annual poststroke management costs for stroke survivors. See Zhu et al. 18 for further details on the acute and postacute stroke model structure and inputs.
Model Parameterization
We derived parameters, including event rates, probabilities, test characteristics, intervention effects, utility weights, and costs, from several prospective cohort studies and existing literature (detailed in Table 1). Specifically, to determine the baseline probability of moderate-to-severe ACAS (≥50% stenosis) for each individual, we first created a multivariate logistic regression model from the Cardiovascular Health Study (CHS) following the approach of de Weerd et al. 21 and validated this prediction model using a split-sample approach in a test set of 30% of the data. This model was then calibrated to the sex- and age-specific prevalence of ACAS from the de Weerd et al. 15 meta-analysis of population-based studies. More information on this estimation and calibration process is shown in Supplement Section 1. Individuals predicted to have stenosis ≥50% were then randomly assigned to 1 of the 4 stenosis blockage categories (50%–69%, 70%–79%, 80%–99%, or 100%) with weights obtained through calibration to data reported in Hirt. 16 This 2-step approach uses population-based prevalence estimates from de Weerd et al. 15 for overall ACAS prevalence, combined with the clinical granularity from Hirt 16 for distribution within stenosis categories.
Parameter Inputs

ACAS, asymptomatic carotid artery stenosis; CTA, computed tomography angiography; DUS, bilateral Duplex ultrasound scan of carotid arteries; MRA, magnetic resonance angiography; mRS, modified Rankin scale; TIA, transient ischemic attack.
Values and sources of acute and postacute stroke parameters are the same as in our previously published stroke model (detailed in Zhu et al. 2023 18 ).
Detailed in the supplement.
The model uses a 2-stage process for stenosis progression. First, each individual has an annual probability of 0.052 of experiencing any progression. If progression occurs, the extent is determined by sequential conditional probabilities: 79.3% progress by exactly 1 category (e.g., 50%–69% to 70%–79%), 20.7% progress by 2 or more categories, and among those progressing by 2+, 50% progress by exactly 2 categories while 50% progress by 3 categories.
IS risk was calculated using 10-y cumulative incidence functions developed by Ferket et al. 23 Factors used to predict individual risk of IS included age, sex, race, current smoking status, diabetes, antihypertensive medication use, systolic blood pressure, and history of coronary heart disease. 23 To capture the longitudinal development of IS risk, we used 3 datasets (the CHS, the Atherosclerosis Risk in Communities Study, and the Multi-Ethnic Study of Atherosclerosis) in a 2-step approach. First, we calculated each individual’s 10-y predicted IS risk at each follow-up measurement, using the equations by Ferket et al. 23 Subsequently, we applied a linear mixed-effects model, relating this 10-y risk to follow-up time and the interaction between time and baseline stroke risk factors. Estimates from this longitudinal model were then incorporated into the simulation model to update IS risk every 10 y. Supplement Section 2 provides more methodological details about this risk trajectory estimation process. History of TIA, stenosis severity, and history of revascularization affected individuals’ IS risk using separate relative risk estimates that were applied multiplicatively (see Table 1).
Screening Strategies
In our model, a specific subset of individuals receives a one-time ACAS screening, the selection of which depends on the strategy being evaluated and each individual’s risk of ASCVD. In addition to screening none and screening all, we evaluated 7 ACAS screening strategies that were specified based on 10-y ASCVD risk thresholds: >35%, >30%, >25%, >20%, >15%, >10%, and >5%. Individuals’ 10-y ASCVD risks were predicted from the PCEs, using their age, sex, race, diabetes, smoking, total and high-density lipoprotein cholesterol, systolic blood pressure, and blood pressure treatment. 14
ACAS screening aims to identify asymptomatic patients with severe stenosis (≥70%) who would be candidates for revascularization. Following current guidelines, individuals undergo revascularization only if both DUS and confirmatory imaging show 70% to 99% stenosis. 9 Screening follows a 2-stage process, starting with a DUS of carotid arteries, followed by a confirmatory test of computed tomography angiography or magnetic resonance angiography if the DUS indicates 70% to 99% stenosis in either carotid artery. If both tests are positive, individuals then undergo a revascularization procedure (CEA or CAS), as is also recommended for symptomatic individuals.7,9 CEA and CAS are associated with complication risks (stroke or death).5,27 After successful revascularization, individuals’ level of stenosis is categorized as 0% to 49% (which reduces their risk). However, given their prior history of stenosis, they experience an elevated risk of IS compared with those without a revascularization history in the same stenosis category. On average, revascularization reduces the incidence of nonperioperative stroke by 46% in our base case based on results from the Asymptomatic Carotid Surgery Trial (ACST-1), 3 and we varied this assumption in sensitivity analyses.
To ensure adequate precision while keeping the computational time manageable, we simulated 1,000,000 individuals per ASCVD risk groups (8 groups total), sampled with replacement from NHANES. Results were then weighted and scaled to represent the full study population (N = 100,473,000). We verified simulation stability through replications with different random seeds, which confirmed negligible Monte Carlo variation (coefficients of variation of about 0.001 for primary outcomes).
Model Outcomes
Our primary health outcomes were the number of strokes averted and quality-adjusted life-years (QALYs) gained relative to no ACAS screening over the lifetimes of the model cohort. Quality of life was quantified using utility weights for post-TIA and post-IS health states and a disutility weight for revascularization procedures. Total lifetime costs include the costs of TIA and acute and postacute stroke care, costs of screening tests and revascularization, and usual health care costs for individuals without a history of stroke. Costs were assessed from a health care sector perspective and inflation-adjusted to 2023 US dollars. 36 We calculated the incremental cost-effectiveness ratio (ICER) as the additional cost per QALY gained for screening strategies that were not dominated (i.e., more expensive and less effective relative to another strategy). We used a base-case cost-effectiveness threshold of $100,000/QALY. 37 Future health and cost outcomes were discounted annually at 3%. 38
Sensitivity Analyses
We performed a set of univariate sensitivity analyses, varying each model parameter between its 95% confidence intervals or plausible ranges while holding the other parameters constant. We also conducted a 2-way sensitivity analysis on 2 key parameters with large uncertainty and evidence gaps: the efficacy (i.e., relative risk of future nonperioperative stroke) and complication risk of revascularization for individuals with ACAS.
In probabilistic sensitivity analyses, we varied model input values based on prespecified probability distributions and estimated the probability of each strategy being cost-effective at various cost-effectiveness thresholds. The parameter ranges and distributions used in our sensitivity analyses are summarized in Table 1. We report the mean estimates for each model outcome from 1,000 samples of parameter sets from the probabilistic sensitivity analysis as our base-case results, alongside the 95% uncertainty intervals (UIs). Using the results of the probabilistic sensitivity analysis, we also calculated the expected value of perfect information (EVPI) per person, measured as net monetary benefit ($).
We performed all statistical analyses using R (v4.2.2) and programmed the simulation model using the Rcpp package (v1.0.10). The Rcpp code for our simulation model is publicly available at https://acas-microsim.netlify.app/. We followed the Consolidated Health Economic Evaluation Reporting Standards guideline in reporting our study. 39
Results
Model Validation
Summary statistics of our simulated model cohort, stratified by 10-y ASCVD risk, are presented in Supplement Table 1. An increased ASCVD risk was correlated with a higher proportion of men, older age, and greater prevalence of ACAS. Our ACAS prediction model derived from CHS data showed acceptable discrimination (c-statistic = 0.72 in the test set), similar to the performance reported by Poorthuis et al. (c-statistic = 0.75). 40 Our calibrated age- and sex-stratified ACAS prevalence estimates were comparable to data reported in a meta-analysis of population-based studies (Supplement Table 2). 15
Base-Case Results
The mean values and 95% UIs of all population-level outcomes of each screening strategy are reported in Table 2, while individual-level (i.e., per-person) results are shown in Supplement Table 4. Implementing a more lenient screening threshold (i.e., lower ASCVD risk threshold) would consistently result in higher total discounted lifetime costs. Meanwhile, the number of IS events averted would be maximized at a 10-y ASCVD risk threshold of >10%, and total discounted lifetime QALYs were maximized at a threshold of >15%. This nonmonotonicity in health outcomes across screening thresholds is explained by the dual effect of ACAS screening: it diagnoses more cases of moderate-to-severe ACAS for early stroke prevention but simultaneously increases mortality and morbidity due to a larger number of complications from revascularization procedures.
Base-Case Cost-Effectiveness Results
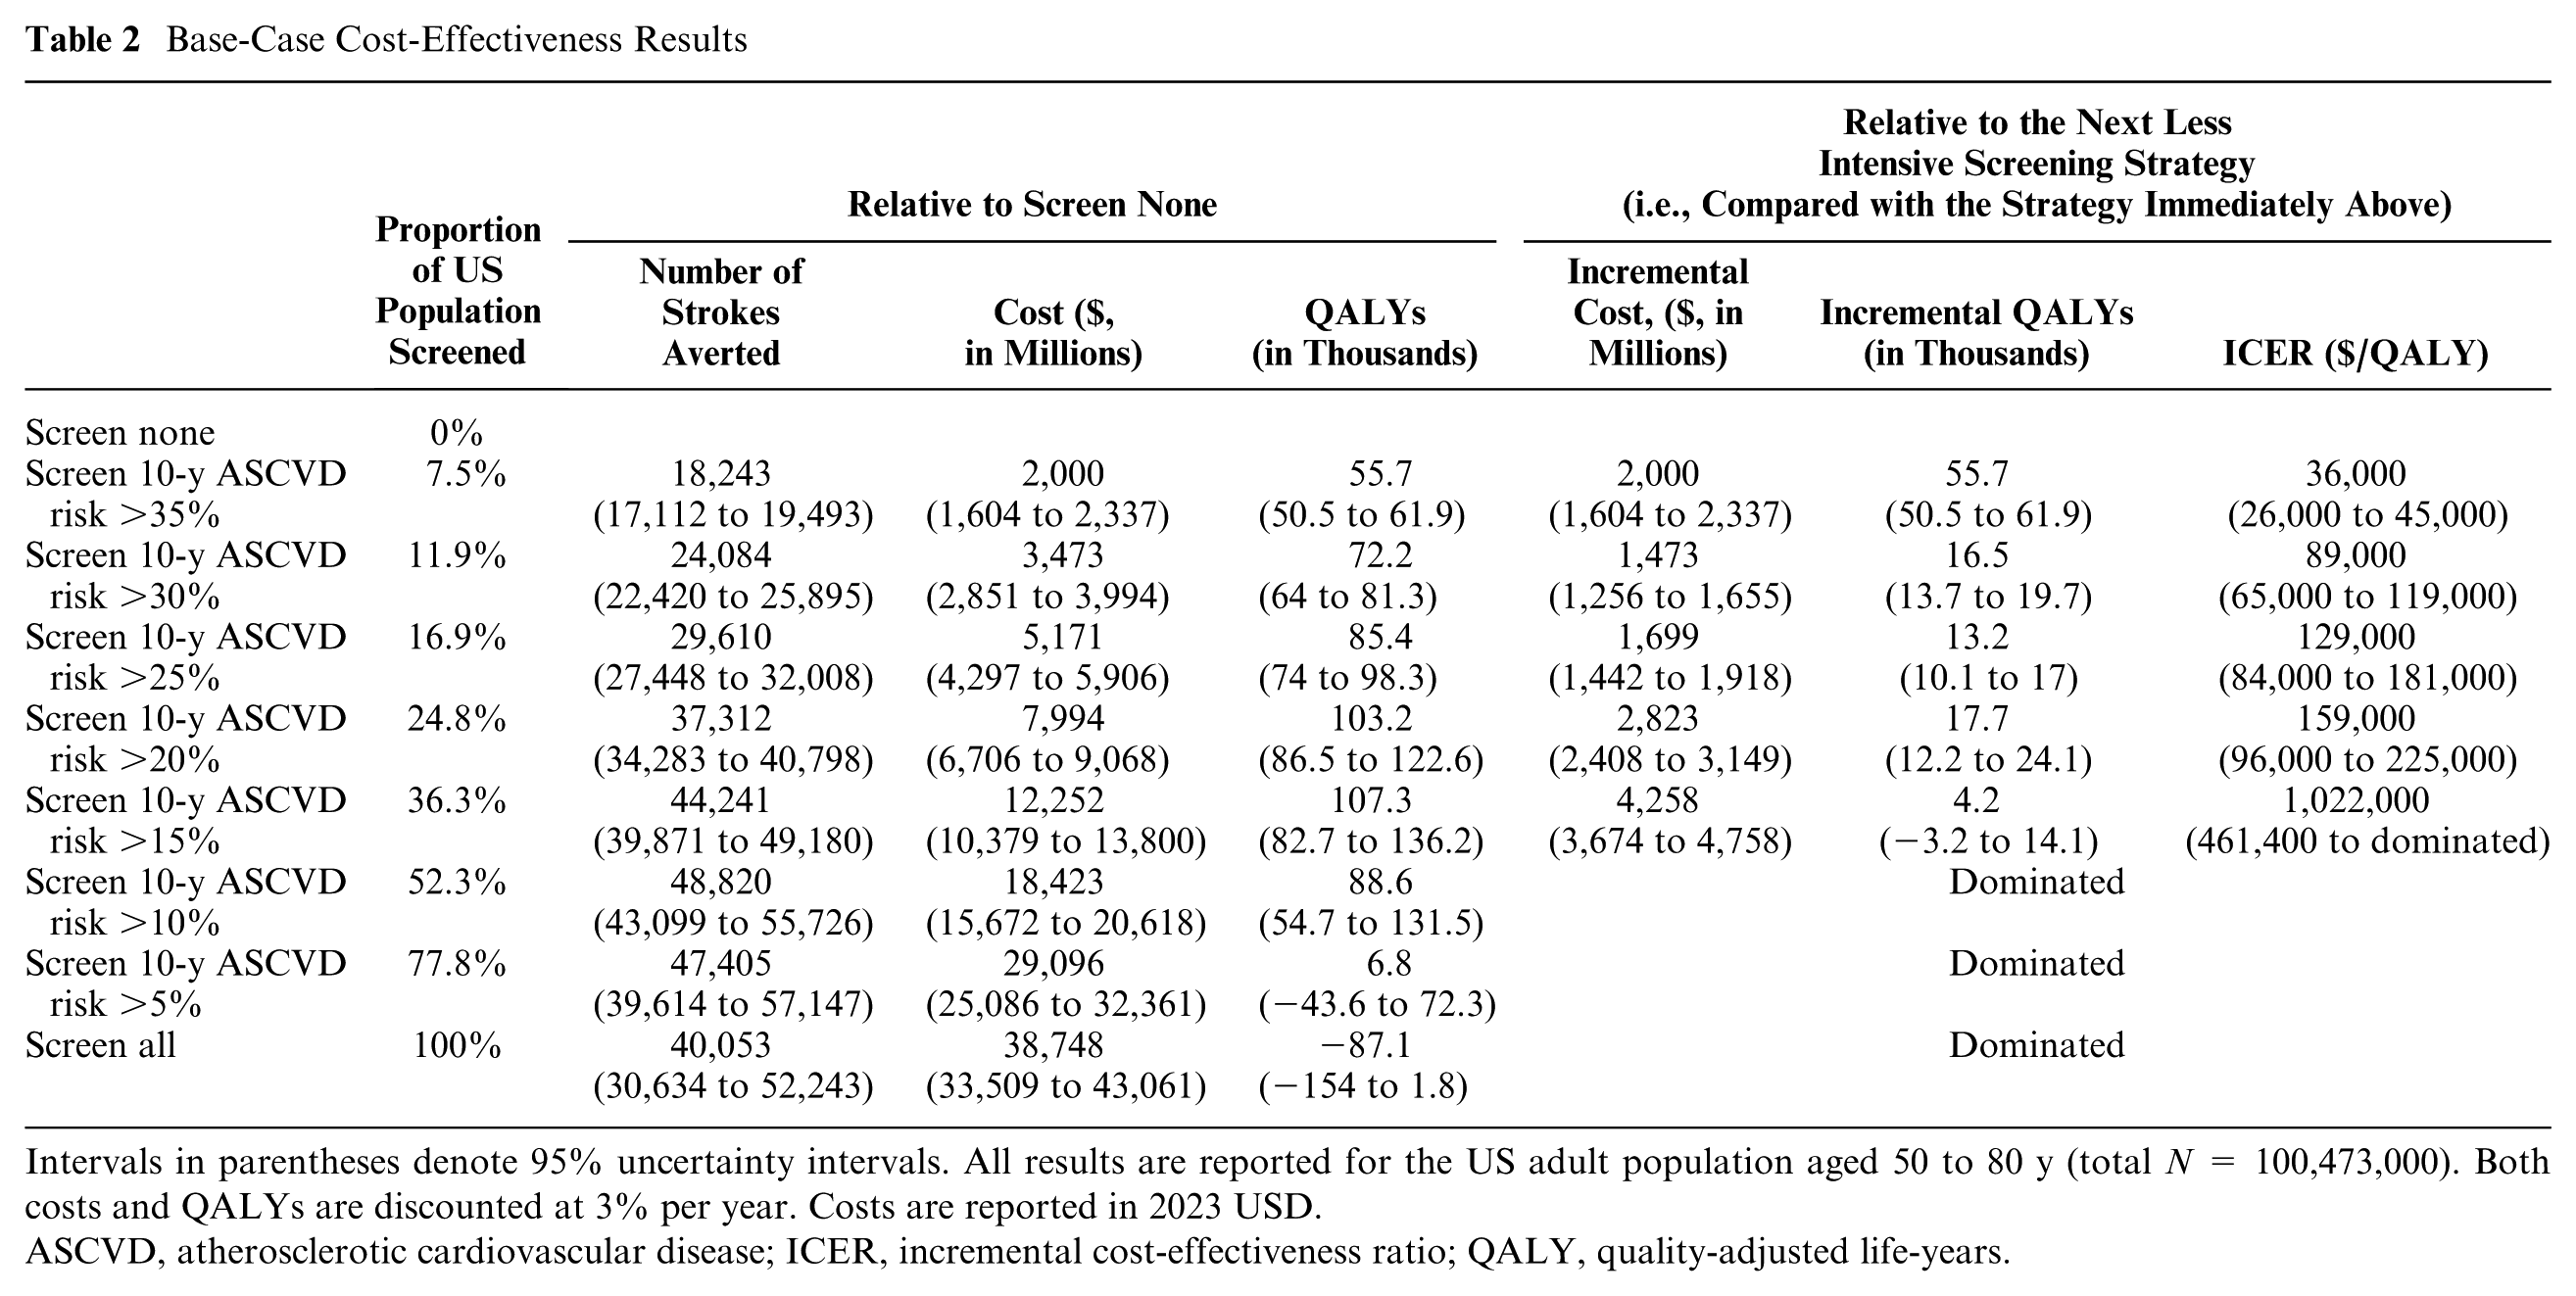
Intervals in parentheses denote 95% uncertainty intervals. All results are reported for the US adult population aged 50 to 80 y (total N = 100,473,000). Both costs and QALYs are discounted at 3% per year. Costs are reported in 2023 USD.
ASCVD, atherosclerotic cardiovascular disease; ICER, incremental cost-effectiveness ratio; QALY, quality-adjusted life-years.
Under our base-case $100,000/QALY cost-effectiveness threshold, the optimal strategy (i.e., most cost-effective) would be screening adults aged 50 to 80 y who have a 10-y ASCVD risk greater than 30%. This strategy yielded an ICER of $89,000/QALY (95% UI, $65,000–$119,000/QALY) compared with screening those with an ASCVD risk greater than 35%. Under this screening strategy, 11.9% of the population was estimated to be eligible for ACAS screening, which could avert 24,084 (22,420–25,895) IS events over the cohort’s lifetime relative to no screening, representing 0.12% of the approximately 20.8 million lifetime IS events expected in this population without screening.
Sensitivity Analyses
When each parameter of interest was individually adjusted within its confidence interval or plausible range, the optimal screening strategy was sensitive to variation in 14 parameters (Figure 2), including stenosis progression and regression rates, performance and cost of screening tests, revascularization efficacy and complication rate, probability of postrevascularization restenosis, and recurrent IS risk. Varying any other model parameter alone did not affect the optimal screening strategy.

One-way sensitivity analysis results. Stars denote the base-case parameter values. The graph displays the 14 parameters that significantly influenced the optimal screening strategy at the $100,000/quality-adjusted life year threshold, as indicated by sensitivity to variations within these parameters. The optimal screening strategy did not change while varying any of the other model parameters. ASCVD, atherosclerotic cardiovascular disease; DUS, bilateral Duplex ultrasound scan of carotid arteries; MRA, magnetic resonance angiography; RR, relative risk.
Figure 3 shows the 2-way sensitivity analysis results, focusing on the efficacy and complication risk of revascularization procedures. We found that ACAS screening would be less favorable with a higher probability of complications or worse efficacy of revascularization than our base-case assumptions. Nonetheless, adopting a higher ASCVD risk threshold for screening (i.e., >35%) could remain cost-effective in some of those scenarios.

Impact of revascularization complications and efficacy on the optimal screening strategy. This heat map represents the results of a 2-way sensitivity analysis evaluating how variations in the probability of revascularization complications and the efficacy of revascularization affect the choice of optimal screening strategy at the $100,000/quality-adjusted life-year threshold. ASCVD, atherosclerotic cardiovascular disease.
Probabilistic sensitivity analysis results are shown in cost-effectiveness acceptability curves and frontier (Figure 4A), where we varied all model parameters at the same time. For a range of cost-effectiveness thresholds from $ 0 to 200,000 per QALY, the acceptability curves show the probabilities of each ASCVD risk-based strategy being cost-effective, while the frontier displays the cost-effective strategy on average. We found large uncertainty in the optimal screening threshold at the base-case $100,000/QALY threshold: using >35%, >30%, 25%, and >20% as screening thresholds had probabilities of 36.0%, 27.8%, 12.0%, and 22.9%, respectively, of being optimal across 1,000 parameter sets. This uncertainty was largely driven by the uncertainty in the cost-effectiveness of screening for the 20% to 35% 10-y ASCVD risk groups. Our analysis robustly showed that screening individuals in the >35% risk group would be cost-effective in 99.3% of the 1,000 iterations. Conversely, screening lower ASCVD risk groups (0%–20%) was almost never cost-effective, as evidenced in only 0.6% of the iterations. Figure 4B displays the per-person EVPI estimate as a function of the cost-effectiveness threshold. At the base-case $100,000/QALY threshold, the EVPI was estimated to be $5.04 per person. The estimated EVPI peaked at about $160,000/QALY, close to the ICER of screening the >25% ASCVD risk group (v. >30%).
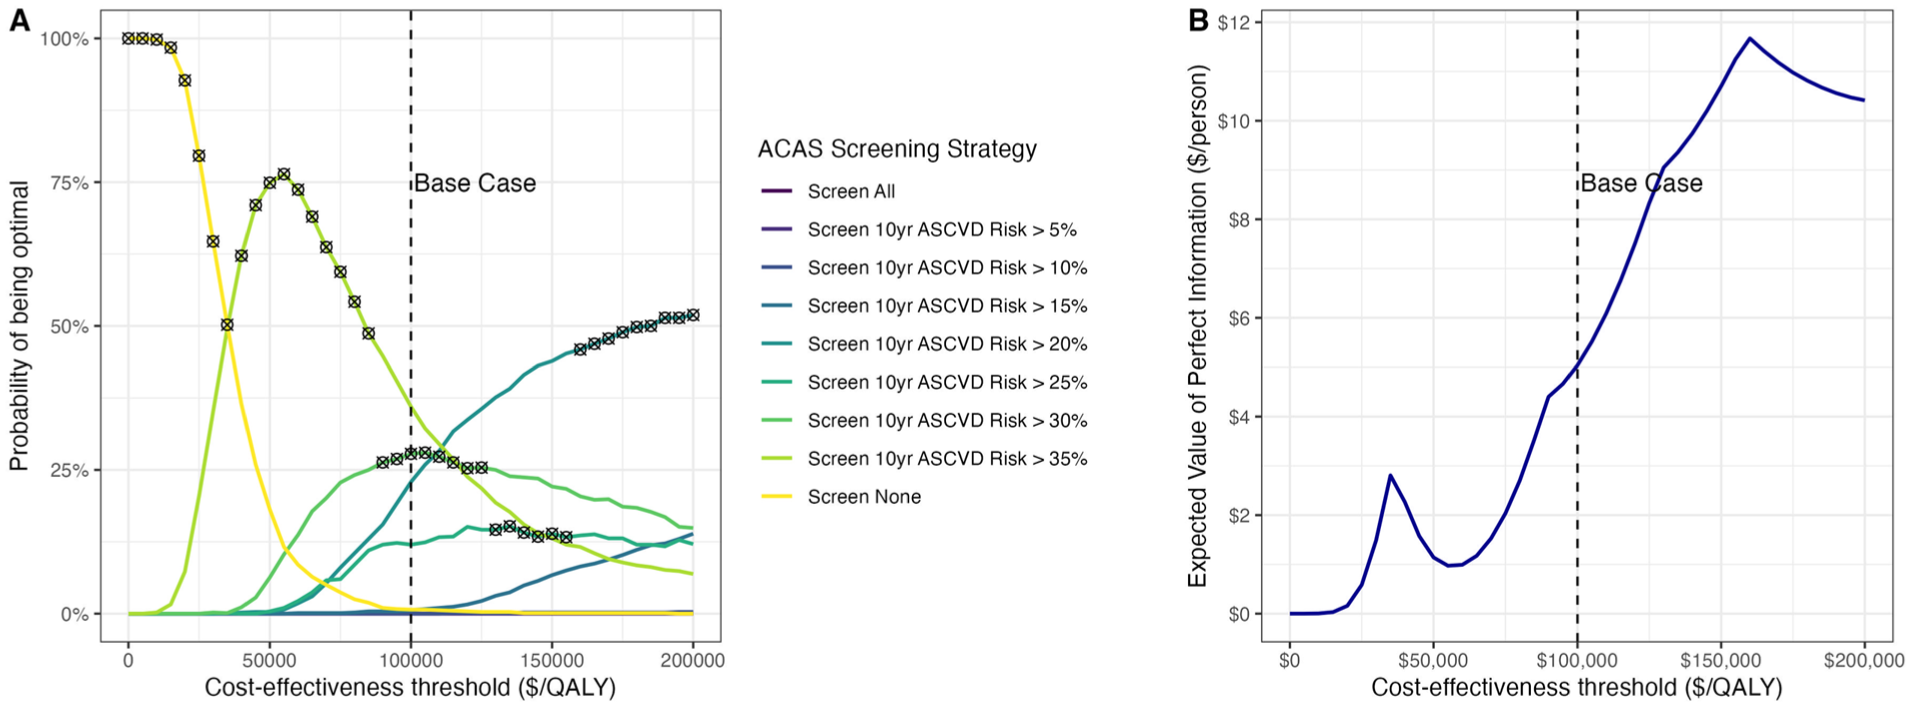
Probabilistic sensitivity analysis results. (A) Cost-effectiveness acceptability curves and frontier. Colored curves denote the cost-effectiveness acceptability curves, showing the probability of a strategy being optimal at different cost-effectiveness thresholds. The black circle crosses represent the cost-effectiveness acceptability frontier, showing the optimal strategy on average for a given cost-effectiveness threshold. (B) Expected value of perfect information per person, as a function of the cost-effectiveness threshold. ACAS, asymptomatic carotid artery stenosis; ASCVD, atherosclerotic cardiovascular disease; QALY, quality-adjusted life-year.
Discussion
Our model-based cost-effectiveness analysis of targeted screening strategies for ACAS showed that screening individuals with 10-y ASCVD risk greater than 30% would meet conventional US standards for cost-effectiveness (<$100,000/QALY). This group comprises 11.9% of the US population aged 50 to 80 y. Most of the gains in stroke prevention would come from screening those at the highest ASCVD risk (>35%).
These results were sensitive to key assumptions regarding the effectiveness and safety of revascularization procedures. Model parameters were based on results from the Carotid Revascularization Endarterectomy Versus Stent Trial (CREST) and the first and second Asymptomatic Carotid Surgery Trials (ACST-1 and ACST-2).3–5 These trials did not compare the efficacy of revascularization plus modern intensive medical management to medical management alone. With modern medical advancements, particularly increasing utilization of antihypertensive and lipid-lowering medications, the benefits of revascularization may be diminishing. 41 CREST-2 is underway to reassess the relative benefit of revascularization compared with intensive medical management alone for ACAS. The SPACE-2 trial 42 found that surgical intervention was not superior to the best medical treatment for ACAS; however, it was underpowered and terminated early due to low enrollment. Therefore, Level A evidence is still awaited from the CREST-2 results in 2026. 43
As CREST-2 nears completion, our study serves as a valuable precursor that frames how its results may influence screening guidelines. Should CREST-2 confirm a relative stroke risk postrevascularization of greater than 0.7, our model suggests the cost-effectiveness balance might shift against any screening (Figure 2). Notably, our findings indicate that screening individuals with ASCVD risk <20% is consistently not cost-effective, a conclusion that is unlikely to be altered by CREST-2 results. Even if CREST-2 confirms a relative stroke risk postrevascularization similar to symptomatic stenosis, our sensitivity analyses show that screening these lower-risk groups remains highly unlikely to meet cost-effectiveness thresholds. Moreover, our EVPI estimate of $5 per person translates to a population-level value of approximately $500 million for the current study cohort of 100 million Americans aged 50 to 80 y, with an additional $20 million annually as about 4 million Americans age into screening eligibility. These findings highlight the substantial societal value of ongoing trials such as CREST-2 in reducing decision uncertainty around ACAS screening strategies.
Our study directly responds to a critical need highlighted by the 2021 USPSTF Recommendation Statement. 8 The USPSTF currently recommends against universal screening for ACAS, supported by most specialty societies.7–10 However, guidelines from the Society for Vascular Surgery 9 and joint guidelines from multiple societies 10 include exceptions for individuals with risk factors for stroke, which are present in nearly 1 in 3 US adults. 1 Previous US-based cost-effectiveness analyses of ACAS screening, conducted before 2000, found that a one-time screening could be cost-effective if implemented in populations with a high prevalence of carotid stenosis or if revascularization procedures were performed by surgeons with low perioperative stroke and death rates.44–46 More recent studies have assessed more sophisticated risk stratification tools (e.g., the Carotid Mortality Index) 47 or ultrasound imaging to assess cerebrovascular reserve 17 and plaque echolucency. 48 However, no modern studies have assessed the value of targeted screening for ACAS. Our study innovates by using individual-level data to predict individual-specific risks of ACAS and IS, incorporating results from more modern trials and stratifying screening strategies based on individual ASCVD risk levels.
For risk stratification, we applied 10-y ASCVD risk estimates from the PCEs. The PCEs are commonly used in clinical practice and would be efficient to implement for potential ACAS screening decisions. Poorthuis et al. 49 investigated the detection rate of ACAS through selective screening by 10-y ASCVD risk thresholds and demonstrated that selective screening could reduce the number needed to screen compared with population-wide screening. Our analysis complements these findings by explicitly identifying the optimal ASCVD risk threshold for selective screening. In November 2023, the American Heart Association introduced the PREVENT (Predicting Risk of Cardiovascular Disease EVENTs) risk prediction equations, which estimate both short- and long-term ASCVD risk while integrating broader health determinants and excluding race as a factor. 50 Should the PREVENT equations start to be adopted in clinical practice, risk stratification for ACAS screening using the PREVENT equations rather than the PCEs could be evaluated in future cost-effectiveness studies.
Beyond ASCVD risk, ACAS-specific prediction models may further increase pretest probability in targeted subgroups. Our calibrated prevalence model already demonstrates large gradients in ACAS prevalence across ASCVD strata (Supplement Table 1). Incorporating dedicated ACAS risk tools (e.g., de Weerd 2014 21 and newer models51,52) into our decision modeling framework could further increase the yield of selective screening and may shift the cost-effectiveness frontier. Advanced imaging and physiological markers, such as magnetic resonance imaging–detected intraplaque hemorrhage and microembolic signals on transcranial Doppler, are stronger predictors of IS risk than ultrasound features are and could also be integrated into future selective screening approaches.53,54 In addition, selective screening confined to patients with established atherosclerotic disease (e.g., coronary or peripheral artery disease) is also likely to be particularly efficient, given the higher underlying prevalence of ACAS and IS risk in these groups. Our calibrated model includes vascular history as a determinant of ACAS probability (Supplement Section 1) and aligns with population-based evidence showing higher ACAS prevalence among those with a vascular history (Supplement Table 2). While we did not separately simulate a strategy solely based on vascular history, the decision framework can be reparameterized to evaluate condition-based eligibility when robust inputs on prevalence, diagnostic yield, and outcomes are available.
Our study has several limitations. First, the NHANES data used to construct the model population did not report individuals’ carotid stenosis status, so we developed a multivariate logistic regression model to probabilistically determine the presence of ACAS. We validated our ACAS prediction model using a split-sample approach and found acceptable but imperfect discrimination (c-statistic = 0.72). Our ACAS prediction model was based on the best model 21 determined by Poorthuis et al. 40 in an external validation study of proposed models to predict ACAS and included all overlapping covariates available in NHANES. That study found that most models proposed for ACAS prediction have modest discrimination; however, they can reliably identify subgroups at high risk of carotid stenosis, which could substantially reduce the number needed to screen to detect ACAS. 40 Second, our study did not account for secular trends in population stroke risk over time, potentially underestimating the ongoing improvements in medical management of stroke risks. 55 Nonetheless, if CREST-2 finds that the benefit of intensive medical management is comparable to revascularization, a targeted screening strategy may still be valuable to identify individuals for whom the potential benefits of an aggressive medical therapeutic regimen outweigh side effects. Third, our analysis assumes that screen-detected patients undergo revascularization when confirmatory imaging shows 70% to 99% stenosis, mirroring contemporary guidelines and the CREST-2 trial design; should future evidence support a narrower operative threshold (e.g., ≥80% stenosis), fewer treated cases would translate into smaller health gains and less favorable cost-effectiveness. Fourth, while the stenosis severity odds ratios from Howard et al. 24 were unadjusted, their stratified analyses support treating these as multiplicative factors. Moreover, varying these parameters across their confidence intervals did not affect our optimal screening strategy (Figure 2), confirming that our conclusions are robust to any potential overestimation in these odds ratios. Finally, while our full simulation model has not been externally validated, key parts have been validated, including the previously published acute and post-acute IS models. 18 We also performed split-sample validation of individual-level prediction of moderate-to-severe carotid stenosis, and the predicted ACAS prevalence was well-calibrated to population-based studies. 15
Based on the current evidence, we estimate that ACAS screening at a relatively high 10-y predicted ASCVD risk (>30%) could be cost-effective. Screening individuals with ASCVD risk <20% remains consistently not cost-effective, underscoring the reliability and robustness of our model in informing current clinical practice. If CREST-2 confirms a relative stroke risk postrevascularization of greater than 0.7, it might shift the balance against any screening. While our results are sensitive to key parameters that will be clarified in the CREST-2 trial, our sensitivity analysis results are structured to allow adaptation to future trial findings.
Supplemental Material
sj-docx-1-mpp-10.1177_23814683251409213 – Supplemental material for Cost-Effectiveness of Risk-Based Screening for Asymptomatic Carotid Artery Stenosis
Supplemental material, sj-docx-1-mpp-10.1177_23814683251409213 for Cost-Effectiveness of Risk-Based Screening for Asymptomatic Carotid Artery Stenosis by Jinyi Zhu, Janice Jhang, Hanxuan Yu, Alvin I. Mushlin, Hooman Kamel, Nathaniel Alemayehu, John C. Giardina, Ajay Gupta and Ankur Pandya in MDM Policy & Practice
Supplemental Material
sj-docx-2-mpp-10.1177_23814683251409213 – Supplemental material for Cost-Effectiveness of Risk-Based Screening for Asymptomatic Carotid Artery Stenosis
Supplemental material, sj-docx-2-mpp-10.1177_23814683251409213 for Cost-Effectiveness of Risk-Based Screening for Asymptomatic Carotid Artery Stenosis by Jinyi Zhu, Janice Jhang, Hanxuan Yu, Alvin I. Mushlin, Hooman Kamel, Nathaniel Alemayehu, John C. Giardina, Ajay Gupta and Ankur Pandya in MDM Policy & Practice
Footnotes
The authors declared no potential conflicts of interest with respect to the research, authorship, and/or publication of this article. The authors disclosed receipt of the following financial support for the research, authorship, and/or publication of this article: Financial support for this study was provided in part by a grant R01NS104143 (Dr. Pandya) from the National Institute of Neurological Disorders and Stroke. The funding agreement ensured the authors’ independence in designing the study, interpreting the data, writing, and publishing the report.
Ethical Considerations
The Institutional Review Board of Harvard University determined that this work does not involve human subjects and waived the need for ethical approval.
Consent to Participate
Not applicable.
Patient Consent
Not applicable.
Consent for Publication
Not applicable.
Data Availability
Computer code: available at https://acas-microsim.netlify.app/. Data: parameter inputs for this study come from sources detailed in Table 1, the supplement, and our previously published study (https://pubmed.ncbi.nlm.nih.gov/37126821/). Data from the CHS, ARIC, and MESA are available following approval of requests submitted at ![]() .
.
References
Supplementary Material
Please find the following supplemental material available below.
For Open Access articles published under a Creative Commons License, all supplemental material carries the same license as the article it is associated with.
For non-Open Access articles published, all supplemental material carries a non-exclusive license, and permission requests for re-use of supplemental material or any part of supplemental material shall be sent directly to the copyright owner as specified in the copyright notice associated with the article.