
Abstract
Highlights
Nonpharmaceutical interventions were used extensively during the early period of the COVID-19 pandemic, but their use has remained controversial.
Agent-based modeling of the impact of these mitigation strategies early in the COVID-19 pandemic supports the effectiveness of nonpharmaceutical interventions at decreasing mortality.
Since such interventions are not specific to a particular pathogen, they can be used to protect against any respiratory pathogen, known or emerging. They can be applied rapidly when conditions warrant.
COVID-19 is a respiratory disease caused by the SARS-CoV-2 virus. 1 The first known case was identified in Wuhan, China, in December 2019.2,3 The disease quickly spread worldwide, being first identified in the United States in a sample from Washington state in January 2020. 4 COVID-19 was first identified in Pennsylvania state on March 6, 2020, with the first recorded death on March 18. 5 At that time, there were no vaccines or effective treatments available. 6 In response to the threat posed by the rapid spread of this disease and the expected large number of associated hospitalizations and deaths, a number of nonpharmaceutical public health interventions (NPIs) were instituted both in the United States and globally to attempt to limit the spread of the disease while treatments and vaccines were developed. Interventions ranged from complete lockdowns of all nonessential activities to more moderate strategies including school closures, closure of nonessential businesses, prohibition of large gatherings, and masking requirements in public spaces. 7 The purpose of implementing NPIs was not to end transmission, since that would likely have been impossible. Rather, the goal was to slow transmission enough to prevent health care systems from being overwhelmed and to protect the most vulnerable groups in the population while vaccines and therapeutics were being developed. Complete quarantine might provide the best protection, but there is a high economic and societal cost to that strategy, as was demonstrated in countries that instituted complete lockdowns.8,9
A number of studies have estimated the impact of NPIs early in the COVID-19 pandemic from data and by modeling.10–18 Modeling and simulation can be useful tools in estimating the impact of interventions and in evaluating timing strategies for those interventions as well as in predicting resource utilization, such as the need for hospital capacity. Understanding the impact of individual interventions and combinations of interventions used early in the COVID-19 pandemic could inform the response to similar future public health emergencies. COVID-19 interventions have been the subject of considerable controversy over the course of the pandemic, so estimating their effectiveness may prove useful in advocating for their use in the future.
We used FRED, the Framework for Reconstructing Epidemiological Dynamics, 19 an agent-based modeling (ABM) platform, to develop a model of COVID-19 to investigate the impact of mitigation orders implemented in Pennsylvania during the period before vaccination became widespread. FRED has been extensively used to model influenza and other respiratory diseases.20–23 The FRED COVID-19 model was calibrated to reasonably match the burden of deaths due to COVID-19 from January 2020 through April 2021 in Pennsylvania. Deaths represent the most reliable disease burden parameter, as case ascertainment was uncertain and varied widely during the pandemic due to early unavailability of testing and to the large number of mild and asymptomatic cases. The model included components that represent or proxy NPIs used to mitigate the pandemic.
Methods
COVID-19 Model
We developed a COVID-19 model by expanding the classic S-E-I-R model to include additional states. The model was parameterized to be specific to COVID-19 using best estimates for R0 (∼3), 18 COVID-19–specific characteristics, and the probability of dying from the disease. Input parameters are summarized in the Supplementary Materials, section 1, Table S1. Supplementary Materials section 2 discusses the derivation of R0 in FRED. We retrospectively modeled the COVID-19 death burden from January 2020 to April 2021, when vaccination had become available to all adults and ∼50% of the Pennsylvania population had received at least 1 dose of the vaccine. The retrospective nature of this modeling effort allows calibration of the entire model duration to actual Pennsylvania COVID-19 deaths. The FRED population was derived from the 2010 census and includes 12,635,942 agents, closely resembling the 2020 Pennsylvania population estimate of 13,002,700 persons (estimated change of ∼300,000 or 2.4% since 2010) in both number and age composition, making the FRED population sufficient to model the epidemic trajectory in Pennsylvania. Agents in the FRED populations have locations in which they interact and spread infection, including where they live, work, and attend school. These locations are derived from census data and from other publicly available data sources. Agents mix in these locations using contact rates and timing derived from existing contact matrices, prior respiratory disease data, and calibration (see Supplementary Materials section 3 for a detailed description). FRED households are realistic to the census block level for household composition, race, and income. 19
The state-transmission model of COVID-19 included susceptible, latent infection, infectious presymptomatic, mildly symptomatic, severely symptomatic, hospitalized, and died (Figure 1). Asymptomatic infections were considered to be included in the mildly symptomatic state. Model transition probabilities were derived from the literature and from publicly available surveillance death data with adjustments to match deaths observed in Pennsylvania. The calibration process is described in the Supplementary Materials section 4. Briefly, initial calibration used estimated R0; disease-specific estimates of length of latent, presymptomatic, and symptomatic periods; and initial case import to match deaths in the period before the application of interventions (Figure 2). The initial model was extended by the addition of NPIs with parameter values varied to produce the reported death data. Deaths were used as the calibration target since data on deaths are more reliable than identified cases, whose ascertainment varied widely during the pandemic. Agents in the model transition to the died state through the hospitalized state. In addition, agents who are nursing home residents in the simulation may transition to the died state directly from the severe state (as happened to many nursing home residents in reality). The hospitalized state has no impact on disease outcome (e.g., no treatment is included).
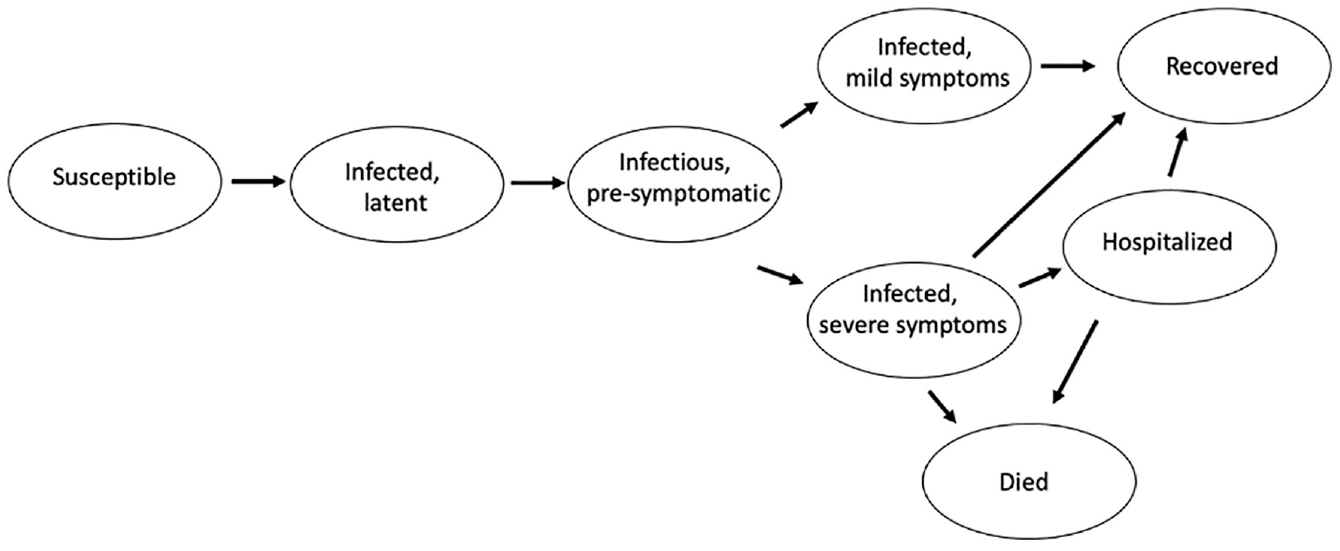
Model diagram. State-transmission diagram of COVID-19 disease progression model.
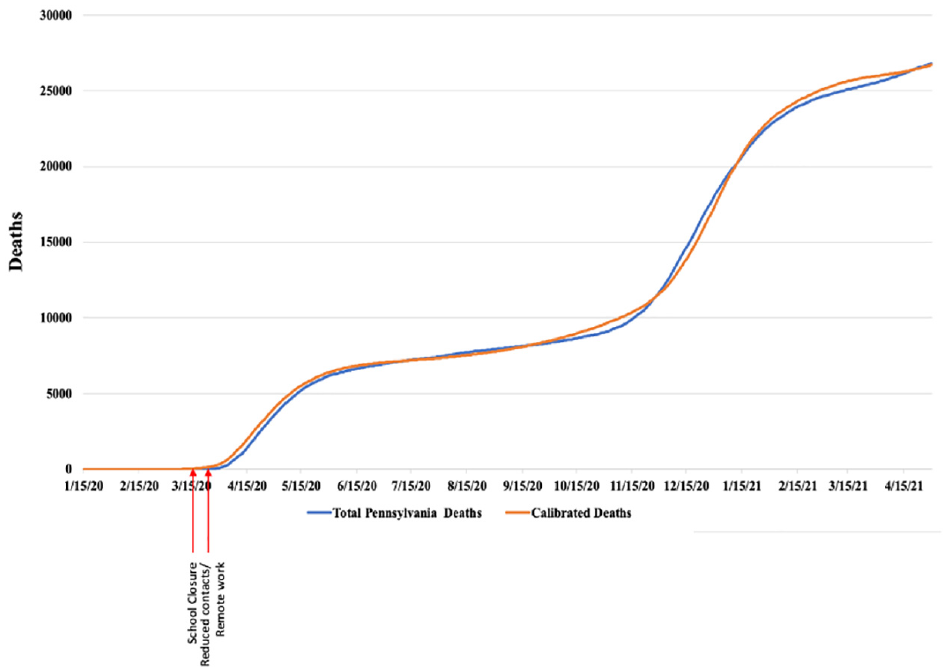
Model calibration. Reported Pennsylvania deaths (blue) and deaths estimated from the calibrated model (orange) from January 15, 2020, to April 30, 2021. Approximate dates of original interventions in Pennsylvania and in the model are in red.
Simulations began on January 15, 2020, and ran until April 30, 2021. The outbreak was initiated by importing cases on February 15, 2020. This date and the number of cases imported to begin the Pennsylvania epidemic were determined empirically to produce an appropriate number of deaths in the spring (Supplementary Materials section 4).
Agents were vaccinated at rates and times corresponding to Pennsylvania vaccination data. Vaccination began in target groups in December 2020. Agents aged 65+ y began vaccination in January 2021.Vaccination consisted of a sequence of 2 shots and provided 95% reduction in susceptibility to infection 2 wk after the second dose. Due to the time frame of the simulation, waning of immunity was not considered essential and was not included in the model. See Supplementary Materials section 5 for details on the vaccination methods and results.
We included the mitigation strategies that were implemented in Pennsylvania during the time frame examined or proxies for those strategies (Table 1). Not all of the mitigation strategies have direct representations in FRED. We used multiple methods for proxying various interventions to represent the change in contact rates or other characteristics of transmission that best fit the observed outcomes. The implementation methods for NPIs are described in the Supplementary Materials section 6. In addition, symptomatic agents voluntarily quarantined at home in the simulation with a probability of 90% (Supplementary Materials section 7). We estimated the impact of multiple scenarios, reporting the expected deaths in each scenario. Simulations are stochastic and were run at 20 individual replications, due to computational complexity and run-time considerations. Model validation and a limited sensitivity analysis are included in the Supplementary Material sections 7 and 8.
Model Implementation of Pennsylvania Nonpharmaceutical Interventions and Their Timing and Use in Simulations

NPI model implementation
NPIs in the model consisted of 3 components: school closure, implementation of teleworking, and reductions in neighborhood contact rates as a composite proxy for mask wearing, closure of public venues, and individual social distancing. The model directly closes schools, so that students do not interact in the schools to which they are assigned. In the simulation, schools were open until March 16, 2020, and then closed. Teleworking in the model is accomplished by having a proportion of individuals in the model not attend their assigned workplace, therefore not interacting in those locations. In the model calibration simulations, 70% of workers were assigned to work from home on March 23, 2020. Contacts were reduced by 70% on March 23, 2020, to mimic distancing strategies. NPIs in the model were adjusted to reflect timing of implementation of orders issued by the state and to produce well-calibrated values for deaths during the simulation time period. Data on deaths were obtained from public Pennsylvania data (Pennsylvania Department of Health opendataPA, data.pa.gov). During the simulation, the proportion of agents working remotely and the reduction in neighborhood contacts to proxy social distancing and mask wearing were adjusted to reflect both data on mobility and as calibration to match reported deaths. 24
Results
Calibration
The FRED Pennsylvania COVID-19 model was calibrated to match death data from January 2020 to April 2021. Figure 2 illustrates the actual deaths in Pennsylvania in that period as well as the FRED modeled estimated deaths in the same period. Arrows indicate the times of implementation of interventions. The calibrated model produced 26,696 mean deaths (stdev 731) from January 2020 to April 2021, closely matching the 26,793 deaths recorded for Pennsylvania for that period.
Deaths lag cases due to time from infection to death. Deaths in the data and in the calibrated model rose steeply initially but then increased much more slowly after NPIs were instituted and decreased transmission. Deaths again rose steeply in the fall of 2020, possibly due to decreased levels of interventions and to the seasonal forcing that is characteristic of a number of respiratory pathogens.
No Mitigation Strategies
Removal of NPIs from the model produces an ∼9-fold increase in deaths in the period ending June 30, 2020 (Figure 3). Due to the high transmissibility (literature estimate of R0 ∼3),18,25 initial transmission would be expected to display a steep epidemic curve that would produce a large case burden in the population if there were no interventions (Supplementary Materials section 7 and Table S4). In the scenario with no NPIs, the model produced 67,718 deaths (stdev 465) compared with the 7,062 deaths (stdev 549) in the calibrated simulation for the period ending June 30, 2020. Over the simulation period January 15, 2020, to April 30, 2021, without interventions the model predicted 68,996 deaths (stdev 454), a 158% increase over the reported 26,793 deaths, reflecting the rapid trajectory COVID-19 would have been predicted to follow without interventions.

No interventions and voluntary distancing. Comparison of reported COVID-19 deaths from January 15, 2020, to June 30, 2021, in Pennsylvania to deaths estimated in the simulation with no interventions or with a percentage of the population voluntarily reducing interactions in their neighborhoods.
Estimated Impact of Behavioral Changes in Response to COVID-19
In the absence of mandated restrictions, individuals may have voluntarily restricted their interactions in response to the spread of COVID-19, so scenarios including no interventions may overestimate the number of deaths that would occur. We estimated the increase in deaths from January to June 2020 with varied levels of reductions in contacts in the FRED model but without mandated mitigation orders, as might have occurred on a voluntary basis. A percentage of individuals in the simulation had reduced interaction levels representing possible levels of voluntary reduction in contacts that might occur during perceived high transmission of COVID-19. Due to the expected rapid transmission in the early months of the pandemic, the impact of voluntary mitigations was evident in the early months of the pandemic (Figure 3). While individuals may have voluntarily avoided school and work, neither of these strategies is practical for the long term without official mandates for school absence and remote work, so those were not included in these scenarios. These hypothetical scenarios do not apply data-driven estimates of the number of individuals who would voluntarily decrease contacts but rather provide the estimated impact of various levels of individual response.
The model predicted a 7.9% reduction in deaths from the no interventions scenario with 10% reduction in contacts (62,336 deaths, stdev 465), 24.1% fewer deaths with 30% reduction in contacts (51,375 deaths, stdev 365) and 40.1% reduction in deaths with 50% reduction in contacts (40,569 deaths, stdev 352), versus 67,718 (stdev 465) deaths in the no interventions scenario over the period ending June 30, 2020.
The model predicts that while voluntary behavioral measures would dampen the epidemic, only high levels of such restrictions in the absence of mandated teleworking and school closure would be sufficient to decrease transmission enough to significantly lower death burden prior to widespread vaccination.
Impact of Delays prior to Instituting Mitigation Strategies
To estimate the impact of delaying the implementation of NPIs, we implemented school closure, social distancing, and remote work in the model at the same rates as in the calibrated model but with a 1-, 2-, 3-, and 4-wk delay (Figure 4).

Delay in implementation of interventions. Estimated impact of 1- to 4-wk delay in implementing mitigation strategies early in the pandemic on estimated COVID-19 deaths from January 15, 2020, to June 30, 2021.
Even a single week of delay in implementing NPIs in the model resulted in large increases in deaths (increase of 8,958 deaths by June 2020). This is to be expected given the high transmissibility of the SARS-COV-2 virus and lack of population immunity at that time, which would lead to a steep epidemic curve and high disease burden in a relatively short time. The impact of delay increased with the length of delay. A 4-wk delay resulted in an additional 38,171 deaths in the simulation versus the calibrated model by June 2020.
Removal of Phased Reopening
Beginning March 19, 2020, all non–life-sustaining businesses were closed and inside service in restaurants and bars was prohibited in Pennsylvania. These restrictions were relaxed in a phased manner beginning May 7, 2020, with counties having low transmission rates being allowed to relax restrictions. We estimated what would have happened if the removal of restrictions had been applied to the whole state as of May 7, 2020, rather than in a phased manner.
Relaxation of restrictions for all counties as of May 7 resulted in 37,980 deaths (stdev 670) by August 31, 2020, an increase of 30,202 deaths over the calibrated model (388.3% increase; Figure 5). Calibrated deaths in this time period were 7,778 (stdev 533), and reported deaths were 7,936. These increases reflect the impact of releasing restrictions when there was still relatively high transmission rather than waiting until transmission had slowed.
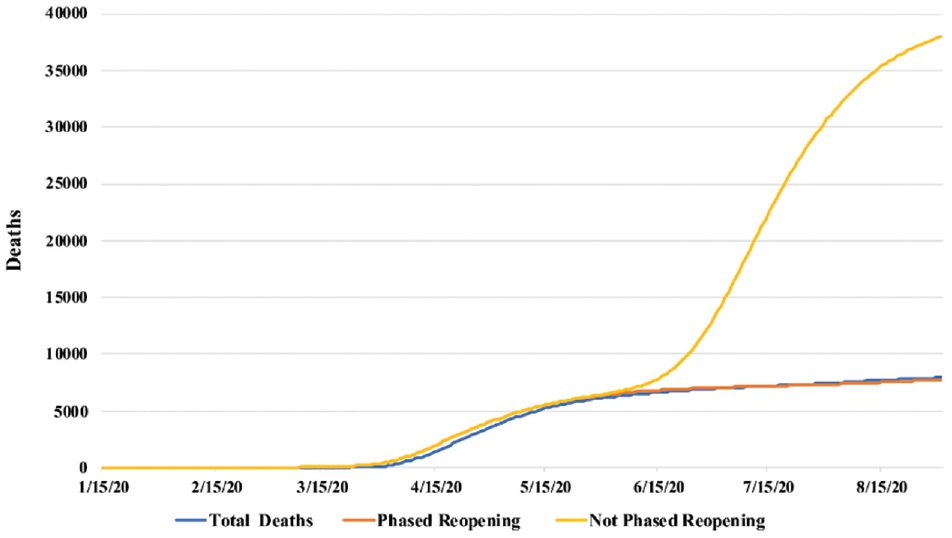
Impact of removal of phased reopening. Effect on total COVID-19 deaths in Pennsylvania with reopening in all counites in state in May 2020 versus phased reopening by current level of cases in county, as per Pennsylvania implementation of mitigation strategy (not phased versus the actual phased reopening).
Impact of School Closure
School closure alone resulted in a decrease in deaths in the simulation from no interventions but only by 15.1% through June 30, 2020 (57,511 [stdev 577] versus 67,718 [stdev 454]) (Figure 6A). School-age agents, while not interacting in schools, will become infected through interactions in the household and neighborhood, so school closure alone can be expected to slow the initial course of infection in the population but will eventually be mostly overridden by transmission in other locations.
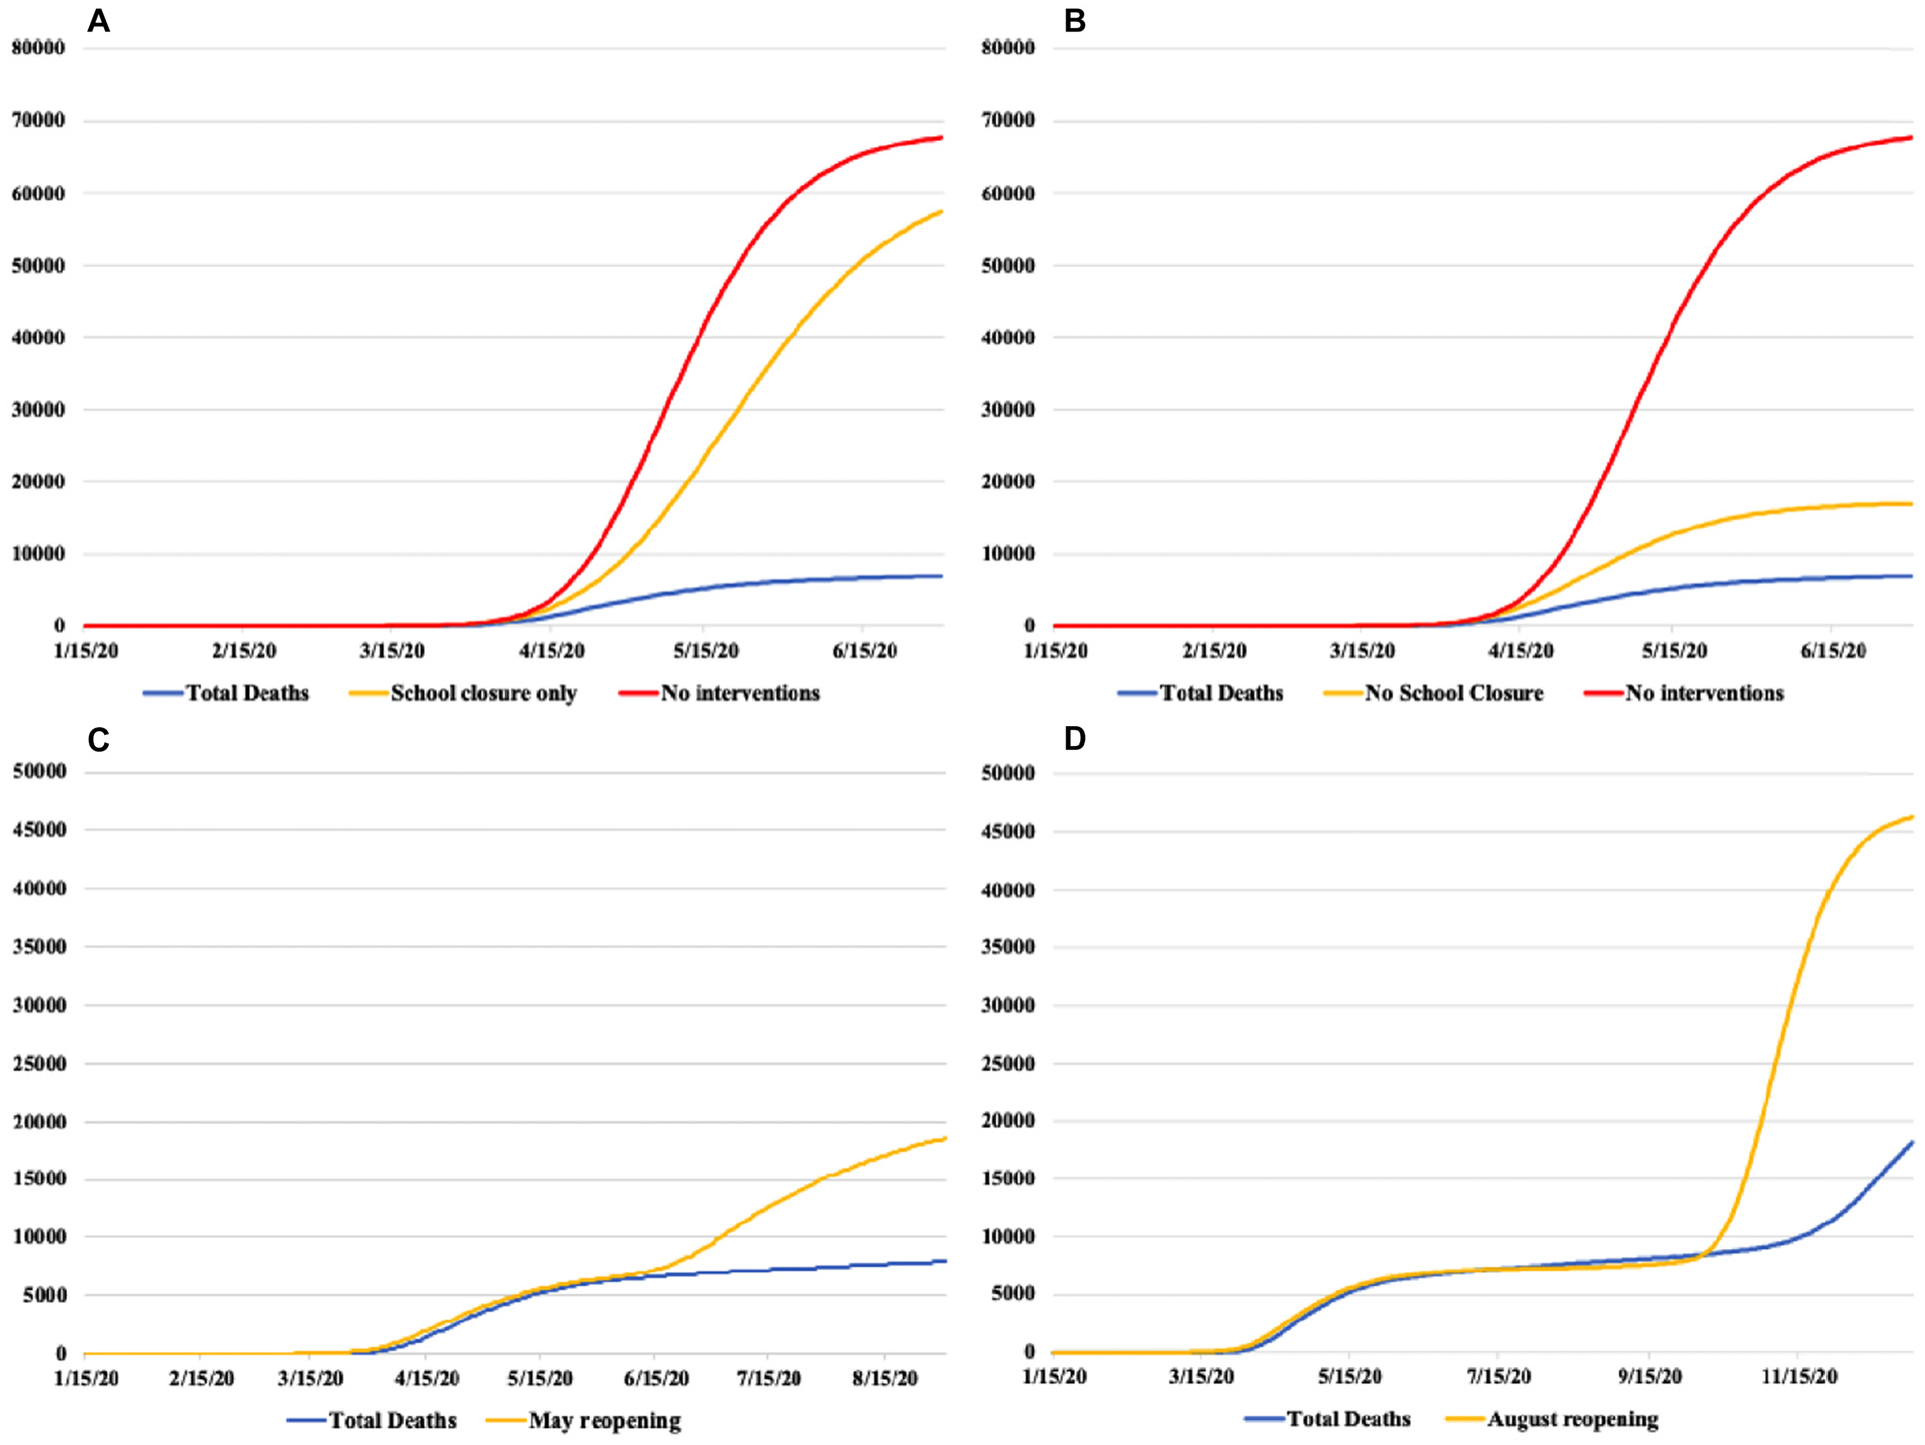
Impact of school closure on COVID-19 deaths in Pennsylvania. (A) School closure as only intervention. (B) Other interventions as in the calibrated model but without school closure. (C) Reopening of schools in May. (D) Reopening of schools at normal fall reopening in late August. x-axis, date; y-axis, reported and estimated deaths.
A combination of remote work and reduced neighborhood contacts in the same proportions as the calibrated model but without school closure was more effective than school closure alone but not as effective as combining all 3 interventions, with an additional 9,980 deaths when schools remained open until June 30, 2020, in the simulation (Figure 6B).
Opening schools earlier in the simulation (in May 2020 when phased reopening began or at start of 2020–2021 school year) while keeping other interventions at the same level as the calibrated model resulted in an increase in estimated deaths whether the opening was in May 2020 (10,735 more deaths by August 31, 2020) or in the following school year in August 2020 (28,771 more deaths by December 31, 2020; Figure 6C and D).
Discussion
In the early part of the pandemic, there were few resources available to respond to COVID-19, as it was an entirely new human pathogen with no vaccine or treatment and testing was extremely limited. 26 Due to the predicted large number of severe infections, COVID-19 had the potential to impose a catastrophic burden on the health care system. The effectiveness of hospitalization and in particular intensive care unit (ICU) treatment degrades when the need for such care exceeds the bed capacity and especially the supply of appropriately trained personnel. Hospital staffing may also be affected by infection of hospital personnel. Under high health care utilization, people needing care for other conditions such as heart attack or stroke may also be unable to receive care. It was therefore vital to decrease the transmission rate of COVID-19 early in the pandemic to deal with pandemic infections and to ensure the availability of health care resources for other medical needs. Interventions were enacted to reduce the risk of hospital surge, and those strategies produced a decrease in the rate of COVID-19 related deaths.27,28
In Pennsylvania, strategies to reduce COVID-19 infections included school closure, non–life-sustaining business closure, restrictions on large gatherings, mandatory masking, and encouragement of remote work. To assist in understanding the impacts of the different interventions, we calibrated an ABM of COVID-19 in Pennsylvania, that included those interventions or proxies for them. The model was calibrated to produce deaths as reported in Pennsylvania. We then changed levels and timings of those interventions to estimate their predicted impacts.
Our simulation results estimate that had there been no interventions, the burden of deaths in the early part of the pandemic would have been much higher, with an approximately 9-fold increase in deaths in the first few months. Deaths leveled off in the no-interventions model after June 2020 due to rapid rise in population immunity in the model population caused by the high level of cases. Reported deaths rose in the winter of 2021, possibly due to lower levels of interventions and seasonal forcing; however, the no-interventions model still estimated an ∼150% excess in lives lost from January 2020 to April 2021. These results strongly support the efficacy of the enacted interventions.
An extensive literature describes NPIs, their efficacy against COVID-19, and their implementation in numerous countries, with reviews summarizing such literature starting relatively early in the pandemic. 7 These studies include epidemiological and modeling studies as well as purely descriptive studies. Modeling on this topic has included both prospective and retrospective modeling of COVID-19 transmission and predominantly uses compartmental models. In the context of NPIs, studies have focused on how their use contributed to decreasing COVID-19 burden before the availability of vaccines and how they could be used effectively in the future to respond to new variants and disease resurgence.29–35
Our study differs from the majority of these in a number of ways. It is agent based, using a census-based population that is statistically equivalent to the real Pennsylvania population. Rather than estimating the impact of an intervention, our system specifies the intervention and allows the impact to develop from changes in the interactions in the population. For example, our model does not estimate how closing schools would change the effective R of a circulating pathogen; rather, the simulation specifies that schools are closed and the change in effective R is caused by the decrease in agent interactions.
While other retrospective studies exist, this study uses calibration to reported deaths in a specific geographic area along with the timing of statewide NPI regulations in that area. This exploits the temporal link between the Pennsylvania interventions and the reported deaths. The calibrated model was then used to estimate what might have happened in the absence of such regulations or if the implementation of interventions had been at different levels or at different times.
The number of deaths due to COVID-19 that would have occurred in Pennsylvania in the absence of interventions is difficult to estimate exactly, since many factors such as voluntary isolation and overcrowding of the health care system could have increased or decreased the death burden. While we present predictions, the predicted numbers themselves are less important than the support that the model results provide for the reduction in death burden due to their implementation. Further, the model supports that single interventions would have been unlikely to have substantially slowed COVID-19 transmission, while bundled approaches are more effective.
Considerable debate has centered on the role of school closure in combating the pandemic, understandably since there are a number of reasons to keep schools open. While an integral component of the mitigations, school closure alone was not sufficient on its own to slow the spread of COVID-19 in the simulation, nor were other interventions as effective in the absence of school closure. Reopening of schools before the population had developed widespread immunity to COVID-19 either in May 2020 or for the following school year in late August 2020 resulted in an increase in deaths, supporting the importance of school closure in decreasing the death burden.
Overall, our simulation results support the effectiveness of the combined COVID-19 interventions at reducing the death burden of infection while vaccines and novel treatments were developed. Specifically, our results support that the combination of interventions was necessary to slow the spread of infection. It is important to note that our results likely underestimate the impact of interventions, as we did not include the capacity constraints that would have occurred in the health care system had the epidemic been allowed to proceed unchecked, which would have overburdened the ICU and other hospital facilities, likely increasing the mortality of COVID-19 and unrelated medical conditions.
Strengths and Weakness
We based our COVID-19 model on a model that has been widely used for a variety of diseases that are transmitted through the respiratory route, so it is a reliable basis for developing this specific model. It has the strength of, for the most part, not specifying the impact of a particular intervention but rather adding the intervention at realistic levels and identifying its impact. For example, schools are closed, and the impact of that intervention develops from the change in interactions in the model rather than having the impact specified. The amount of decrease in neighborhood interactions and the availability of remote work were drawn from public data on commuting behavior and numbers of workers working remote; the impacts of these are outputs of the model, not inputs. We did not include waning of immunity against death in the model since the primary outcome is death; infection can be expected to provide significant protection from death in subsequent infections within a relatively short time period.
Models have inherent limitations. They are simplifications of reality, designed to include the characteristics necessary to estimate outcomes. Our models use probabilities drawn from available data, which is often imprecise. Early in the pandemic, case numbers are expected to be underestimates of the real case burden, particularly in spring of 2020, due to the limited availability of testing at that time. Variations in ascertainment rates and the significant number of asymptomatic and very mild cases occurring throughout the pandemic will also affect the reliability of case ascertainment. For this reason, we used reported deaths, which, while not perfect, can be expected to be more reliable.
Modeling behavior is difficult. Many factors contribute to an individual’s response to a stressful situation, including personal characteristics and reliance on both available information and the attitudes and actions of the individuals with which one has contact. The model included several levels of voluntary behavioral responses to COVID-19, but these are estimates for the rates at which individuals would have attempted to avoid infection in the absence of mandates. It is unlikely that voluntary measures would have slowed transmission enough to avoid overwhelming the health care system, resulting in greatly increased death rates.
It would be beneficial to compare the modeled results to data from areas that did not apply any interventions or introduced interventions at different times, but we are unable to accomplish this. In the United States, even states such as Arkansas, which did not implement lockdowns, had decreases in workplace attendance based on mobility data. 36 All states closed schools for at least some period early in the pandemic. The best, albeit imperfect comparison, might be to China, which abandoned interventions during widespread Omicron transmission and had extremely high rates of disease, although with lower mortality since Omicron appears to cause less severe disease and vaccination was already implemented. 37
The model estimated the immediate health effects of COVID. The model does not include the potential long-term health effects of some of the mitigation strategies such as decreased income, unemployment, and lower school performance. These effects are important but are long term, and their impacts are difficult to quantify and outside of the scope of the current work, which focused specifically on deaths in the early part of the pandemic.
Policy Implications
The results produced by this modeling support the usefulness of the mitigation orders enacted specifically in Pennsylvania in suppressing the surge in COVID-19 deaths that would have occurred before the widespread availability of vaccination, with the model estimating the prevention of up to 60,000 deaths in the early period of the pandemic. These results are consistent with empirical data on the impact of mitigations and are likely broadly applicable to COVID-19 in other locations and to other infectious disease outbreaks. Future public health responses can use these data to inform the response to new infectious disease emergencies, which are likely inevitable. 38
Supplemental Material
sj-docx-1-mpp-10.1177_23814683241260744 – Supplemental material for Modeling the Impact of COVID-19 Mitigation Strategies in Pennsylvania, USA
Supplemental material, sj-docx-1-mpp-10.1177_23814683241260744 for Modeling the Impact of COVID-19 Mitigation Strategies in Pennsylvania, USA by Mary G. Krauland and Mark S. Roberts in MDM Policy & Practice
Footnotes
Acknowledgements
The contents of this report reflect the views of the authors who are responsible for the facts and the accuracy of the data presented herein. The contents do not necessarily reflect the official views or policies of the Centers for Disease Control and Prevention or the Commonwealth of Pennsylvania at the time of publication. This report does not constitute a standard, specification or regulation. The study sponsors had no role in study design; collection, analysis, and interpretation of data; writing the report; or the decision to submit the report for publication.
The authors declared no potential conflicts of interest with respect to the research, authorship, and/or publication of this article. The authors disclosed receipt of the following financial support for the research, authorship, and/or publication of this article: Funding for this work was provided by the Centers for Disease Control and Prevention through the Pennsylvania Department of Health and by the Center for Disease Control and Prevention U01-IP001141-01. The funding agreement ensured the authors’ independence in designing the study, interpreting the data, writing, and publishing the report.
Authors’ Note
This work was conducted at the Public Health Dynamics Laboratory, Department of Health Policy and Management, University of Pittsburgh School of Public Health, Pittsburgh PA, USA. A portion of the results was presented as an abstract at the Society for Medical Decision Making 18th Biennial European Conference, May 2023.
Ethical Statement
The University of Pittsburgh Institutional Review Board has determined that this study was not human subject research and is therefore an exempt study design.
Data Availability
All models and data used for this study will be made available upon request to the corresponding author.
References
Supplementary Material
Please find the following supplemental material available below.
For Open Access articles published under a Creative Commons License, all supplemental material carries the same license as the article it is associated with.
For non-Open Access articles published, all supplemental material carries a non-exclusive license, and permission requests for re-use of supplemental material or any part of supplemental material shall be sent directly to the copyright owner as specified in the copyright notice associated with the article.