
Abstract
Highlights
Of the 3 approaches recommended by the American Academy of Pediatrics in 2018 to identify early-onset sepsis in infants born at ≥35 weeks, the categorical risk assessment approach leads to about twice as many infants receiving evaluation to rule out early-onset sepsis compared with the neonatal sepsis calculator and enhanced clinical observation approaches.
While the hospital costs of the 3 approaches were similar over the entire population of live births, the neonatal sepsis calculator and enhanced clinical observation approaches reduce antibiotic exposure, neonatal intensive care unit admission, and hospital costs associated with interventions as part of the screening approach compared with the categorical risk assessment approach.
This is a visual representation of the abstract.
Evaluation for early-onset sepsis (EOS) is one of the most common clinical scenarios encountered in the care of late preterm and term infants (≥35 wk of gestational age).1,2 While the incidence of EOS is low, there is substantial morbidity and mortality in infected infants.
In 2010, the US Centers for Disease Control and Prevention (CDC) issued guidelines for screening infants at risk for EOS. All infants are screened, and screening determines which infants receive an intervention given high enough concern for EOS. The intervention consists of neonatal intensive care unit (NICU) admission, receipt of empiric antibiotics, and laboratory testing to rule out EOS. Of the infants receiving intervention, only a small subset ultimately has the diagnosis of EOS (i.e., positive blood or cerebral spinal fluid culture).
The CDC-recommended screening approach, also known as categorical risk assessment, calls for intervention in all chorioamnionitis-exposed infants. 3 Chorioamnionitis, an intra-amniotic infection, is diagnosed clinically during labor in 3.1% of mothers and is a known risk factor for EOS.3–6 While chorioamnionitis-exposed infants traditionally receive intervention regardless of their clinical condition due to these recommendations, their risk of culture-positive EOS is low (0.5 cases per 1,000 infants) in late preterm and term infants.1,3,7–9 Recent literature suggests that the presence of multiple potential risk factors for EOS, including chorioamnionitis, inadequately treated GBS carriage during labor, and prolonged rupture of membranes, identifies only approximately half of all EOS cases, illustrating the challenging nature of identifying infected infants.10–12 Furthermore, the rate of EOS is even lower in infants who are clinically well-appearing, largely due to maternal goup B Streptococcus (GBS) screening and intrapartum antibiotic prophylaxis for mothers with chorioamnionitis or GBS carriage.1,7–9 Therefore, intervention in otherwise well-appearing chorioamnionitis-exposed infants can result in unwarranted antibiotic exposure and NICU admission.5,6,13–15
The American Academy of Pediatrics’ (AAP) Committee on Fetus and Newborn issued new clinical practice guidelines in 2018 for infants ≥35 wk of gestational age, including 2 updated screening approaches that aim to simultaneously increase both the specificity and sensitivity of identifying infants without risk factors who develop EOS.16–19 The 2018 guidelines offered 3 screening approaches: 1) categorical risk assessment from the CDC guidelines; 2) the use of the neonatal sepsis calculator, a multivariate prediction model based on 5 perinatal risk factors and clinical examination; and 3) an enhanced clinical observation, with assessment based on serial clinical examinations. 19 The guidelines were not preferential to any approach.
Both the neonatal sepsis calculator and enhanced clinical observation approaches have shown a reduction in antibiotic usage without an increase in adverse outcomes compared with the categorical risk assessment approach.8,10–12,20–25 Therefore, analyses evaluating the resource utilization and costs of the AAP guidelines’ recommended screening approaches are needed to help individual institutions identify an approach that best fits within their own hospital model. In this model-based cost analysis of the 3 AAP-recommended approaches to screen late preterm and term infants at higher risk for EOS, we assessed the resource utilization and costs to the health care system (per infant screened for EOS and per live birth) of each approach.
Methods
Decision Model
We developed a decision tree to model the resource utilization and direct costs to the healthc are system of categorical risk assessment, the neonatal sepsis calculator, and enhanced clinical observation in screening for EOS in our population of interest, infants born at ≥35 wk of gestational age. All infants are screened by 1 of the 3 strategies; this screening determines which infants receive intervention, that is, NICU admission, empiric antibiotics, and evaluation to potentially rule out EOS.
The primary outcome evaluated for each alternative was hospital cost per infant intervened on for EOS and per live birth. Hospital cost included all costs incurred prior to initial discharge, including screening and treatment costs, inclusive of professional fees. Secondary resource utilization outcomes included the percentage of infants receiving antibiotics and length of NICU stay averaged over infants receiving intervention for EOS as well as over all live births. We conducted our analysis in accordance with recommendations from the Second Panel on Cost Effectiveness in Health and Medicine. 26 All analyses were performed using the Amua software. 27
Figure 1a presents a decision tree of an infant’s clinical pathway throughout their first few days of life under the 3 management approaches. Initially, the screening approach determines whether the infant remains under routine care in the well-baby nursery or is intervened on. Those receiving intervention are admitted to the NICU, administered antibiotics, and given diagnostic testing to confirm or rule out EOS (Figure 1b, top). If EOS is confirmed by a positive blood or cerebrospinal fluid culture, treatment duration depends on the pathogenic organism. The model also included the risk of readmission within the first 7 d after birth for EOS for infants with signs of illness following discharge (Figure 1b, center). Base-case terminal outcomes were discharge without long-term sequalae, discharge with long-term sequelae from meningitis such as neurocognitive impairments, or death during the hospitalization (Figure 1b, center and bottom). The associated hospital and professional costs for each branch of the decision tree are listed in Supplemental Table 3.

Decision tree of three management approaches for identifying infants at risk for EOS. (a) Each screening approach identifies some infants to receive intervention to rule out EOS (admission to the NICU, empiric antibiotics, and tests performed (e.g., Cerebrospinal Fluid Culture (CSF), complete blood count with differential (CBCd), C-reactive protein (CRP)). (b) The pathway after intervention decision. These diagrams have been reformatted from the AAP recommendations to facilitate decision analysis.
For all branches of the decision tree, we assumed that the underlying incidence of EOS matched the CDC-reported national incidence of 0.5 per 1,000 live births.28,29 Within each branch of the decision tree, conditional on a given incidence of EOS, the rates of clinical events were consistent with the probabilities observed within each study used to derive them (see the supplemental section “Deriving Probabilities”). We used national CDC surveillance rates for the incidence of meningitis and chorioamnionitis and the EOS case fatality rate.3,28 The remaining model inputs on event probabilities were derived from the published literature, ensuring that all studies reviewed matched our study population of late preterm and term infants. The probability of readmission within the first 7 d of birth with EOS was low given the low incidence of EOS and because most cases of EOS are identified during the birth hospitalization. Additional details on the derivation of probabilities are included in Supplemental Methods and Supplemental Table 1.
Costs consisted of hospital costs prior to discharge (e.g., well-baby nursery and NICU admission, tests, including readmission for EOS) and physician fees. We included physician fees as they represent a large portion of US health care costs.30–32 We did not include childbirth delivery cost and lifetime costs to focus on costs related to the identification of EOS. Cost of hospital admission and physician fees came from a published review of newborn costs per day, derived from discharge data from all California in-hospital deliveries at nonfederal hospitals from 2009 to 2011. 31 We computed the daily cost of a well-baby nursery (level I) and level II NICU admission from the median newborn cost per day from infants 39 to 41 weeks of gestational age and 32 to 36 weeks of gestational age, respectively. Because the average US hospital costs were 67% of those in California, we scaled these California costs to average US state costs. 33 Additional hospital costs for antibiotics and tests were computed from the chargemasters of Nationwide Children’s Hospital (NCH) and Intermountain Medical Center (IMC) with cost-charge ratios of 0.21 and 0.29, respectively, based on the US Centers for Medicare & Medicaid Services (CMS) Hospital Provider Cost report.34–36 We added these additional costs to the daily cost of NICU admissions because we assumed that the median daily cost of NICU admission likely would not include additional tests. All costs included in the analyses were expressed in 2022 US dollars (USD). Following recommendations from the Second Panel on Cost-Effectiveness in Health and Medicine, costs were scaled by the Personal Health Care expenditure inflation up to 2021 and the Personal Consumption Expenditure Price Index up to the most recent year. 26 Further details about costs derivations are included in Supplemental Methods. Model inputs appear in Table 1.
Base-Case Parameter Values and Sources a

Ranges represent the 2.5th and 97.5th percentiles from the distributions given in Supplemental Table 1.
Sensitivity Analysis
We performed 1-way sensitivity analyses, varying all model inputs using ranges given in Table 1, which reflect the 2.5th and 97.5th percentiles of the fitted probability distributions in Supplemental Table 1. In addition, we varied the incidence of EOS between 0.25 per 1,000 live births and 2 per 1,000 live births. Next, we analyzed the effect of tripling the cost of a daily NICU admit, including physician fees, on the hospital cost of each approach. Further, as NCH and IMC costs may not be representative of costs at other US hospitals, we performed sensitivity analysis on their cost-charge ratios. To account for simultaneous uncertainties in our model parameters, we also conducted probabilistic sensitivity analysis using the estimated probability distributions in Supplemental Table 1.
Results
The percentage of infants receiving intervention of NICU admission, empiric antibiotics, and laboratory testing given a higher concern for EOS under categorical risk assessment was 6.84%, compared with 3.60% under the neonatal sepsis calculator and 3.14% under enhanced clinical observation (Table 2). The corresponding hospital cost for infants who received the intervention was $2,668 per infant under categorical risk assessment, $2,719 per infant under the neonatal sepsis calculator, and $2,735 per infant under enhanced clinical observation. When combining the percentage of infants who received intervention with the cost of intervention per infant by EOS screening strategy, the hospital cost for intervention per 1,000 live births would be $182,491 for categorical risk assessment, $97,884 for the neonatal sepsis calculator, and $85,879 for enhanced clinical observation.
Model-Estimated Resource Utilization and Costs Prior to Discharge by Early-Onset Sepsis (EOS) Screening Approach
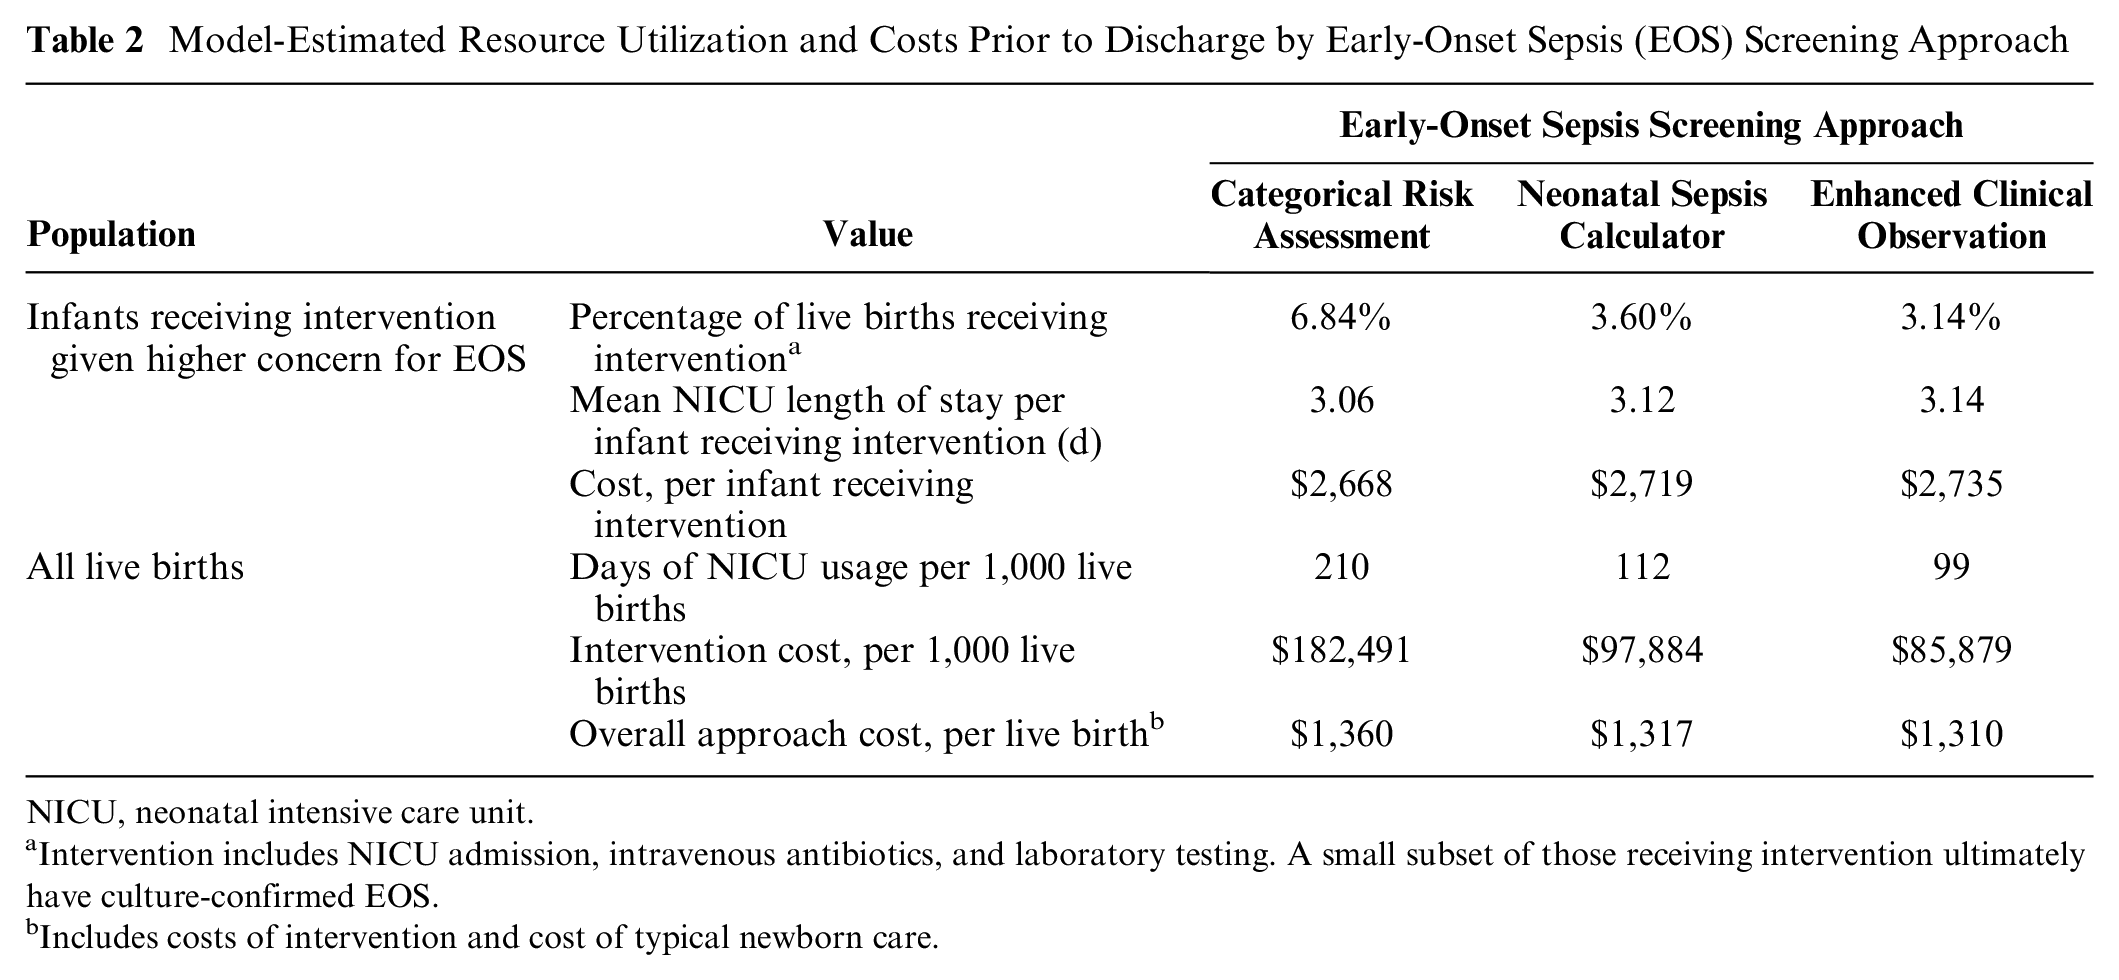
NICU, neonatal intensive care unit.
Intervention includes NICU admission, intravenous antibiotics, and laboratory testing. A small subset of those receiving intervention ultimately have culture-confirmed EOS.
Includes costs of intervention and cost of typical newborn care.
In the categorical risk assessment strategy, more infants are admitted to the NICU for intervention than in the neonatal sepsis calculator or enhanced clinical observation strategies. However, fewer of those infants have culture-confirmed EOS and thus are discharged more quickly from the NICU, which results in a slightly lower average length of NICU stay of those receiving intervention (Table 2). However, the mean number of NICU days over all live births (both infants receiving intervention and not) under categorical risk assessment (210 d per 1,000 infants) was greater than the neonatal sepsis calculator (112 d per 1,000 infants) and enhanced clinical observation (99 d per 1,000 infants).
The average hospital cost per live birth was $1,360 under categorical risk assessment, $1,317 under the neonatal sepsis calculator, and $1,310 under enhanced clinical observation (Table 2). Since more infants undergo intervention due to concern for EOS under categorical risk assessment, categorical risk assessment costs per live birth are slightly more than the neonatal sepsis calculator and enhanced clinical observation due to hospital costs and professional fees being higher in the NICU compared with the well-baby nursery.
Our model estimates (Table 2) correspond with the reported incidences of clinical events in the literature. As the underlying incidence of EOS was fixed across our model at 0.5/1,000 live births, approaches did not differ in terms of incidence of neurocognitive disability and death. The 50% reduction in antibiotic usage from using the neonatal sepsis calculator or enhanced clinical observation approaches compared with categorical risk assessment matches the empirical evidence of the implementation literature that we used to derive data for our model, which has shown a 42% to 63% reduction in antibiotic usage.10,12,20,21,23
Sensitivity Analysis
Reduction in antibiotic usage was robust to variation in all parameters included in the sensitivity analysis. Figure 2a shows the parameters that had the greatest influence on the proportion of infants receiving antibiotics; all parameters not depicted had an influence smaller than 0.25 percentage points. The most influential parameter was the probability that the mother had chorioamnionitis or fever. Even at a chorioamnionitis incidence of 0.8 per 100 live births, categorical risk assessment led to more antibiotic and NICU usage compared with the neonatal sepsis calculator and enhanced clinical observation. Results were also insensitive to incidence of EOS. While the incidence of EOS did not change the percentage of infants screened, higher incidences of EOS led to higher total costs from the infants with EOS. At an EOS incidence of 0.25 per 1,000 live births, categorical risk assessment cost $1,358 per live birth, compared with the neonatal sepsis calculator at $1,316 and enhanced clinical observation at $1,309. At an EOS incidence of 2 per 1,000 live births, categorical risk assessment cost $1,373 per live birth, compared with the neonatal sepsis calculator at $1,331 and enhanced clinical observation at $1,323. Because cases of EOS are so infrequent, the costs of the vast majority of infants do not change when the incidence of EOS changes.

One-way sensitivity analysis. (a) tornado plot (base case) on percentage of infants receiving antibiotics (intervention) and (b) analysis of NICU costs on per-infant hospital cost. All other parameters did not significantly affect the percentage of infants receiving antibiotics or the costliest approach.
The relative total costs of strategies were not sensitive to variations in input cost estimates: categorical risk assessment had the highest costs over all tested cost ranges. For example, when the cost of a NICU admit (including physician fees) is $1,500 per day, categorical risk assessment has $110 greater per-infant hospital costs compared with the neonatal sepsis calculator and $130 greater per-infant hospital costs compared with enhanced clinical observation (Figure 2b). When further increasing the cost of a NICU admit to $2,500 per day, categorical risk assessment becomes more costly by about $210 compared with the neonatal sepsis calculator and about $240 compared with enhanced clinical observation (Figure 2b).
In probabilistic sensitivity analysis, we analyzed uncertainties in all model parameters simultaneously. Supplementary Figure 1 shows the distribution of the percentage of infants receiving intervention (and thus antibiotics) under the 3 approaches using the estimated probability distributions. In 10,000 samples, we found that the empirical 95% confidence interval for percentage of infants receiving antibiotics was 4.6% to 10.5% under categorical risk assessment, compared with the corresponding 95% confidence intervals for the neonatal sepsis calculator (3.1%–4.1%) and enhanced clinical observation (2.1%–4.5%).
Discussion
In this study, we evaluated resource utilization and costs of the 3 recommended approaches for evaluating infants born at ≥35 wk of gestational age for EOS from a hospital perspective. In our analysis, we found that categorical risk assessment results in about twice as much intervention, and thus antibiotic and NICU usage, and separation of the mother-infant dyad, compared with each of the other 2 newer approaches (i.e., the neonatal sepsis calculator and enhanced clinical examination). In addition, the hospital cost associated with infants undergoing intervention due to concern for EOS under categorical risk assessment was double that of the neonatal sepsis calculator and enhanced clinical observation. However, when considering the entire population of live births, the costs of the strategies were similar.
Implementing the neonatal sepsis calculator or enhanced clinical observation may also create a larger impact on the hospital system. First, reduction in NICU bed usage for well-appearing infants unlikely to have EOS can benefit the hospital system by freeing up additional beds to be utilized for sicker infants, potentially increasing revenue and ensuring availability of beds for patients who may require one. Next, while the per-infant cost difference between approaches is small due to the low incidence of EOS, when looking at the entire US health care system with 3.6 million births per year, a $50 cost saving per live birth adds up to $180 million in cost savings per year.
Decisions to implement the neonatal sepsis calculator versus enhanced clinical observation may depend on nurse staffing levels and clinical documentation methods, among other assessments of local resources. While the neonatal sepsis calculator and enhanced clinical observation have not been directly compared in a study, both strategies have been shown to be safe with reported similar infant outcomes between the strategies. For example, implementation of enhanced clinical observation at Lucile Packard Children’s Hospital Stanford included lowering the nurse-to-patient ratios (3 mother-infant dyads to 1 nurse), while implementation of the neonatal sepsis calculator at Kaiser Permanente included building in the calculator within EPIC, the electronic health record (EHR). The neonatal sepsis calculator is currently being built into the EPIC foundation system for automated scoring and is also available via a Web site for hospitals not using EPIC, although this would require an extra step for providers. Both implementations included nursing ratios and EHR add-in represent institution-specific decisions in administering neonatal sepsis calculator and enhanced clinical observation, respectively, and need not be fixed across other hospital systems implementing these approaches. Implementation costs (e.g., training costs for nurses and providers) from the neonatal sepsis calculator and enhanced clinical observation may balance out the costs from additional NICU usage. Although we do not consider implementation costs, the per-infant cost would be low, as they would be amortized over many infants.
With the implementation of newer approaches to evaluate infants for EOS comes the concern that this stratification may lead to potentially delayed or missed diagnosis and clinically devastating outcomes. Nevertheless, there has been no evidence suggesting inferiority in outcomes (such as an increase in delayed or missed diagnosis) despite ample implementation literature of both the neonatal sepsis calculator and enhanced clinical observation, so our model assumes equal clinical effectiveness.8,10–12,20–25 In addition, it is important to note that categorical risk assessment does not automatically capture all infants at risk for EOS. Since half of EOS cases occur in infants without risk factors,10–12 EOS in some infants will be identified only following development of clinical signs of illness, regardless of the approach used. Accordingly, even in hospitals where the categorical risk assessment approach is used, it remains critical to develop systems to rapidly identify infants with clinical signs of illness.
Antibiotic use in infants is not without its risks, and therefore, its use should be best stratified toward infants at highest risk of infection. For example, antibiotic exposure in the neonatal period has been found to be associated with an increased risk of atopy (allergies, eczema, asthma), autoimmune disease, and effects on the microbiome.39–44 Neonatal antibiotic usage may also be linked to ototoxicity.38,45–48 Data were not sufficient to include these clinical outcomes in our analysis, but considering these potential downstream impacts of antibiotic usage would make the neonatal sepsis calculator and enhanced clinical observation more favorable compared with categorical risk assessment.
Limitations
This study has several limitations. First, our analysis took the perspective of a hospital system. Differences between the approaches may be larger if a different perspective was considered, such as the psychosocial impact of a NICU admission on parents or caregivers. We did not model all potential health outcomes, such as all downstream health sequelae of antibiotic receipt as a newborn (i.e., any effects on the newborn’s microbiome) and the impacts of separating the mother-infant dyad (i.e., breast-feeding rates and maternal mental health) because of the lack of empiric data on these outcomes. Because categorical risk assessment leads to more antibiotic receipt and NICU admissions compared with the other 2 approaches, inclusion of any negative outcomes related to antibiotic usage would fall more heavily on categorical risk assessment. In addition, our analysis considered the specific approaches from the institutions from which we derived data. Other institutions may use varying thresholds for the diagnosis of chorioamnionitis and clinical assessments of neonates, which can change the baseline incidence of chorioamnionitis-exposed infants as well as how many receive intervention. While we assumed that infants required NICU admission for the administration of antibiotics, some well-baby nursery units may allow for co-location of the infant while being evaluated for EOS. However, we assumed the neonatal sepsis calculator would be similarly implemented across multiple institutions, as has been described in its implementation literature.8,12,22–25 However, in the sensitivity analyses that account for differing costs resulting from different frameworks of resources, the neonatal sepsis calculator and enhanced clinical observation maintained lower antibiotic usage compared with categorical risk assessment.
Conclusions
We evaluated resource utilization and per-infant costs in a model-based cost analysis of the three AAP-recommended approaches to identify EOS in late preterm and term infants. While the hospital costs of the 3 approaches were similar over the entire population of live births, the neonatal sepsis calculator and enhanced clinical observation approaches reduce antibiotic exposure, NICU admission, and hospital costs associated with interventions as part of the screening approach compared with the categorical risk assessment approach. As individual institutions work toward reducing the number of uninfected infants exposed to antibiotics while accurately identifying infants infected with EOS, they can consider the neonatal sepsis calculator and enhanced clinical observation as potential approaches to identify late preterm and term infants at risk for EOS.
Supplemental Material
sj-docx-1-mpp-10.1177_23814683231226129 – Supplemental material for Resource Utilization and Costs Associated with Approaches to Identify Infants with Early-Onset Sepsis
Supplemental material, sj-docx-1-mpp-10.1177_23814683231226129 for Resource Utilization and Costs Associated with Approaches to Identify Infants with Early-Onset Sepsis by Grace Guan, Neha S. Joshi, Adam Frymoyer, Grace D. Achepohl, Rebecca Dang, N. Kenji Taylor, Joshua A. Salomon, Jeremy D. Goldhaber-Fiebert and Douglas K. Owens in MDM Policy & Practice
Footnotes
Acknowledgements
Grace Guan thanks Todd Wagner and Ciaran Phibbs for assistance with data collection.
Contributors’ Statements
Ms. Guan conceptualized and designed the study, coordinated and supervised data collection, carried out the analyses and interpretation of the data, drafted the initial manuscript, and reviewed and revised the manuscript.
Dr. Joshi conceptualized and designed the study, collected data, carried out interpretation of the data, drafted the initial manuscript, and reviewed and revised the manuscript.
Dr. Frymoyer collected data, carried out interpretation of the data, and reviewed and revised the manuscript.
Ms. Achepohl and Drs. Dang and Taylor collected data and reviewed and revised the manuscript.
Drs. Salomon, Goldhaber-Fiebert, and Owens supervised the study, made substantial contributions to the conception and design of the study as well as analysis and interpretation of the data, and reviewed and revised the manuscript.
All authors approved the final manuscript as submitted and agree to be accountable for all aspects of the work.
The authors declared the following potential conflicts of interest with respect to the research, authorship, and/or publication of this article: The work in this article was supported by the National Institute for Child Health and Human Development (1F32HD106763-01A1) and the Gerber Foundation (9354). The funding support is direct salary support for Dr. Joshi. The contents of this study are solely the responsibility of the authors and do not represent the official views of the National Institutes of Health or the Gerber Foundation. The sponsors were not involved in the study design, data collection, data analysis, interpretation of data, writing of the report, or the decision to submit the article for publication. The abstract of this work was presented as “A Cost Effectiveness Analysis of Approaches to Identifying Late Preterm and Term Infants at Risk for Early Onset Sepsis” at Pediatric Hospital Medicine 2021 and the 43rd Annual North American Meeting of the Society for Medical Decision Making.
Data Availability Statement
All data are publicly available, and references are listed in the supplement.
References
Supplementary Material
Please find the following supplemental material available below.
For Open Access articles published under a Creative Commons License, all supplemental material carries the same license as the article it is associated with.
For non-Open Access articles published, all supplemental material carries a non-exclusive license, and permission requests for re-use of supplemental material or any part of supplemental material shall be sent directly to the copyright owner as specified in the copyright notice associated with the article.