
Abstract
Highlights
A Danish national representative catalog of health-related quality-of-life scores for 199 chronic conditions is presented, which provides population estimates for chronic conditions subgroups that can be used for health economic evaluation.
Two separate regression models of EQ-5D-3L utility scores with different sets of control variables are estimated to allow researchers to adjust for differences in the composition of the subgroups and provide a tool that can be used in other settings.
Results indicate that health-related quality of life varies across disease groups but is lowest for renal disease, mental and behavioral disorders, benign neoplasms and diseases of the blood, digestive systems, and nervous systems.
Health risks and lifestyle factors such as perceived stress, loneliness, and a large body mass index are highly correlated with health-related quality of life, and, in many cases, the correlation is higher than with individual diseases.
Keywords
Health economic evaluation is used in health care resource allocation to assess the relationship between the effectiveness and costs of alternative medical technologies. 1 Quality-adjusted life-years (QALYs) represent a composite measure of survival and health-related quality of life (HRQoL) 2 widely used as a measure of benefit in economic evaluations. 1 The EQ-5D instrument is often used to measure HRQoL,3–6 and this approach is also recommended for health technology assessment, for example, in the United Kingdom. 7 In Denmark, as in many other European countries, EQ-5D–based health economic evaluations (cost-utility analyses) are used regularly for market access approval of new medicines. 8 EQ-5D uses 5 dimensions to describe health: mobility, self-care, usual activities, pain/discomfort, and anxiety/depression. There are now 2 different versions of the EQ-5D instrument. In the original version, EQ-5D-3L, each dimension covers 3 possible levels (no problems, some problems, extreme problems) and can describe 243 unique health states. 5 The EQ-5D health states can, with the help of validated national preference-based utility weights, be combined into a single utility score with an upper value of 1 corresponding to no problems in any of the 5 dimensions (perfect health) and a value of 0 being equivalent to dead. Negative values are possible and represent health states considered worse than being dead. 5 A newer EQ-5D-5L version of the instrument has been developed 6 with identical health dimensions but extends the number of possible responses to each health dimension from 3 to 5. However, it was only very recently that Danish societal weights for the EQ-5D-5L were published, 9 and since this study is based on retrospective register data, we have used the EQ-5D-3L with associated Danish utilities. 10
Several studies have published nationally representative off-the-shelf catalogs to assist health economic evaluation when it is not feasible to obtain EQ-5D responses from a target population prospectively or to decrease the cost of collecting estimates of EQ-5D-3L utility scores for chronic diseases that can be used to calculate QALYs. Sullivan et al.11,12 published a US catalog including 157 self-reported conditions using national representative data pooled over the years 2000 to 2002. The same survey with the inclusion of 2003 data as an additional year was also used in 2011 by Sullivan et al. 13 to provide utility scores for the same 157 conditions using the UK EQ-5D-3L value set. 14 Saarni et al. 15 provided utility scores for 29 conditions for Finland in 2006, and Kang and Ko 16 estimated EQ-5D-3L utility scores using Korean tariffs for 27 major conditions in 2009. In 2019, a meta-review of 207 studies collected different EQ-5D-3L estimates among 15 ICD-10 disease groups. However, these were not derived from uniform sampling and methodology as in earlier studies. 17 In a Danish context, EQ-5D-3L utility scores of age, gender, and education have been created. 18 Yet, no Danish off-the-shelf catalog of utility scores of chronic conditions currently exists.
Furthermore, existing off-the-shelf catalogs have some limitations if they are to be used in a health care resource allocation context today. First, they are all based on the International Classification of Diseases, Ninth Revision (ICD-9), rather than the newer ICD-10 implemented in many countries. Second, they (largely) rely on self-reported health conditions, and the accuracy of this approach has been questioned.12,19–22 Third, behavioral risk factors (e.g., smoking, exercise, alcohol and fruit intake, body mass index [BMI], stress, and social networks) on the EQ-5D have been suggested as potentially necessary controls 23 but are missing from existing catalogs. Fourth, recognizing the biases induced by model misspecification when using linear regressions to estimate utilities bounded at 1,24,25 alternatives to linear regression models such as the Tobit model or the median-based censored least absolute deviation regression (CLAD) have been used. The latter is a robust alternative to the Tobit model in the presence of nonnormality of the error term. However, medians are generally of limited use in economic evaluation, 1 and the consistency of the CLAD estimator is based on the assumption that the conditional density of the error term is bounded away from zero. 26 Unfortunately, the well-known gap in the EQ-5D distribution between full health and the next feasible value implies that the conditional density function will be zero in some areas violating this assumption. Furthermore, even though these models were developed to deal with a large number of observations at the boundary value of 1, they are still unable to handle the remaining idiosyncrasies of the distribution of EQ-5D that are now well documented. Consequently, alternative models have been proposed,27–30 and new models such as the Adjusted Limited Dependent Variable Mixture Model (ALDVMM)31–33 used here have been developed.24,25,31–34 Finally, existing catalogs have been developed primarily to give population-based estimates of individual chronic diseases, which are often not the population of interest in economic evaluations. Therefore, a number of researchers have instead investigated methods to estimate utilities for comorbid diseases by combining estimates of utilities for individual chronic conditions in the populations of interest—multiplicative, additive, and minimum estimators are some common choices.35–38
This study aims to 1) create 2 off-the-shelf catalogs of Danish EQ-5D-3L preference-based scores for 199 ICD-10–based chronic conditions accounting for the limitations associated with previous catalogs and 2) provide 2 separate models to enable researchers to estimate utilities and utility decrements for any combination of chronic conditions in their population of interest. The first catalog provides nationally representative estimates of mean utilities for 199 chronic conditions, socioeconomic variables, and health risks. These are subpopulation estimates that do not adjust for differences in the composition of the groups. A second catalog provides regression-based estimates of utilities and marginal effects for the same chronic conditions, socioeconomic variables, and health risks, controlling for differences in the subgroup composition to allow for comparisons across chronic conditions for the same representative individual. To build this second catalog, 2 separate models of EQ-5D-3L with different sets of control variables are estimated. Furthermore, for these estimated models, a Stata .do file and a user guide are provided as online Supplemental Material to assist researchers in estimating EQ-5D-3L in their specific setting. In conjunction with another publication on the prevalence of the same 199 chronic conditions, 39 these estimates can provide valuable information for future resource allocation in Denmark.
Methods
Data Types and Linkage
Two types of data were used: national registers and survey data. Patient-level data on sociodemographics, diagnoses, and health care activity were found in 7 national registers. These were combined with 3 national health surveys containing self-reported data on HRQoL and health behaviors (e.g., lifestyle) with the help of the unique civil registration number that Danish citizens receive at birth. 40
Survey Data
Self-reported EQ-5D-3L responses and health behaviors have been collected from the nationally representative cross-sectional survey—the Danish National Health Survey (DNHS)—distributed either by post or electronically to a personal online mailbox to a large sample of Danish citizens. Each wave is collected every 3 or 4 y, and informed consent is given. The recipients and mailboxes are uniquely identified based on the civil registration number. These population surveys are conducted by the 5 regions responsible for health care in Denmark in collaboration with the National Institute of Public Health (NIPH). Full details of the DNHS can be found elsewhere. 41 The DNHS has a core questionnaire shared between regions related to health and health behaviors. However, some themes and question content variations are allowed across regions and over time in addition to the core questionnaire. Core questions at the time of this study included several measures of HRQoL, the Cohens Perceived Stress Scale, as well as 18 self-reported conditions, behavioral risk factors (smoking, exercise, alcohol, and fruit intake), BMI, and social networks. 41
This study pooled the DNHS data collected in 2 subsequent waves, 2010 and 2013. Six samples were collected: a regional sample for each of the 5 regions and a national sample collected by NIPH. The 6 samples were mutually exclusive random subsamples within the sampling year. Only 3 samples included EQ-5D-3L: the DNHS surveys from the North Denmark Region in 2010 and 2013 and the survey from the NIPH in 2010.41–44 Thus, these 3 samples were included in the current study with a total of 56,988 initial respondents (before handling missing values) and an overall response rate across the 3 samples of 60.2% of the population after removing a small proportion of duplicate responses (Table 1). Statistics Denmark provides sampling weights to account for both nonresponse and stratified design. These were standardized to fit the national average on gender, age, and educational levels for the raw estimates.41,45 To assess representativeness, all samples were compared with the national sample on gender proportions, average age, and proportions in 5 categories of education.
Respondent Characteristics of the 3 Samples Compared with the Full Population Register Data (Where Applicable) a

CI, confidence interval; n/a, not available; NDR, North Denmark Region; NIPH, National Institute for Public Health; SE, standard error.
All samples and full population data include residents age 16 to 100+ y. Unless stated otherwise, all estimates are complete cases only, and samples are weighted/standardized. Education is defined as the highest archived education level. Also, as self-reported educational status is used to impute missing values, we expect some small differences between the samples and the full population data as no self-reported data can be used for imputation of missings to the full population data.
Numbers after removal of duplicates respondents/included from 2010 samples.
Full population data were extracted from Statistics Denmark’s Research servers using population register data. 39
Nonweighted/standardized.
Valid responses are equivalent to the response rate including the removal of any invalid responses assessed by the Danish Regions or the NIPH.40–43
After removal of missing observations of the EQ-5D (complete cases).
Chronic Conditions and Registers
The applied chronic conditions stemmed from earlier work that defined 199 chronic conditions from information in national public registers,46,47 where a medical review team identified and grouped chronic conditions from ICD-10 codes based on the following definition of a chronic condition: “a condition that had lasted or was expected to last twelve or more months and resulted in functional limitations and/or the need for functional limitations and/or the need for ongoing medical care.”12,13,48
Each respondent from the DNHS was linked to 5 national registers by their unique 10-digit civil registration number, which allowed for a clear linkage between the register data, including the ICD-10 codes and the DNHS. The registers contained information from somatic 49 and psychiatric 50 hospital contacts (with ICD-10 codes), primary health care, 51 and prescribed medicines. 52 A total of 166 ICD-10–based chronic conditions were suggested to be captured by hospital discharge diagnosis alone. However, more complex definitions of 33 chronic conditions were proposed based on additional information from the other health registers (primary health care and medicine prescriptions), as ICD-10 hospital codes were not considered sufficient to identify these conditions as they are often treated in primary care. The content of all registers, methods used, linkage, and pros and cons are described in detail elsewhere.40,46,47
Sociodemographic Variables and Registers
Sociodemographic information on age, gender, ethnicity, and place of residence was also obtained from national registers. 53 To allow for income adjustments, the data were linked to the “Danish Registers on Personal Income and Transfer Payments.” 54 All employers in Denmark are required to report income data for each employee to a national register, thereby enabling individual-specific information on income, transfers, and tax payment for each Danish citizen. Finally, data on educational attainment were obtained from the Danish Population’s Education Register. 55
Missing values
The data include both self-reported and register-based variables. While most register covariates (e.g., all 199 chronic conditions, age, and gender) did not have any missing values, a few register-based covariates (“education,” “partnership,” “children living at home,” and “family equalized income”) had missing values. These were replaced by self-reported auxiliary information from the DNHS (e.g., respondents were asked about their education and others in the DNHS survey). The advantage of this approach is that we use a value confirmed by the respondent as an imputed value instead of a regression-estimated value. After using the available self-reported information, “education” and “children living at home” still had a small number of missing values (4%). Some self-reported variables (“social network/loneliness,” “stress,” “BMI,” “smoker,” “alcohol intake,” “exercise,” and “fruit intake”) were also found to have a small number of missing values. Missing covariates were included as separate categories of “missing” for each variable affected. Sensitivity analyses were performed using multiple imputations, and dropping the observations demonstrated no significant differences. After handling missing values for all the covariates, 2.4% of missing values of the dependent variable EQ-5D could not be replaced in the same way. These cases were excluded from the data. The final sample size for all models was 55,616 respondents (Table 1).
Statistical Analysis
Two separate analyses were implemented. First, mean EQ-5D-3L utilities for the 199 conditions, socioeconomic variables, and health risks were computed to provide a catalog of utility estimates reflecting the Danish population. These averages were adjusted using combined nonresponse and national standardized sampling weights and gave estimates of the mean EQ-5D-3L for those subpopulations.
Second, 2 separate models of EQ-5D-3L utility scores were estimated as a means to control for the sample composition and to allow comparisons across chronic conditions based on the same population. Utilities derived from generic preference-based measures, such as the EQ-5D, present specific characteristics that make statistical modelling challenging. The range of values they can take is bounded between the value of 1 (full health) and the minimum value, which differs by country and measure. The data distribution is often multimodal and tends to be highly skewed within each mode, presenting a large mass of observations at the boundary value of 1, followed by a gap to the next feasible utility value.32,33 The minimum value in the Danish EQ-5D-3L utility scores is −0.624, and the highest utility score below 1 is 0.838, leaving a large gap of 0.162 (10% of the EQ-5D-3L utility range) to full health. Although biases in the parameter estimates due to model misspecification have long been recognized, it is only relatively recently that statistical models have been developed to model these data. This is in contrast with the parallel literature modeling costs in economic evaluation, which shares some of the same issues, where it has been long recognized that linear regression models are not appropriate and alternative models have been proposed. 56
The ALDVMM was developed to model EQ-5D-3L UK utility scores and has been shown to perform better than models traditionally applied to EQ-5D (3L and 5L) and other generic preference-based model measures such as SF-6D and HUI.25,34,57,58 The model is based on mixtures of Tobit-like components and accounts for the bounded nature of the data, the mass of observations at 1, and the gap to the next feasible value, and it is capable of approximating skewness as well as multimodality. The flexibility of mixture models is increasingly recognized as useful in modeling health utility data. Dakin et al. 59 reported an increase in the use of mixture models in statistical models of EQ-5D in recent years.
An additional problematic feature due to the underlying assumptions of linear models, which has been overlooked in the literature but is crucial in this context, is that the expected decrease in EQ-5D due to developing a chronic condition, also known as disutility or marginal effect (ME), is the same for every individual regardless of, for instance, the presence or absence of other chronic diseases or age. This is a very restrictive and unrealistic assumption as it implies that the disutility of developing a chronic disease is assumed to be the same in a completely healthy population and in populations where several other comorbidities are often present. In the ALDVMM, the MEs are a function of all the other covariates included in the model, such as age, gender, and the presence of other chronic conditions. The implication is that the expected reduction in EQ-5D when developing a new chronic disease will differ for individuals with no previous chronic conditions and individuals with multimorbidity or populations with different age distributions. This is an advantage for economic modeling, as the decrease in utility can be tailored to the specific population of the trial, who typically tend to have a higher prevalence of multimorbidity and for whom the general population ME might not be appropriate.
Estimating mixture models is challenging, even more so for large models such as those estimated here. As the likelihood of the model is not globally concave, a thorough search procedure is needed to find the global maximum. In addition, the optimal number of components in the mixture also needs to be selected. This involves estimating models with an increasing number of components and using standard fit statistics and graphical methods to select the optimal model. 58 Note that a 1-component ALDVMM is a generalization of a Tobit model to include the gap below 1 typical of utility data. Further details of the model can be found elsewhere; here, we use the community-contributed Stata command published in the Stata Journal and available for free download within Stata.32,33
Two different specifications of the ALDVMM regression model were estimated as follows i :
Base model: In this model, EQ-5D-3L is a function of the 199 chronic conditions and controls for age, gender, and number of comorbidities. This model is useful for economic evaluations in which the additional controls included in the full model are not required or available.
Full model: As above but also includes a full set of controls for many socioeconomic variables and common health risks. The additional variables included in this model are education (no education/training, students or in training, short education, middle education, bachelor's equivalent, higher education such as master’s degree or above), ethnicity (Danish, Western or non-Western), family equalized income (in DKK), the status of partnership (partner or not), children living at home (yes/no), social network (often feeling lonely or not), stress (Cohens Perceived Stress Scale, 20% most stressed or not), BMI groups (<18.5, 18.5–25, >25 < 30, ≥30 < 35, ≥35), smoking daily (yes/no), alcohol intake excess national recommendations (yes/no), exercise and fruit intake as nationally recommended (yes/no), SF-12 self-reported general health 60 (1: excellent, 2: very good, 3: good, 4: fair, 5: poor; 999: missing), and self-reported long-term illness or disability (0: none, 1: yes). See Appendix 1 for model variable notations and detailed model specifications and Hernández and Wailoo 32 for details on how to fit the ALDVMM.
Quadratic terms for age and family-equalized income were included in all models. A dummy variable indicating North Denmark Region was used in the regression analysis to adjust for possible sample differences. The estimated regression models did not use weights but included controls for variables like those used in the weighting procedure. After the estimation of the models and to provide comparisons across chronic diseases, average MEs for each variable, in turn, were calculated based on representative 50-y-old males and females with no chronic conditions.
All initial data management of surveys and registers was conducted in SAS 9.4. All subsequent data analysis was done in STATA15. The online Supplemental Material provides documentation, relevant Stata user programs, and .ster files for analysts to predict MEs and utilities for any chronic diseases of interest. The parameter estimates and the variance-covariance matrices of the models are also provided to allow the use of probabilistic sensitivity analysis in economic evaluations. 61
Results
The samples have relatively high response rates and low missingness and were almost identical to the national population proportions and averages regarding gender, age, and educational levels (Table 1). Moreover, the 3 subsamples were equal in mean utility by gender and educational level. Altogether, the combined sample showed national representativeness on these key socioeconomic variables.
Danish Population-Based Estimates of EQ-5D-3L
Table 2 provides a Danish population catalog of EQ-5D-3L for individual chronic diseases, socioeconomic variables, and health risks. The table includes weighted sample utility estimates, percentiles, average age, and number of chronic conditions of the 199 chronic conditions, overall disease groups, socioeconomic variables, and health risks (catalog 1). ii The most prevalent disease groups were those in the circulatory system (group I; n = 16,990), respiratory system (group J; n = 14,087), musculoskeletal system (group M; n = 13,163), and endocrine, nutritional, and metabolic disorders (group E; n = 12,412).
Nationally Representative Sample EQ-5D-3L Mean Scores, Percentiles, n, Mean Number Chronic Conditions (NCC), and Percentiles for the 199+ Chronic Conditions, Socioeconomic Variables, and Health Risks a

ADHD, attention-deficit/hyperactivity disorder; AMI, acute myocardial infarction; BMI, body mass index; ICD-10, International Classification of Diseases, 10th Revision; n/a, not available; NDR, North Denmark Region. Bold entries represent overall disease groups.
N = 55,616 in all models. All NCC means and unadjusted EQ-5D estimates are weighted. Frequencies (n) are not weighted. Conditions marked with “A” are overlapping other conditions, usually due to complex register definition. For interest, see Hvidberg (2016, p 67–68) 40 for health-related quality-of-life (HRQoL) sample means of 17 common self-reported chronic conditions in comparison with the HRQoL of the above register-based chronic conditions.
Complex defined conditions.
The sample average EQ-5D score is 0.852. For the abovementioned prevalent disease groups, the mean EQ-5D scores are highest for J: score = 0.810, I: score = 0.783, and E: score = 0.783 but less for musculoskeletal diseases (group M: score = 0.755). The mean sample EQ-5D scores are lower for less prevalent groups of diseases such as genitourinary conditions (group N; score = 0.698), mental and behavioral disorders (group F: score = 0.703), benign neoplasm and diseases of the blood (group D: score = 0.744), diseases of the digestive system (group K: score = 0.744), and diseases of the nervous system (group G: score = 0.747).
There is a large variation in the mean EQ-5D scores within and across the 199 individual disease groups. Diseases with the lowest mean EQ-5D score are systemic sclerosis (M34: score = 0.432), fibromyalgia (M797: score = 0.490), unspecified rheumatism (M790: score = 0.515), dementia (F00, G30, F01, F02.0, F03.9, G31.8B, G31.8E, G31.9, G31.0B: score = 0.546), posttraumatic stress syndrome (F431: score = 0.557), systemic atrophies primarily affecting the central nervous system (G10-G14, G30-G32: score = 0.583), cerebral palsy (G80-G83: score = 0.6), and phobic anxiety disorders (F40: score = 0.611).
Furthermore, the sample mean of EQ-5D-3L estimates decline as the number of comorbidities increases, declines with lower educational levels except for students, and is lower for immigrants and people without children. Across lifestyle factors, mean EQ-5D-3L scores are also lower for people indicating loneliness and perceived stress, those with large BMIs, daily smokers, those who exercise the least, and individuals with a large alcohol intake and lowest fruit intake. Men and women, as well as people with or without a partner, exhibit similar EQ-5D-3L scores.
Model-Based Estimates of EQ-5D-3L and Disutilities
Figure 1 plots the distribution of EQ-5D-3L utilities in the sample. It shows the typical features of EQ-5D-3L, which linear regression models cannot capture: bounded utilities, a large mass of observations at 1, a large gap to the utility value immediately before 1, 2 modes, and a large degree of skewness within each of the modes.

Histogram of the EQ-5D-3L DK, National Health Profiles 2010/2013. N = 55,616.
Models with 2 components were selected. Searches for 3-component models did not yield any improvement in fit over the 2-component models, and a large proportion of the 3-component models did not converge, indicating that models with 3 components for this large number of covariates were weakly identified. Table 3 presents measures of fit for 1- and 2-component ALDVMMs for the base and full models. The reductions in Akaike information criterion (AIC) and Bayesian information criterion (BIC) are very large in both the base and full models when moving from 1 to 2 components, confirming that the 2-component models are a better fit for the data. The mean absolute error (MAE) and the root mean squared error (RMSE) also favor the 2-component models. Figure 2 compares the cumulative distribution of the EQ-5D-3L utility data with that implied by the estimated models showing that the estimated 2-component models reproduce the characteristics of the data quite well and better than the 1-component models do and that the full model specification shows a better fit in terms of AIC, BIC, MAE, and RMSE. This highlights the importance of the additional variables overall, although the improvement is not so pronounced when looking at the cumulative percentage plots in Figure 2. iii
Summary Measures of Fit for the Base and Full Adjusted Limited Dependent Variable Mixture Models
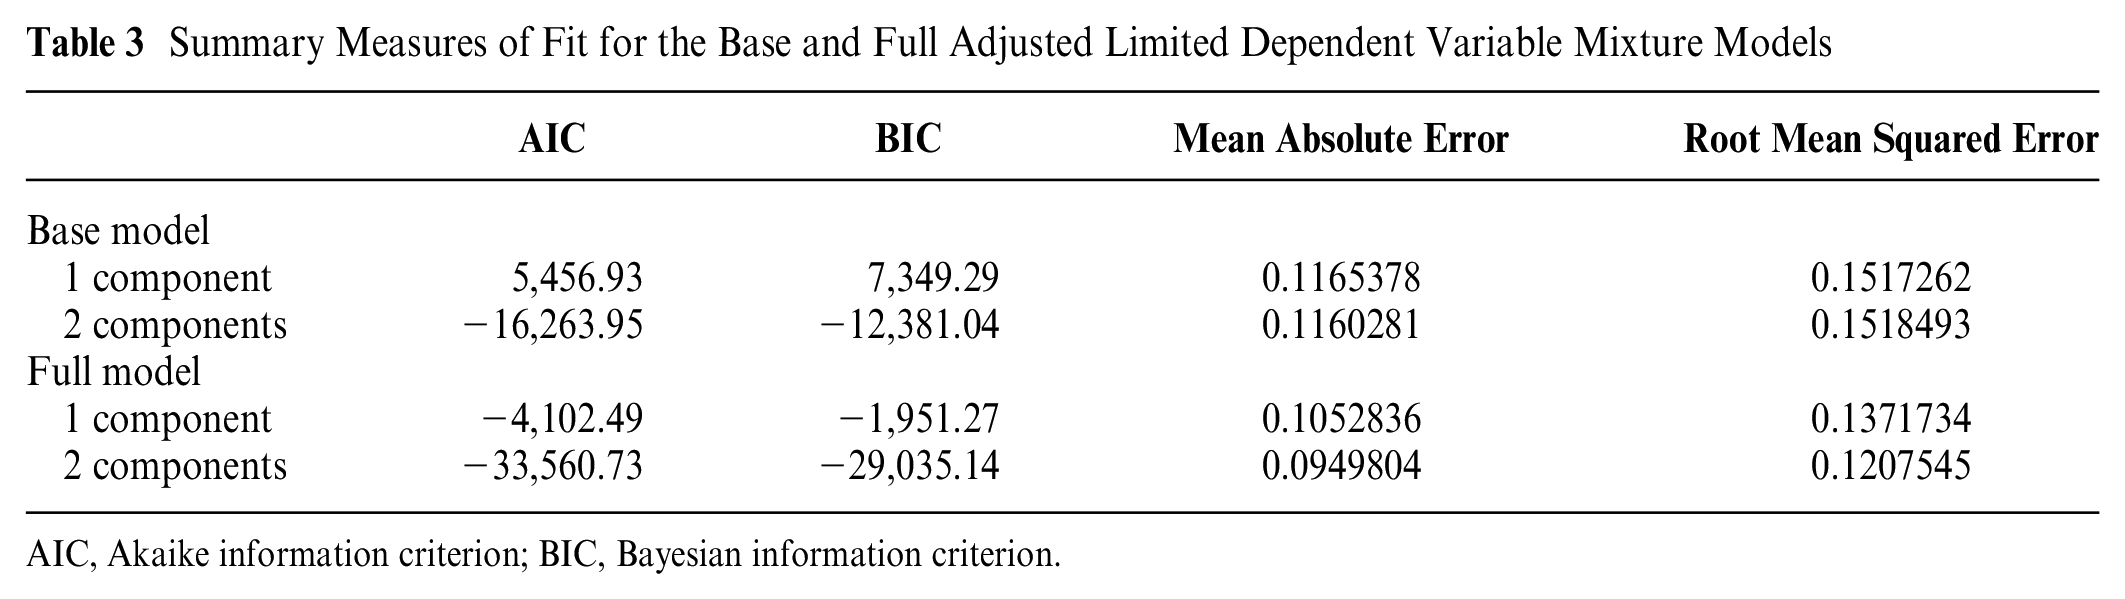
AIC, Akaike information criterion; BIC, Bayesian information criterion.

Cumulative percentage plots.
Tables 4 and 5 iv (catalog 2) present the MEs or disutilities for the 199 chronic conditions calculated based on the base and full regression models for representative 50-y-old men and women with no chronic disease. These regression-based estimates calculated for representative individuals allow us to compare directly across chronic diseases by adjusting for the additional effects that may arise due to the difference in sample composition across chronic conditions presented in Table 1. v For the full model, the conditions are followed by the MEs of the socioeconomic variables and health risks, including stress and loneliness, in Table 5. Diseases from groups M, G, and F have the largest estimated marginal disutility. Fibromyalgia (M797), cerebral palsy (G80-G83), sclerosis (G35), other dorsopathies (M53), depression (F32, F33, F34.1, F06.32), dementia (F01, etc.), posttraumatic stress disorder (F431), systemic atrophies (G10-G14, G30-G32), dorsalgia (M54), and rheumatism, unspecified (M790) are some important examples.
EQ-5D-3L Regression Marginal Effects (MEs) for the 199 Chronic Conditions for the Base and Full Models: Example of MEs Based on a Representative 50-y-Old a

ADHD, attention-deficit/hyperactivity disorder; ALDVMM, adjusted limited dependent mixture model; AMI, acute myocardial infarction; ICD-10, International Classification of Diseases, 10th revision; n/a, not available; SE, Standard Error. Conditions marked with “A” are overlapping other conditions, usually due to complex register definition.
N = 55,616 in all models. Other types of MEs can be predicted using the provided Stata .Ster files in the Supplemental Material 2.
Complex defined conditions.
EQ-5D-3L Regression Marginal Effects (MEs) for the Socioeconomic Variables and Health Risks of the Base and Full Model: Example of MEs Based on a Representative 50-y-Old a

ALDVMM, Adjusted Limited Dependent Mixture Model; ICD-10, International Classification of Diseases, 10th Revision, n/a, not available; SE, Standard Error.
N = 55,616 in all models.
The marginal effects are calculated at each age point illustrated in the table maintaining the rest of the representative individual characteristics. They represent the expected change in EQ-5D-3L for individuals of the specified age as age increases. For example, for a 40-y-old, EQ-5D-3L is expected to decrease by 0.0003 after 1 y, whereas the expected decrease after 1 y for a 60-y-old would be 0.0007.
Focusing on the full model (model including socioeconomic variables, lifestyle, and health risks), it is evident that lifestyle and health risk factors are substantially associated with EQ-5D-3L based HRQoL (Table 5). Particularly, perceived stress has a relatively sizeable marginal disutility, followed by loneliness. A large ME is also found for individuals with BMIs greater than 35 kg/m2, people not exercising, other Western immigrants, participants with 4 or more comorbidities, high alcohol intake, and current smokers.
How to Use the Estimates
We have presented unadjusted and adjusted regression utility estimates. The unadjusted estimates (catalog 1) can be used when interest lies in general population estimates. Adjusted regression estimates (catalog 2) can be used when predictions need to be made in samples that are very different from the general population sample used in the estimation. This will typically be the case when using them to evaluate interventions in which the population is not as healthy as the general population or has a different age and gender distribution.
Below, we provide simplified hypothetical examples for illustration to show how analysts can use the adjusted regression utility estimates (Stata code to reproduce the calculations is included in the online Supplemental Material 2): Assume that we need to calculate EQ-5D scores for a population subgroup with type 2 diabetes who also suffer from hypertension. We also expect they will develop heart failure after 3 y. For this example, we simulate 1,000 patients’ age (a normal distribution with a mean of 45 and standard deviation of 5) and gender (0.75 proportion of females), although analysts should use the age and gender distribution of their population of interest. Table 6 presents the average EQ-5D-3L prediction at baseline and 5 subsequent years (the time horizon and frequency would depend on the analysis). If the analyst has no information about other comorbidities, some reasonable assumptions based on the data need to be made. The average utilities can be easily calculated under the assumption of no other comorbidities (see Table 6, column 1), but if the population of type 2 diabetes tends to also have other comorbidities, then the utility estimates presented in column 1 would be too high. Table 2 shows that the average number of comorbidities in the type 2 diabetes group is 5.8, confirming that the utilities reported in column 1 are unlikely to be representative of this group. Furthermore, the mean utility for the Danish type 2 diabetes group is reported in that same table at 0.752, which is much lower than the 0.870 mean utility calculated for our sample with no additional comorbidities. Table S5 in the Supplementary Material of Hvidberg et al. 66 provides the prevalence of other chronic conditions within each of the 199 chronic diseases, which can be used to select the comorbidities that are most likely to be seen in the population of type 2 diabetes. We find that disturbances in lipoprotein circulation and other lipids, respiratory allergy, and depression are quite prevalent among the population with type 2 diabetes (71.6%, 24.7%, and 17.3%, respectively). Thus, analysts could use this information to construct predictions for more representative populations and use them for sensitivity analyses.
Predicting EQ-5D-3L for a Hypothetical Example

Additional comorbidities are disturbances in lipoprotein circulation and other lipids, respiratory allergy, and depression.
We give a simple alternative example in column 3 of Table 6. We assume that those 3 chronic conditions are present in all individuals in the sample. Using the provided example Stata .do file in Supplemental Material 2, the model predicts an average EQ-5D-3L of 0.922 for the sample with no chronic conditions and this age and sex distribution. The mean predicted EQ-5D-3L scores at baseline for the sample with type 2 diabetes and hypertension decreases from 0.870 to 0.769 when we assume 3 additional comorbidities. One year later, as the age of the sample increases, the average expected EQ-5D-3L decreases to 0.869 and 0.769 for the no and 3 additional comorbidities, respectively. Three years after baseline, the combined effect of heart failure and the increase in age reduces average predicted EQ-5D-3L to 0.834 and 0.731. These average predicted EQ-5D-3L values would then be discounted and used to construct QALYs. For a more detailed, technical guide on how to use the regression estimates, see the full guide and documentation in online Supplementary Material 2.
Discussion
This catalog presents a comprehensive list of EQ-5D-3L scores for 199 chronic conditions and health risks based on Danish preference weights and a national representative sample of 55,616 respondents. The results revealed that EQ-5D-3L scores, on average, are lowest for genitourinary disease, mental and behavioral disorders, benign neoplasm and diseases of the blood, diseases in the digestive system, and the nervous system, while they are higher for the more prevalent diseases. However, there was considerable variation within and between groups. Lifestyle and health risks strongly correlate with EQ-5D-3L scores by their large, significant estimates of marginal disutility. Particularly, perceived stress, loneliness, and high BMIs were important.
This study has some limitations. First, the EQ-5D might be less sensitive to milder diseases,12,67–70 a case that can be exacerbated by applying the EQ-5D-3L version instead of the EQ-5D-5L that has been developed after this study began. Second, a few estimates of disutility had positive values. There were 14 chronic conditions in the base model with small disutility values above zero for a representative 50-y-old male/female. Nevertheless, 13 of those 14 were not statistically significant, and only hemolytic anemias (D55-D59) were significant at a 10% significance level. The same pattern can be seen in the full model, although the number of positive and insignificant coefficients increases with the additional control variables. This is most likely the effect of the correlation patterns between socioeconomic variables and chronic diseases. Thus, all conditions, including those associated with positive values, were kept in the models given their small number and statistical insignificance, as their exclusion could unintendedly suppress combined effects. EQ-5D-3L sensitivity limitations could also explain positive values, or, underlined, some conditions might be truly less severe and not have a large effect on HRQoL in general.
Third, some register-based definitions might be less sensitive to less severe conditions, as the doctor reported that ICD-10 discharge codes are based on hospital-treated patients and, thus, more severely ill patients.
Fourth, we cannot exclude that the timing of the survey affects the burden of some of the respondents’ conditions, which could mean that the EQ-5D-3L score is either over- or underreported. The survey was conducted in the early spring, and, for example, respiratory allergies are mostly present during the summer. Similarly, some of the chronic conditions included could have been treated after respondents had completed surveys (e.g., some eye conditions, hernias, ulcers, and limbs can be partially or fully cured).
Fifth, although no exact gold standard exists for the sample size of individual conditions, 18 of nearly 200 conditions had frequencies with less than 50 respondents and should be interpreted cautiously. However, some diseases in nature are rare, and the number of observations will be relatively small in a general population data set. The only way to increase the number of observations would be to oversample that specific population and then arbitrarily combine utility estimates for individual chronic conditions calculated in different samples, an issue that we are trying to avoid.
Sixth, since our design is cross-sectional, we can make only weak assumptions regarding causality; therefore, the main focus is to describe associations between EQ-5D scores and covariates.
Seventh, although the possibility of measurement error in the covariates still exists, it has been minimized as far as possible because we do not rely on self-reports but use conditions reported by physicians.
Finally, the models include a large number of conditioning variables that can be used to predict a variety of subgroups. The downside of this is that the analyst might not have all the covariates available for prediction. In this case, reasonable assumptions about those variables could be made and the sensitivity of the results to those assumptions checked. We consider this a more transparent practice than assuming that the distribution of those covariates is the same in the general population and the trial population in which the predictions are to be made.
Regarding strengths, the current catalog of EQ-5D-3L preference scores differs from existing catalogs in several ways. First, it is the first ICD-10–based catalog and the first using conditions reported by physicians. Second, the study is based on a larger sample size and includes more conditions than existing catalogues. Third, the study also uses a regression model designed to deal appropriately with the distribution of the EQ-5D-3L. The ALDVMM model allows the average MEs to be a function of other included covariates (e.g., other comorbidities, age, and gender distribution). This feature is useful when predicting outside the population sample in which the model is estimated and to estimate the effect of combinations of comorbidities appropriately considering nonlinearities and interactions, without the need to combine separate estimates based on controversial methodology, as commonly done previously.35–38 Finally, it includes 2 separate regression models: a base model, which controls for the age and gender distribution in the sample, which is useful for economic evaluations in which additional variables are not required, and a full model, which includes additional important controls.
Future research could investigate the potential of including different clinical severity levels of the conditions, for instance, in COPD or other conditions with well-described clinical severity levels. This would allow the calculation of EQ-5D scores of potential health gains for clinically defined mild health states. Moreover, even though there is no final agreement on defining and handling multimorbidity,71–74 the importance is well documented.35,66,63,75 Hence, common clusters of conditions, such as COPD and heart failure, could generate unique interaction effects, which is why research to identify such conditions is important. Likewise, interactions between conditions, socioeconomic factors, social factors, and health risks in a health equality view could be investigated further using the current catalog and, for example, using related research on the patterns of multimorbidity 66 and socioeconomic inequalities 62 of the 199 chronic conditions. This could help identify further complex, real-world, critical factors for treating individual conditions and improving the HRQoL of patients with chronic conditions.
Supplemental Material
sj-pdf-1-mpp-10.1177_23814683231159023 – Supplemental material for Catalog of EQ-5D-3L Health-Related Quality-of-Life Scores for 199 Chronic Conditions and Health Risks in Denmark
Supplemental material, sj-pdf-1-mpp-10.1177_23814683231159023 for Catalog of EQ-5D-3L Health-Related Quality-of-Life Scores for 199 Chronic Conditions and Health Risks in Denmark by Michael Falk Hvidberg, Karin Dam Petersen, Michael Davidsen, Flemming Witt Udsen, Anne Frølich, Lars Ehlers and Mónica Hernández Alava in MDM Policy & Practice
Supplemental Material
sj-zip-2-mpp-10.1177_23814683231159023 – Supplemental material for Catalog of EQ-5D-3L Health-Related Quality-of-Life Scores for 199 Chronic Conditions and Health Risks in Denmark
Supplemental material, sj-zip-2-mpp-10.1177_23814683231159023 for Catalog of EQ-5D-3L Health-Related Quality-of-Life Scores for 199 Chronic Conditions and Health Risks in Denmark by Michael Falk Hvidberg, Karin Dam Petersen, Michael Davidsen, Flemming Witt Udsen, Anne Frølich, Lars Ehlers and Mónica Hernández Alava in MDM Policy & Practice
Supplemental Material
sj-zip-3-mpp-10.1177_23814683231159023 – Supplemental material for Catalog of EQ-5D-3L Health-Related Quality-of-Life Scores for 199 Chronic Conditions and Health Risks in Denmark
Supplemental material, sj-zip-3-mpp-10.1177_23814683231159023 for Catalog of EQ-5D-3L Health-Related Quality-of-Life Scores for 199 Chronic Conditions and Health Risks in Denmark by Michael Falk Hvidberg, Karin Dam Petersen, Michael Davidsen, Flemming Witt Udsen, Anne Frølich, Lars Ehlers and Mónica Hernández Alava in MDM Policy & Practice
Footnotes
Acknowledgements
We sincerely appreciate and thank the reviewers and editor for their valuable comments and suggestions in reviewing the work, which has significantly improved the quality of the article. The authors also thank specialists Ole Schou Rasmussen and Thomas Mulvad Larsen from the North Denmark Region, Denmark, for constructive suggestions and assistance with the comprehensive SAS programming for the chronic conditions.
The authors declared no potential conflicts of interest with respect to the research, authorship, and/or publication of this article. The authors disclosed receipt of the following financial support for the research, authorship, and/or publication of this article: Financial support for this study was provided in part by grants from The Danish Tax Foundation, The North Denmark Region, and Novo Nordisk Denmark A/S. MHA’s time on this study was partly supported by the Medical Research Council (grant no. MR/L022575/1). The funding agreement ensured the authors’ independence in designing the study, interpreting the data, writing, and publishing the report.
Data Availability Statement
All data are kept on a secure server at Statistics Denmark, and due to legal requirements, the micro data underlying the present study cannot be made freely available. However, the estimated regression models are made freely available for analysts through Stata .do and .ster files. This will enable others not only to reproduce the results of the current study on legal aggregated level but also to predict EQ-5D-3L for any combination of health conditions
Supplemental Material
Notes
References
Supplementary Material
Please find the following supplemental material available below.
For Open Access articles published under a Creative Commons License, all supplemental material carries the same license as the article it is associated with.
For non-Open Access articles published, all supplemental material carries a non-exclusive license, and permission requests for re-use of supplemental material or any part of supplemental material shall be sent directly to the copyright owner as specified in the copyright notice associated with the article.