
Abstract
Highlights
We created a hybrid model combining a genetic algorithm and discrete event simulation to search for the optimal configuration of health care service capacity that maximizes patient outcomes subject to finite health system resources.
We applied a probability distribution fitting process to standardize real-world data to probability distributions. The process consists of choosing the distribution type and estimating the parameters of that distribution that best reflects the data. Standardizing real-word data to a best-fitted distribution can increase model generalizability.
In an illustrative study of stroke rehabilitation care, resource allocation to stroke rehabilitation services under an optimal configuration allows provision of care to more stroke survivors who need services while reducing wait time.
Resources needed to expand rehabilitation services could be reallocated from the savings due to reduced wait time in acute care units. In general, the predicted optimal configuration of stroke rehabilitation services is associated with a net cost savings to the health care system.
This is a visual representation of the abstract.
Keywords
Improvements in stroke prevention and treatment strategies have led to a decrease in stroke-related mortality in recent decades.1,2 While improvements in stroke survival are to be welcomed, there are knock-on effects that health systems must address to ensure surviving patients receive adequate care. With the increasing number of stroke survivors now living at home or in supportive living communities comes an increase in years lived with disability1,3 and the corresponding demand on poststroke care. 4 Stroke is currently the second leading contributing condition to disability-adjusted life-years globally. 2 Projected population growth and a demographic transition to an aging population will only exacerbate stroke’s relative impact on the population and pressure on health systems to meet the need.
The rehabilitation care for stroke survivors typically includes 1 or more of the following: inpatient rehabilitation (IPR), early supported discharge (ESD), and outpatient rehabilitation (OPR). IPR is typically used for patients with moderate functional deficits following stroke. IPR typically involves 2 to 4 h of daily therapy (physical therapy, occupational therapy, speech language therapy). The inpatient duration of IPR varies substantially around the world. In Alberta, an interdisciplinary in-hospital rehabilitation program lasts approximately 6 to 8 wk. ESD is a program targeted at individuals with mild stroke as defined by the Functional Independence Measure (FIM)/alpha FIM with ongoing deficits. Patients participating in ESD must have appropriate home supports (often, a spouse/family member who can support/supervise) as ESD involves interdisciplinary rehabilitation 1 to 3 h per day within the home for a time-limited period (often 4–8 wk) after a stroke. OPR is an outpatient program in which patients attend a rehabilitation facility a few (2–3) days per week for 1 to 2 h to receive therapy. Patients may attend this program after an acute hospital admission if they have a very mild stroke or after completion of an IPR or ESD program.
The increasing need for poststroke care has created challenges for health care planners. There is a need to develop and manage proper stroke care delivery models that improve patient outcomes, within the resource constraints faced by decision makers. While the evidence supports the clinical effectiveness of multidisciplinary stroke rehabilitation care in abridging stroke-related disability,5–8 there are barriers to providing satisfactory stroke rehabilitation.9,10 One of the most pertinent barriers is the optimal alignment between the provisions of acute care and stroke rehabilitation as well as among segments of rehabilitation care including IPR, ESD, and OPR. Poor alignment can further stress already scarce health resources. An obvious example is how the shortage of rehabilitation services often results in delays in discharge causing longer-duration stays and occupation of hospital beds. In addition, limited out-of-hospital rehabilitation services may mean that some patients who have been discharged may be unable to access appropriate care.11,12
Coping with these challenges requires health care resource reallocation facilitated through informed decision making. While many health jurisdictions and evidence-based guidelines give best practices in the provision of satisfactory stroke care,13–18 an appropriate analytic model is needed to determine an optimal resource allocation. In this study, we develop a stroke rehabilitation optimal model (sROM), integrating a genetic search algorithm (GA) with a discrete event simulation (DES) approach to identify stroke rehabilitation services configurations that maximize patient outcomes subject to finite resources in a publicly funded health system. The optimal problem is solved with GA and DES works as a tool to determine patient flow across the rehabilitation care segments and to evaluate the performance of the configuration determined by GA.
Our model was motivated by a need for service delivery reform of stroke rehabilitation in a single Canadian province where we benefit from a publicly funded health system, a structured stroke system of 17 hospitals around the province, and a vertically integrated strategic clinical network. This reform needs to better understand access, efficiency, and flow to rehabilitation programs across the province. We needed to ascertain what is currently available to stroke survivors and where the gaps in services are in relation to the Canadian Stroke Best Practice Recommendations. 14 The service gaps will cause an upstream effect, with patients waiting longer in costly acute care beds, where they cannot receive intensive stroke rehabilitation. There is a need to explore the optimal balance between new investments and current practice for IPR, ESD, and OPR to inform and support operational decisions. Our analysis offers a health economic rationale for the policy requirement.
Although DES modeling has been extensively used to support integrative planning for stroke care services19–22 and other health care sectors, 23 to our knowledge, there are limited publications regarding the use of hybridizing simulation and optimization processes to search for an optimal resource allocation in stroke care. A similar example was the outpatient clinic layout problem in which the authors proposed a hybrid framework for the large-scale clinic layout problem by applying particle swarm optimization, a metaheuristic algorithm, and simulation. 24 In the manufacturing setting, a study applied the combination of GA and simulation to the optimal problem. 25
We developed sROM to address health policy concerns of adding system value through informed, appropriate allocation of care delivery and considering the tradeoff between patient outcomes and costs. The model simulates the trajectory of care for poststroke patients distributed across all available modes of rehabilitation service and identifies the optimal rehabilitation configuration to maximize patient benefits subject to finite health system resources. In this regard, the optimal solution minimizes the wait times for rehabilitation care and the tradeoff between patient outcomes and additional health system costs.
Methods
Analytic Approach
Patient flow
The patient flow across care segments is presented in Figure 1. We used administrative data to identify patients who had experienced an acute stroke based on Heart and Stroke Foundation of Canada recommendations. 26 We describe the patient flow as below. Starting from the time of admission to acute stroke care, the figure indicates the flow of the resulting cohort of stroke survivors through rehabilitation care. Dependent upon disease severity, the stroke survivors receive a prescription of IPR, ESD, or OPR at discharge from acute care. In this mode, rehabilitation accessibility depends on the availability of the care. If care is available, patients have immediate access to the prescribed rehabilitation care; otherwise, they are put on a wait list, during which the health system incurs costs according to their current place and intensity of care. All patients completing rehabilitation care end up at home and have a likelihood of being readmitted to acute stroke care or rehabilitation care.

Flow chart of patients through rehabilitation care. assess:, assessment; dest, destination; ESD, early supported discharge; IPR, inpatient rehabilitation; OPR, outpatient rehabilitation; rehab, rehabilitation. Patients who survive their stroke are discharged from acute care to either IPR, ESD, or OPR, or to home without rehabilitation care, according to disease severity. After the end of IPR or ESD, they could receive OPR prescription or are discharge to home.
Objective and decision variables
The sROM in nature is an unconstraint optimization problem. We developed the model that combined a GA with a DES to identify an optimal capacity of rehabilitation care for patients who received each care type alone or in combination. The decision variables of the model are the capacities of each type of service (IPR is defined as the number of beds; both ESD and OPR are defined as patients per day). With optimal capacity, the model will achieve its objective that minimizes the wait time for IPR, ESD, and OPR. Note that we did not add a constraint (e.g., a budget constraint) to the optimization problem, as the model is intended to assess the implications of optimal configuration in health care delivery and the cost transfer among acute care and rehabilitation segments without a constraint. Given that the intention of the analysis is to search for an optimal capacity that maximize patients’ access to rehabilitation care, the model objective is the minimum wait time. The cost savings realized from the model arise out of reduced length of stay (LOS) in expensive acute care units.
Optimization process and model computation
The DES acts as an objective function that maps the capacity and control variables (e.g., probabilities of transitioning from one care type to another) to wait time being minimized. It was constructed to assess individual patients receiving IPR, ESD, and/or OPR and the associated wait time and health resources used. The DES is a stochastic computer simulation that imitates real-world patient flow in the therapeutic process from acute stroke care to IPR, ESD, and/or OPR.27,28 This type of simulation provides a broad capacity to follow individual patients in a particular time frame (in this analysis, 1 y). DES makes it possible to estimate wait times for stroke rehabilitation care, LOS (for IPR) or therapeutic duration (for ESD and OPR), and the associated cost for each patient entering the rehabilitation care system. Clinically, doctors use the severity of stroke to make decisions about who should go where in the system (i.e., IPR v. ESD v. OPR). The DES imitates the clinical decisions by applying data from clinical studies to determine the transition probabilities.
The DES was designed and implemented following recommendations of ISPOR-SMDM best practices. 27 The process flow required by DES was patient flow through rehabilitation segments (Figure 1). We created subtrajectory modules for each segment of IPR, ESD, and OPR that may facilitate model transparency. Key model input parameters such as interarrival time; therapeutic times staying in IPR, ESD, or OPR; and likelihood to each segment were collected from medical records and the literature, as described in the “Model Inputs” section below. The running time of the model is 365 d, with 200 replications. This running time period is consistent with the yearly basis under which the medical data were recorded and the model results are reported. The health system under simulation has been running for years, and this is the case that often requires the model to run some time to stabilize the simulation process, known as the warm-up period. We applied an alternative way that preloads the entities with their existing characteristics and event history. We applied the preloading approach as it is appropriate for empirical data-based input parameters. 27
The GA is an evolutionary search algorithm. 29 Designed in the 1970s, the algorithm has been applied to solve a wide range of complex optimization problems in engineering and health system planning.30–35 As a computational method, GA is a subset of machine learning and is a heuristic process, identifying the top-ranked combinations to produce “offspring,” that is, a subset of capacity combinations, for the next iteration. Each iteration will generate a capacity combination “better” than the preceding one.
Figure 2 illustrates the optimization, a double-loop simulation process. It initiates from the inner loop by inputting parameters into DES based on assigned distributions, such as the number of patients admitted to acute stroke care, LOS, and therapeutic duration at each type of care. The DES is conducted, with each model run using values drawn from the distributions that define each parameter. In the next step (i.e., outer loop), the GA arbitrates outcomes from the DES; if the outcomes meet specified stopping criteria (defined here as a wait time of less than 1 d across all 3 care types), the GA search process stops; otherwise, GA simultaneously updates the capacities of IPR, ESD, and OPR and sends them to DES to run the next iteration. Note that there could be infinite combinations of capacity in theory that minimize the wait time. We set GA to generate the lowest capacity that achieves targeted wait time.

Implementation chart of the optimization process. DES, discrete event simulation; ESD, early supported discharge; IPR, inpatient rehabilitation; LOS, length of stay; OPR, outpatient rehabilitation.
Features of sROM
Note that the DES models a realistic health system in which there is limited space and resources in each of the segments of rehabilitation care, meaning a change in the capacity of any one segment influences the surplus capacity and therefore wait times of the other segments. This nature of mutual effect requires a simultaneous update of the capacity for all 3 care segments in each iteration; in other words, the model must search for a combination of capacity values that would minimize the wait time of all 3 care types. The search for such a combination, along with the time-consuming DES, requires significant computing resources. GA speeds up the search process and provides powerful capacity for this type of optimization problem. 36
We collected real-world data from medical administrative records and fit the data to probability distributions. This process generates fitted distributions of demand parameters including the time to the patient’s arrival at the acute care site and LOS. Patient factors, such as stroke severity, which affect clinical judgment on the discharge destination and rehabilitation type could not be obtained from the administrative data. We therefore conducted a meta-analysis to determine the likelihood for stroke survivors in acute care units being discharged to each rehabilitation segment. This information along with the fitted probability distributions forms the basis of the demand estimates.
The logic basis behind the model is that the optimal configuration of rehabilitation care should be determined by the supply and demand for the type of rehabilitation care to achieve a targeted wait time. The analysis starts from assessing the determinants of how the demand is formed and then builds up to the relation between demand determinants and capacity. The demand for IPR, ESD, and OPR is determined by patients’ characteristics such as disease severity at discharge from acute care, along with the duration of time they stay in each segment of rehabilitation care. The main demand determinants include the number of patients with stroke, the likelihood of their flow across each segment of rehabilitation care, and the duration of time they stay in each type of care. In this sense, the model produces an optimal configuration of rehabilitation supply and predicted the number of patients who can receive the care under the optimal capacity.
Model Validation
We developed the model following the best practice recommendations by ISPOR-SMDM. 27 Although the model is relatively complicated and difficult to validate comprehensively, we conducted the model validation on some aspects of AdViSHE criteria for validation of health economic decision models. 37 An expert panel consisting of experts in stroke rehabilitation, health service planning, health economics, and health administrative data provided consultations during and after the model development. Interactive discussions were held with the panel who guided the model development and evaluated the model in relation to conceptual design, assumption, model construction, and input data validation. In addition to the evaluation, the panel reviewed the model outcomes and assessed whether the outcomes are comparable with real-world practices and the panel’s experiences. The process of simulation and optimal search was evaluated by a senior health economist at the authors’ institute.
Model Assumptions
The model was developed with the following assumptions:
Stroke survivors discharged from acute stroke care units and the LOS/therapeutic durations of IPR, ESD, and/or OPR are the primary determinants of demand for rehabilitation care.
The flow of stroke survivors across IPR, ESD, OPR, or resident home without rehabilitation is judged by clinical professionals based on medical need and expected benefit from that type of care, with the eligibility for the care type governed by clinical evidence. This assumption rules out the influence of capacity constraints on clinical judgement.
There is no capacity limitation for acute stroke care; that is, all stroke patients entering the rehabilitation model received full care leading up to model entry at discharge.
Patients who have no access to rehabilitation care at the time of prescription wait in queues, as the model considers capacity limitation explicitly for each segment of rehabilitation care.
Patients on the wait list for IPR and ESD as well as some on the wait list for OPR wait for rehabilitation care in acute stroke care and therefore consume acute care resources while waiting for transfer.
Model Inputs
Data sources
The analysis investigated data from the Discharge Abstract Database (DAD) and the National Rehabilitation Reporting System (NRS) for patients admitted to acute stroke care and IPR for the four fiscal years between April 1, 2014, and March 31, 2018, to obtain estimates of the demand determinants. The NRS records the medical information for patients receiving IPR, and the DAD provides information on patients admitted to acute stroke inpatient stay. Provincial medical records were used to estimate the supply of services of ESD and OPR. Model inputs were estimated from the described databases and are presented in Table 1.
Model Inputs Derived from Databases

ESD, early supported discharge; FY, fiscal year; IPR, inpatient rehabilitation; LOS, length of stay; NRS, National Rehabilitation Reporting System; OPR, outpatient rehabilitation; s, standard deviation;
These are numbers of patients from whom the statistics were calculated.
Alberta models: estimated from databases; Canadian guidelines:
Cost assumptions are based on a 2015 Calgary model and adjusted to 2019 prices.
The Alberta IPR LOS is from NRS (see above), and there was not an explicit recommendation for IPR LOS in the Canadian guidelines; the analysis used the IPR LOS from NRS. The cost is per patient-day.
IPR therapist cost is per day, at 60 min each day. This cost was calculated to include direct therapy and associated support services.
The Canadian guidelines suggested 2 to 5 d/wk for 4 to 5 wk (1); the analysis used 4 d for 5 wk, for a total of 20 visits. The cost is per visit, and an ESD visit included 30 min of driving time.
The Canadian guidelines suggested 2 to 5 d/wk for 8 to 12 wk. The analysis used 5 d for 10 wks, for a total of 50 visits. The cost is per visit, and an OPR or community care visit included 60 min of therapeutic time each visit.
Costs
Cost items considered in the model were of the stroke acute care hospital stay and the rehabilitation case of IPR, ESD, and OPR. The costs of IPR, ESD, and OPR as well as the associated LOS or therapeutic duration (that is, the number of appointment-days a patient uses OPR/ESD services) were collected from an internal financial analysis and from the Canadian guidelines. 14 The cost of acute care was based data from DAD. All costs were converted to 2019 Canadian dollars using the Consumer Price Index.
Study population and patient flow across rehabilitation care types
The study population consists of patients with acute stroke in the province of Alberta between fiscal years 2014/15 and 2017/18. We identified stroke patients using the approach recommended by the Heart and Stroke Foundation of Canada. 38 Patients were excluded if there were invalid admission or discharge dates. Patients who died in acute stroke care and those discharged to a long-term care facility from acute care were also not included in the analysis.
The probabilities describing the flow of stroke survivors across the types of rehabilitation care were estimated using data from administrative data sources and literature. We conducted a meta-analysis and generated pooled data for the proportions of the survivors who required IPR, ESD, or OPR at discharge from acute stroke care. Estimates using data from DAD and NRS indicated that, over the fiscal years between 2014/15 and 2017/18, there were 18,832 patients with stroke admitted to acute stroke care; 3211 died in the hospital, leaving 15,621 who survived the acute care period. Among the survivors, approximately 7244 were discharged to home, without receiving rehabilitation prescription at discharge. We assumed the remaining 8377 would have received a referral for rehabilitation care, and we broke down these survivors into the IPR, ESD, or OPR groups by multiplying 8377 by the proportions calculated from the meta-analysis. Table 2 presents the survivors discharged to each type of rehabilitation care and the probabilities of their flow.
Probability of Patient Flow across Rehabilitation Care Types (FY 2014/15–2017/18) a

CI, confidence interval; ESD, early supported discharge; FY, fiscal year; IPR, inpatient rehabilitation; OPR, outpatient rehabilitation.
This table indicates patient flow from acute care to either IPR, ESD, or OPR and from IPR to either ESD or OPR, and so forth. The total number of stroke survivors (i.e., 8377) was estimated based on health administrative data, whereas the proportion discharged to each rehabilitation segment was estimated, based on disease severity, from published clinical evidence.
Derived by multiplying the total number of patients needing rehabilitation care (i.e., 8377) by the proportion in each type of care (fifth column).
The proportions referred from acute stroke care to the relevant destinations were derived by dividing the number of patients discharged to each type of care (third column) by the total number of acute care survivors (i.e., 15,621). Other proportion values were obtained from Alberta data or the literature.
It is worth noting that the survivors transferred to each rehabilitation destination at the time of acute care discharge are deemed to represent the theoretical need for rehabilitation care for the following reasons. First, the proportions of survivors in each segment of rehabilitation care over all survivors eligible for rehabilitation care were derived from our meta-analysis that pooled published studies,39–46 while survivors who were discharged to home were identified from administrative medical records. Types of the identified published studies were meta-analysis, 44 systematic review of literature,43,45 and observation study of health administrative data.39–42,46 Readers are referred to our report of health technology assessment for a detailed review. 47 The survivors included in these studies may be clinically meaningful representatives of those who can be expected to meet the eligibility criteria for the relevant segments of rehabilitation care. Second, patients with stroke were identified using a widely accepted approach, 26 and data were obtained from a high-quality database (DAD).48,49 Therefore, we are confident that the retrieved cohort represented the majority, if not all, of stroke survivors who could benefit from rehabilitation care.
Model Uncertainty
To enable decision makers to evaluate the credible range of potential costs and outcomes, it is important to provide information regarding the degree of variability in the potential costs and effectiveness. As discussed above, the optimization model applied DES as an objective function. A unique feature of the simulation is that it is a stochastic process that mimics the impact of patient flow across all therapeutic segments on the outputs. Uncertainties in inputs were considered through random draws from predetermined distributions.
The baseline analysis was conducted using inputs (see Tables 1 and 2) and capacity values generated using the GA. There was a discrepancy between existing and predicted optimal capacity as well as in the therapeutic durations between current provincial practices and Canadian stroke best practice recommendations. 14 To address the impact of the discrepancy on wait time and system costs, the sensitivity analysis looked at 3 scenarios: (1) optimal capacity: the GA was used to search for the optimal capacity for each type of rehabilitation care, based on existing LOS and therapeutic intensity measures (that is, for IPR, the time a therapeutic professional stayed with a patient in each therapy type and LOS, or, for ESD/OPR, the therapeutic duration); 2) status quo: existing capacity for IPR, ESD, and OPR care and therapeutic intensity were applied as model inputs; and 3) Canadian guidelines: existing provincial capacity was applied but with LOS and therapeutic intensity that followed the recommendations by the Canadian guidelines. 14 Note that the guidelines change over time, and here we were working from recommendations in the 2015 update.
The cost savings predicted in the model highly rely on the assumption that patients on the waitlist for rehabilitation care incur the same costs as acute stroke care patients. To test the impact of the assumption, we conducted a sensitivity analysis by varying the wait time cost.
Distribution Fitting
Patients’ interarrivals (numbers and times) to a hospital, LOS, and associated costs all change in a random fashion, and therefore, for the purposes of our analysis, within our model we deemed each to be a “random walk” that introduces uncertainty into health care decision making. Using probability distribution fitting on an empirical data set is a scientific method of handling such uncertainty. The aim of distribution fitting is to determine which probability distribution type best reflects the empirical data sets (which, in this analysis, include patient interarrival times, LOS, and associated costs). More precisely, it is a process that consists of choosing the distribution type and estimating the parameters of that distribution so that the statistics of the empirical data (for example, mean, variance) correspond as closely as possible to those of the distribution. Using the R package known as fitdistrplus, we first created the Cullen and Frey graph, 50 which presents a variety of candidate distributions of a given data set, to visualize the distribution and to choose the candidates for further investigation. Next, we run the fit-distribution function that generates distribution parameters and goodness-of-fit measures of Akaike information criterion (AIC) and Bayesian information criterion (BIC) and creates 4 plots of Q-Q plot, P-P plot, distribution density, and cumulative distribution function for visual assessment of goodness of fit. By considering the values of AIC and BIC alongside the visual assessment, we determined, among the candidate distributions, the distributions that best fit the data sets.
Standardizing data to a probability distribution also has the benefit of allowing a model to be applied in other jurisdictions.51,52
Summary of Model Inputs
As shown in Table 1, acute stroke care LOS during the examined period ranged from 1 to 35 d, with a mean value of 8.63 (s = 7.92) d, and the mean costs per day for acute stroke care hospital stay and associated physician services were $1980 (s = $1072) and $143 (s = $101), respectively. The frequency of patients arriving at acute stroke care hospitals was described using interarrival times, defined as the time (in days) between successive arrivals. The 4-y data indicated a mean interarrival time of approximately 0.10 (s = 0.11) d, meaning there was a patient arrival at an acute care unit every 2.4 h.
The LOS for IPR during the examined period ranged from 1 to 114 d, with a mean value of 45.64 (s = 23.09) d. The 4-y data indicated a mean interarrival time of approximately 0.515 (s = 0.91) d, meaning there was a patient arrival at an IPR facility every 12.35 h (Table 1). The summary of ESD and OPR services is also presented in the table. On average, each patient had 38 ESD and 22 OPR visits and spent 66.8 and 66.2 min per visit, respectively.
Our analysis indicated that the distributions of best fit to the LOS, interarrival times, and cost data were, respectively, the negative binomial distribution, the exponential distribution, and the gamma distribution (see Table 1 for fitted distribution parameters). The empirical density and the histogram are presented in Supplementary Material, Figures A.1 to A.5.
We used an R package known as fitdistrplus 53 to fit the distributions to the empirical data sets in our analysis, simmer for DES, 54 and GA for GA. 55
Results
sROM generated an optimal combination of capacity among 3 rehabilitation segments. The wait time for each form of rehabilitation care would be close to zero if the capacity at the optimal level was from an existing 75 to 113 patients per day for ESD and from an existing 101 to 143 patients per day for OPR. For IPR, there was limited change between the number of existing and optimal beds; for ESD and OPR, this implies an increase of 38 and 42 patients per day, respectively. The projected results from the model under the 3 scenarios are presented in Table 3.
Projected Results from Discrete Event Simulation, by Scenario

ESD, early supported discharge; Inf, infinite; IPR, inpatient rehabilitation; LOS, length of stay; N, number of patients; OPR outpatient rehabilitation; s, standard deviation;
Capacity is measured in the number of beds for IPR and the number of patients per day for ESD and OPR.
Patients waiting for IPR and ESD are assumed to stay in acute care beds, and therefore, acute care bears the cost. Waiting for OPR is not costless; we assumed that 5% of OPR patients would wait for the services in acute care beds, and their costs were included.
Because the analysis focuses on rehabilitation care of stroke, it is assumed there is enough capacity to accommodate all patients with acute stroke. The analysis therefore assumes an infinite number of beds in acute stroke care.
Figure 3 shows the number of patients predicted to receive each type of rehabilitation care per year under the 3 scenarios. For IPR, a small difference (less than 10) in the number of patients who would receive the services was predicted between the 3 scenarios. For ESD, the model predicted that the optimal capacity scenario would provide care to 138 (s = 29.05) more patients than the status quo scenario. While the optimal capacity scenario included more patients for each type of care compared with the status quo, OPR had the largest difference of 262 (s = 44.65) more. The predicted wait times for IPR, ESD, and OPR under the 3 scenarios are shown in Figure 4. The optimal capacity scenario was associated with the least amount of wait time (zero or close to zero days) for all 3 rehabilitation care segments, while there was wait time for all 3 types under the status quo scenario.

Number of patients receiving each segment of rehabilitation care, by scenario. The values of standard deviation under the optimal capacity, Alberta status quo, and Canadian guidelines scenarios are 25.0, 14.8, and 28.3 for IPR; 28.3, 26.4, and 31.0 for ESD; and 37.8, 23.8, and 14.1 for OPR (see Table 3). Under the Canadian guidelines scenario, fewer patients receive OPR compared with ESD or IPR care because the therapeutic duration is much longer under the guidelines’ recommendation than the Alberta status quo (50 v. 22 visits; see Table 1). Similarly, more patients receive ESD care under the Canadian guidelines scenario, likely due to the shorter therapeutic duration recommended (20 v. 38 visits; see Table 1). ESD, early supported discharge; guidelines, Canadian guidelines scenario; IPR, inpatient rehabilitation; OPR, outpatient rehabilitation; optimal, optimal capacity scenario; status quo, Alberta status quo scenario.
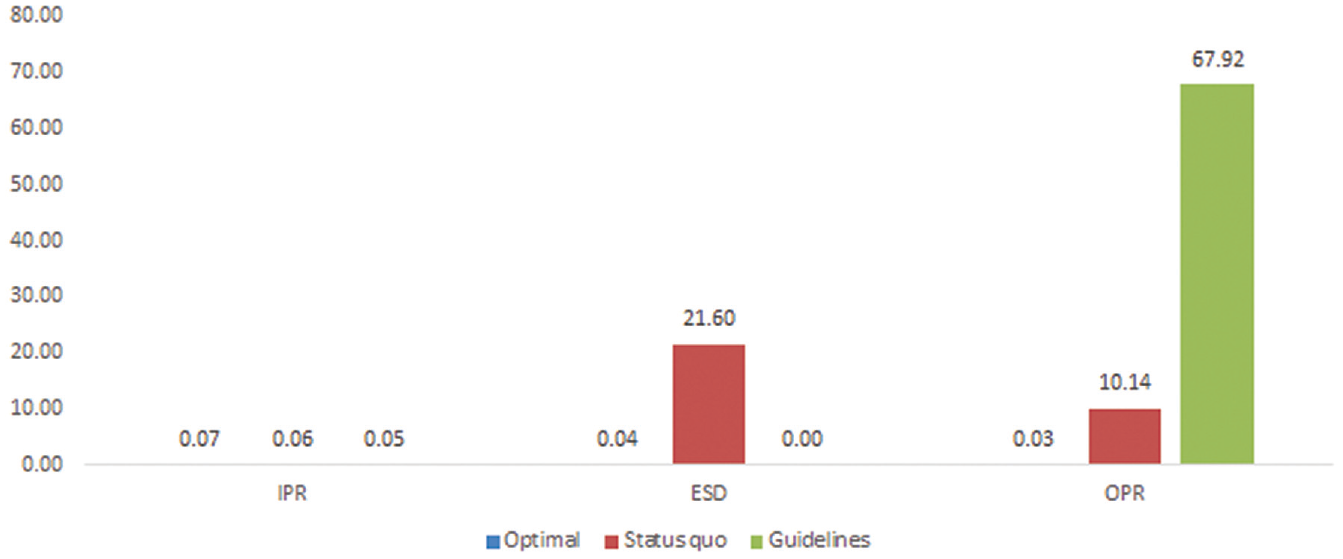
Wait-time (in days) for each type of rehabilitation care, by scenario. The standard deviations under the optimal capacity, Alberta status quo, and Canadian guidelines scenarios are 0.24, 0.21, and 0.16 for IPR; 0.16, 18.02, and 0 for ESD; and 0.13, 8.44, and 53.66 for OPR (see Table 3). ESD, early supported discharge; guidelines, Canadian guidelines scenario; IPR, inpatient rehabilitation; OPR, outpatient rehabilitation; optimal, optimal capacity scenario; status quo, Alberta status quo scenario.
Figure 5 shows the predicted costs in millions under the 3 scenarios. Because more patients would receive care under the optimal capacity scenario, the annual costs under this scenario were higher than the status quo scenario, with a difference of $ 0.08 (s = 1.91) million, $2.20 (s = 0.66) million, and $1.61 (s = 0.41) million yearly for IPR, ESD, and OPR, respectively. These costs can be interpreted as the investment of expanding the rehabilitation care capacity. However, the cost specifically due to waiting for rehabilitation care was much higher under the status quo scenario than under the optimal capacity scenario, that is, $29.76 (s = 10.06) versus 0.20 (s = 0.14) million. After considering the cost of wait time, in total, the cost was the lowest under the optimal capacity scenario. When compared with the status quo scenario, this suggests that increasing rehabilitation care capacity would result in better outcomes (that is, more patients receiving rehabilitation care) while having an estimated annual cost savings of $25.45 (s = 15.02) million. Figure A.6 in the Supplementary Material presents the results of a sensitivity analysis assessing the impact of the cost in patients on the wait list. As showed in the figure, given the assumption that the cost of patients on the wait list is 20% more than that in base-case analysis, the savings in annual cost will increase from $25.45 (s = 15.02) to 31.48 (s = 18.08) million.
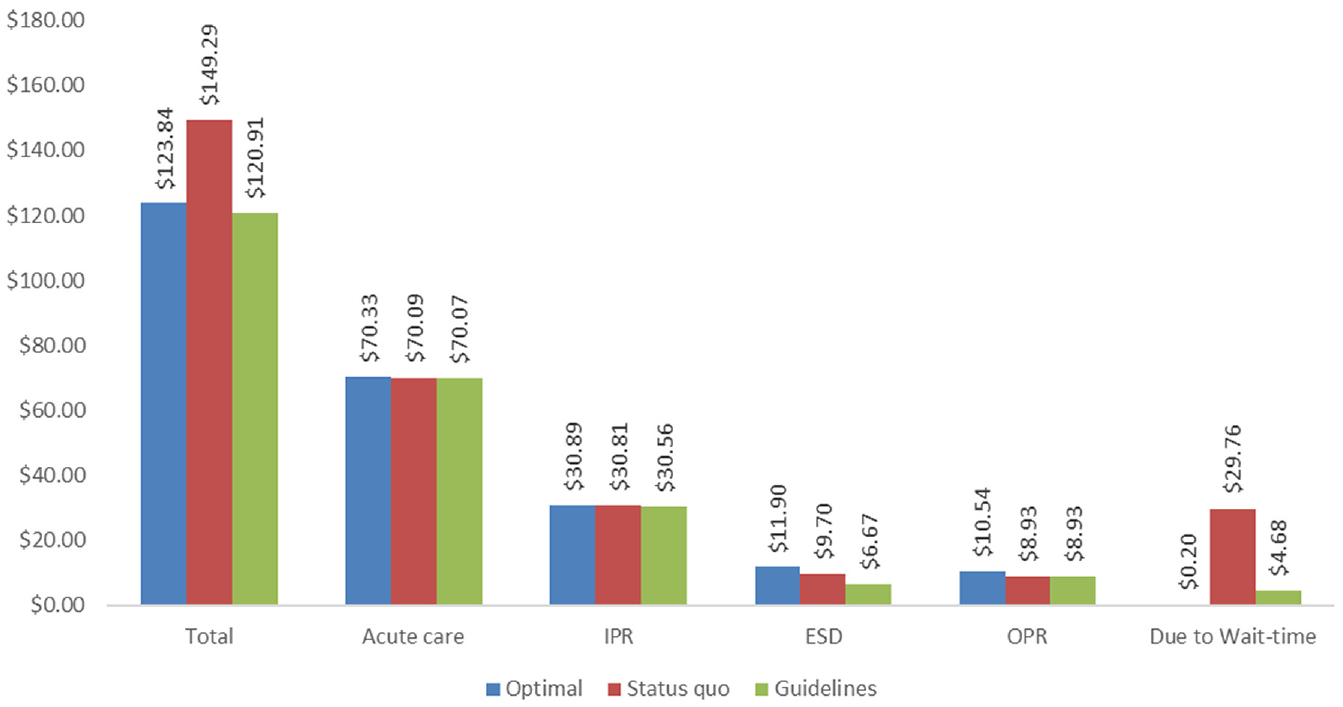
Annual cost (in millions) of rehabilitation care, by type of care and scenario. Because the optimal capacity scenario serves more patients, the annual costs for IPR, ESD, and OPR under the scenario are higher than other scenarios. These costs can be interpreted as the investment of expanding the rehabilitation care capacity. When taking the cost of wait time into account, the optimal capacity scenario is less costly. The figure indicates that the total cost under the Canadian guidelines scenario is lower than the optimal capacity scenario; this situation likely occurs because the model assumed that waiting for OPR incurs costs for only 5% of the patients, and patients under the Canadian guidelines scenario would have a much longer wait time. If raising the proportion to 10% of referred patients who incur costs waiting for OPR, the optimal capacity scenario would be $1.64 million less costly than the Canadian guidelines scenario. The standard deviations for these cost items are presented in Table 3. ESD, early supported discharge; guidelines, Canadian guidelines scenario; IPR, inpatient rehabilitation; OPR, outpatient rehabilitation; optimal, optimal capacity scenario; status quo, Alberta status quo scenario.
Figure 6 shows the gaps between the service provision of IPR, ESD, and OPR care in fiscal year 2017/18 and the projected numbers of patients accessing rehabilitation care if the system were running at optimal capacity. When compared with these observed numbers of 707, 491, and 1158 for IPR, ESD, and OPR, respectively, it is predicted that there will be 823 (s = 25.0), 751 (s = 28.3), and 1704 (s = 37.8) patients receiving the care at optimal capacity.

Observed and projected numbers of patients who received IPR, ESD, and OPR (fiscal year 2017/18). The observed patients are deterministic variables, while the projected patients have taken parameter uncertainty into account. This figure presents mean values, and the associated standard deviation is 25.0, 28.3, and 37.8 for IPR, ESD, and OPR, respectively. IPR, inpatient rehabilitation; ESD, early supported discharge; OPR, outpatient rehabilitation.
Discussion
Summary and Interpretation
In our model, we applied a GA-based approach to search for optimal capacities of stroke rehabilitation services.29,33,34 The object function was created using a DES, which is a stochastic modeling approach widely used in decision-support tools for health care management.27,56 The simulation imitated the patient flow in the system at given time intervals and captured the therapeutic durations of the rehabilitation care and associated resource utilization for each patient. This modeling approach is flexible in estimating with supply and demand for rehabilitation care resources and is preferred for making appropriate resource allocation decisions.19,28,57
The analysis considered a minimum wait time for each segment of rehabilitation care as the priority, and so the capacity of delivering rehabilitation care was deemed as optimal if it generated a minimum wait time for each type of rehabilitation care. Under optimal capacity, the cost of rehabilitation care to the health system would be minimum, given the assumption that patients on wait lists would occupy beds in acute stroke care units. In other words, a reduction in the wait time for rehabilitation care would release scarce acute care resources.
The rationale for this assumption is that an insufficient capacity of rehabilitation care would result in extra disease burden. This extra disease burden could come from several sources; for example, some patients may stay in acute care units while waiting for transfer to rehabilitation care, candidates for IPR who do not have access to IPR will have a higher overall cost to the health system than those who have received the care, and the health outcomes of patients for whom access to rehabilitation care is delayed or who have received no rehabilitation care will be worse compared with those who have received timely access to rehabilitation care. Based on the available data, estimating precisely all the sources of potential costs is unfeasible. To simplify the estimation, the analysis assumed that the cost for patients on a wait list for IPR or early support discharge equaled the cost of when they were in acute stroke care.
For any given capacities of IPR, ESD, and OPR care, DES can generate wait times for each of the 3 types of care. The optimization process searches for possible capacity combinations, known as search space and identifies the one that generates the minimum wait times. Search methods using conventional techniques were not feasible for our analysis because of the model complexity. First, the wait time for 1 segment of rehabilitation care is dependent on the capacity of not only that segment itself, but also the other 2 segments; this nature of mutual dependence means the search space is very large. Second, the stochastic nature of DES means that it takes a longer time to run than a deterministic modeling approach; searching for an optimal solution is a highly time-consuming process. As an alternative to conventional techniques, the analysis used GA to search for optimal capacities.29,33,34
In an illustrative case study, we applied the model to search for the optimal configuration of rehabilitation care services in a Canadian province. Our model predicted that, under optimal capacity, more patients would receive rehabilitation care than under existing provincial capacity. Although providing rehabilitation care to these extra patients would require resource allocation to therapeutic teams, the resulting decrease in resource consumption in acute stroke care units due to the reduced wait time for rehabilitation care would compensate this reinvestment. Our model predicted a net cost savings under optimal capacity, compared with the existing delivery model. Reinvestment in stroke rehabilitation care capacity would therefore be cost-effective and would improve system performance, in that it would provide care to more patients who need the services while resulting in net cost savings. Part of the savings experienced in the acute care units could potentially offset the reinvestment in rehabilitation care, as resources needed to expand rehabilitation care could be reallocated from the savings in the acute care units.
In addition, sROM may be applicable to other health care services, for example, telerehabilitation. In the era of the COVID-19 global pandemic, access to rehabilitation has been limited, and building up the capacity for telerehabilitation is of critical importance for providing outpatient and community rehabilitation services.8,58–60 Lack of sufficient evidence and experience on stoke telerehabilitation services is a challenge for evidence-based resource allocation decisions. Our model, with appropriate model adjustments to patient flow, patient outcomes, and patient eligibility for telerehabilitation, may help to predict demand for telerehabilitation services from patients switching from community or OPR.
In the NRS database, there is a field that looks at when the patient is “rehab ready,” and this often gets compared with what date they officially get admitted to IPR. The problem is that that field is notoriously wrong. It is affected, for instance, but who deems that a patient is rehab ready. Whereas someone in acute care might think someone is rehab ready, the patient is nowhere near ready. Alternatively, the person from the rehab hospital may go only to the acute care site once a week to determine if people are rehab ready, so a patient may be rehab ready for almost a week before they are officially deemed rehab ready.
Strengths and Caveats
The ability of a model to generate appropriate estimates is reliant on how robust its input parameters are. The advantages of sROM include the use of high-quality real-world data for estimating key model parameters and our combination of DES and GA approaches. The 4-y data from DAD (which, as mentioned above, is well known for being a high-quality data source) 61 were applied to estimate the number of patients admitted to acute stroke care units; using data from multiple years ensures both that the sample size is large enough and that the data set is reliable. We then conducted rigorous statistical analysis and determined what distributions fit the data best. Perhaps standardizing real-word data to a best-fitted distribution can increase our model’s generalizability, as users in other jurisdictions can apply the model by simply altering the distribution parameters that fit the context of the jurisdiction. Although the current analysis was performed at a provincial level, our model is flexible and can be applied at a local or community level by a simple adjustment to input parameters. It is important to note that the generalizability does not imply that overall provincial capacity can be estimated from the estimates at local or community level, because, for instance, it is often infeasible to apply spare capacity in one geographic location for demand in others that may be distant.
Our model should be interpreted in the light of the following caveats. First, clinically, not everyone with a stroke can necessarily go home to ESD because they have a moderate versus a mild stroke, which is too difficult for a caregiver to provide enough care for them at home. Clinical decisions about the discharge destinations in the rehabilitation system (i.e., IPR v. ESD v. OPR) relies typically on the severity of stroke. The administrative data we collected has limited information on stroke severity, and we therefore estimated patient flow across the rehabilitation types using data collected from published studies. Further study with the data on referrals to IPR, ESD, and OPR would be sufficient to inform the investment in new rehabilitation capacity. Second, the time period for this model was pre-COVID, and we did not consider the virtual rehabilitation services. Since COVID, the province has seen an increase in virtual rehabilitation services, which could be a consideration going forward for inclusion. Third, it assumed that patients who have no access to rehabilitation care at the time of prescription will have to wait in queues, that patients on the wait list will wait for that care in acute stroke care units, and that the cost during this wait time would be equal to that of acute hospital stay. Based on the data available, it is difficult to accurately estimate the cost for patients on the wait list. Fourth, in addition to longer wait time, studies have previously reported that limited access to rehabilitation care is less cost-effective and more costly than full access.15,40–43,46 Predicted cost savings in the model were realized only from reduced LOS in acute care units due to prompt access to rehabilitation. Due to limited data available on the causal relationship between rehabilitation access and poststroke downstream resources used as well as patient outcomes, the downstream costs poststroke (e.g., postdischarge emergency department visits) were not included in the model. Excluding this piece of cost may underestimate the cost savings from prompt access to rehabilitation care. Our sensitivity analysis indicated that, should the cost of patients on the wait list be 20% more than that in base-case analysis, the savings in annual costs will increase from $25.45 to $31.48 million. Furthermore, patient outcomes of stroke survivors were not explicitly assessed. Fifth, most patients on the wait list for OPR will wait for the care in their home and consume fewer health resources, but experts have suggested that some stay in acute care hospitals while waiting. Because of limited data availability, it is difficult to estimate accurately the proportion of patients on the OPR wait list who would stay in acute care. Alternatively, we estimated the wait-time cost by assuming 2 scenarios (5% and 10% of patients waiting in acute care beds), all of which may not reflect the actual proportion. Sixth, our analysis did not include infrastructure investments such as the equipment and buildings for accommodating extra rehabilitation users, which could affect decision making.
Conclusion
Optimal allocation of health care resources is a complex health policy consideration concerned with the tradeoff between care delivery alignment and cost containing. We proposed an optimization model that applies multiple analytic techniques including best distribution fit to standardize real-world data, DES to simulate resources used and GA to search for optimal service capacity. We demonstrated sROM is a potentially useful way to determine optimal service capacity in an illustrative case study of configurating stroke rehabilitation services. The optimal configuration of stroke rehabilitation services produced by the model can improve the system value of stroke rehabilitation in that it serves more stroke survivors who need the care while being associated with significant net cost savings.
Supplemental Material
sj-docx-1-mpp-10.1177_23814683221134098 – Supplemental material for Optimal Planning of Health Services through Genetic Algorithm and Discrete Event Simulation: A Proposed Model and Its Application to Stroke Rehabilitation Care
Supplemental material, sj-docx-1-mpp-10.1177_23814683221134098 for Optimal Planning of Health Services through Genetic Algorithm and Discrete Event Simulation: A Proposed Model and Its Application to Stroke Rehabilitation Care by Charles Yan, Nathan McClure, Sean P. Dukelow, Balraj Mann and Jeff Round in MDM Policy & Practice
Footnotes
Acknowledgements
The authors are grateful to the Expert Advisory Group for providing guidance on the study scope and the Health Evidence and Policy Unit, Alberta Health, for facilitating meetings and communications. They acknowledge and thank the IHE staff Sasha van Katwyk for comments on the article, Ann Scott for reviewing clinical studies and retrieving clinical data, Lisa Tjosvold for providing information specialist support, and Bing Guo and Tennile Tavares for coordinating the research and research assistance.
The authors declared no potential conflicts of interest with respect to the research, authorship, and/or publication of this article.
The authors disclosed receipt of the following financial support for the research, authorship, and/or publication of this article: This research was funded by a financial contribution from Alberta Health through the Alberta Health Evidence Reviews Process, the Alberta model for health technology assessment and policy analysis. The funding agreement ensured the authors’ independence in designing the study, interpreting the data, writing, and publishing the study.
Author Contributions
Sean P. Dukelow and Balraj Mann conceived the study. Sean P. Dukelow provided critical consultations to guide the study design, analysis and interpretation of results. Charles Yan, Nathan McClure and Jeff Round contributed to the analysis of data. All authors contributed to the study design, interpretation of the results, drafting of the article, critical revisions of the article for important content, gave final approval of the version to be published, and agreed to be accountable for all aspects of the work.
References
Supplementary Material
Please find the following supplemental material available below.
For Open Access articles published under a Creative Commons License, all supplemental material carries the same license as the article it is associated with.
For non-Open Access articles published, all supplemental material carries a non-exclusive license, and permission requests for re-use of supplemental material or any part of supplemental material shall be sent directly to the copyright owner as specified in the copyright notice associated with the article.