
Abstract
Highlights
Population-level mammography screening effects on breast cancer mortality emerge gradually following screening introduction, resulting in very low statistical power of trend analysis.
Researchers and policy makers evaluating mammography screening should avoid relying on population-wide breast cancer mortality trends.
Expected mammography screening effects at population level are lower than those from screening trials, as many cases of breast cancer fall outside the screening age range.
This is a visual representation of the abstract.
Introduction
In the 1980s and 1990s, public mammography screening was introduced in many Western countries,1–3 based on results of randomized trials showing a 20% to 30% reduction in breast cancer mortality among screened women.4,5
Following the introduction of population-based screening programs, several observational studies assessing overall time trends have shown no clear effect of screening on breast cancer mortality,6–10 whereas studies looking exclusively for an effect of screening among women without prescreening diagnoses (refined breast cancer mortality) have shown results in line with the randomized trials.11–16
As screening improves the prognosis by opening for earlier treatment, screening will not affect breast cancer cases already diagnosed, as these cases are already under treatment. Even with a screening program that perfectly prevents breast cancer deaths, we would still see a considerable number of breast cancer deaths overall due to cases diagnosed before screening introduction. When breast cancer mortality studies do not separate cases diagnosed before and after the introduction of screening, the effect of screening will be diluted. 17
How strong the dilution effect is, and whether changes in breast cancer mortality trend related to screening can be distinguished from random fluctuations, is not well known. We here perform a simulation study to assess whether studies of breast cancer mortality trends not separating cases diagnosed before and after screening introduction can be expected to detect any effect of screening.
Methods
Studying how the effect of screening on breast cancer mortality is likely to appear at population level, we simulated breast cancer mortality in a given population around the time of screening introduction. We studied the population breast cancer mortality rate, defined as number of breast cancer deaths divided by woman-years under study. Postscreening breast cancer deaths could originate from diagnosis both pre and post screening introduction, while only the breast cancer cases diagnosed after the introduction of screening could benefit from screening through earlier treatment. In our simulations, we start with assuming no screening effect, before adding a potential screening effect to the cases incident after screening introduction. To estimate the expected number of new postscreening incident cases in the absence of screening effects, we applied the distribution of times from primary breast cancer diagnosis to death for women who died of breast cancer in Norway prescreening. We used 1990 to 1994 as the prescreening period, the most recent 5-year prescreening period.
We assumed the effectiveness of screening in preventing breast cancer deaths among women with no prescreening diagnosis to be 33% (Table 1). We applied an attendance rate in organized screening of 75%, and for the sake of simplicity, we assumed that women who participated in the program attended all screening exams to which they were invited. This implies a screening program effectiveness in preventing breast cancer deaths of 25% among invited women with no prescreening diagnosis (75% of 33%), which is on par with reductions in breast cancer mortality seen in randomized trials and in population-based studies of refined breast cancer mortality.4,5,13,18 For age groups that are no longer in the target group for program screening, we assumed a decreasing screening effectiveness, using weights based on simulations from the Cancer Intervention and Surveillance Modelling Network (CISNET) Stanford breast cancer simulation model.3,19–22 The population-level screening effect, including both women with or without a breast cancer diagnosed before screening introduction, is the main outcome of this study (Table 1).
Different levels of observing the impact of screening on mortality

Calculated in this work based on I and II.
In Europe, a common and recommended mammography schedule is to screen women for breast cancer every other year between the ages of 50 and 69 y, 23 and we aimed to reproduce that schedule here.
For reasons of resources and capacity, screening is typically introduced at different times across a country’s regions. Hence, in addition to introducing a screening program over 2 y, we used the introduction design of BreastScreen Norway as an example of a realistic gradual screening introduction.
BreastScreen Norway, organized by the Cancer Registry of Norway, invites women aged 50 to 69 y living in Norway to mammography screening every other year. 24 In practice, women are invited by birth cohorts to countywide screening rounds, 24 with age typically ranging from 48 to 53 y at first invitation and from 66 to 71 y at last invitation. The program started between November 1995 and February 1996 as a pilot study in 4 large counties accounting for approximately 40% of all eligible women in Norway. The remaining 15 counties were included in a stepwise manner between 1999 and 2004 (Figure 1). The pilot study was designed to offer the women at least 2 screening exams, which led to some women being invited up to 73 y of age. Attendance in the program has remained fairly stable over the years at about 76%, 24 which is close to the 75% attendance rate applied in this study. At initiation of public mammography screening, Norway had a total of 4.4 million inhabitants. 25

Proportion of Norwegian women aged 50 to 69 y living in counties with screening. Because the screening program is biennial, women are typically screened between 0 and 2 y after initiation of screening in their county.
For the simulations, we used the number of female breast cancer deaths and residents in Norway aged 0 to 84 y, by county, birth cohort, and single calendar year (1985–2018). Reporting of cancer cases to the Cancer Registry of Norway is mandatory, and diagnostic information is obtained separately from clinicians, pathologists, and death certificates, with only 0.2% of all cancers ascertained only from death certificates. 26 The unique 11-digit national identity number of each citizen allows reliable follow-up.
Statistical Analysis
We first estimated the population-level screening effect, assuming that all women eligible for screening in a given population were invited on the same day. To understand the potential of screening in lowering overall breast cancer mortality, we started by considering a screening program with no screening effectiveness. After the program was introduced, a proportion of breast cancer deaths would arise from new postscreening incident cases, whereas the remaining deaths would arise from old prescreening incident cases. To estimate the proportion of breast cancer deaths based on new postscreening incident cases, in the absence of screening effects, we used the distribution of times from diagnosis to death for all breast cancer deaths that occurred in Norway from 1990 to 1994, when no deaths were averted by program screening. As an example, the proportion of the prescreening period deaths that occurred within 1 year after the time of breast cancer diagnosis is an estimate of the proportion of deaths based on new postscreening incident cases 1 year after screening initiation, with a potential for screening effects. Hence, we calculated the proportion of deaths that occurred within 1, 2, . . . , 419, 420+ mo after the time of breast cancer diagnosis, for the age groups 50 to 59, 60 to 69, 70 to 79, and 80 to 89 y (Supplementary Figure A1).
We then applied the 25% screening program effectiveness on the estimated proportion of breast cancer deaths based on new postscreening incident cases. We calculated the effect for 1-y age groups for every month following the program initiation, accounting for age and time since screening initiation for the given cohort. For age groups no longer in the target group for screening, we applied weights deduced from the CISNET Stanford model to estimate the decline in the screening effectiveness after passing the program’s upper age limit with no new additional screening exams (Supplementary Appendix A2). Furthermore, we added screening introduction over 2 y by letting 1/24 of women currently in the target age group for screening be invited each month (Supplementary Appendix A3).
When calculating population-level screening effects for different age groups (50–54, 55–59, 60–64, 65–69, 50–69, 55–74 y and all ages), we weighted the estimated age-specific population-level screening effects by the observed age distribution of breast cancer deaths in Norway from 1990 to 1994 (prescreening). The long-term population-level screening effect for a given age group reflects the effect when all women have been invited to screening since 50 or 51 y of age.
To illustrate the expected population-level screening effect on the breast cancer mortality rate in Norway, we calculated the counterfactual breast cancer mortality rate in the absence of screening. This counterfactual breast cancer mortality rate was estimated by adjusting the observed breast cancer mortality rate for the estimated expected population-level effects of screening (Supplementary Appendix A4 and A5).
Furthermore, we used simulated scenarios to evaluate whether it is possible to separate any effect of screening from random fluctuations. The baseline variations in breast cancer mortality due to risk factors and treatment are mostly unknown. Hence, we chose to test whether a screening effect is possible to detect even in the artificially stable scenario of only random (Poisson distributed) fluctuations: the expected breast cancer mortality rate was set to be constant, at the mean 1990 to 1994 rate in Norway of 60 deaths per 100 000 woman-years for women aged 50 to 69 y and 31 deaths per 100 000 woman-years for women up to 84 y of age. On top of this, we added the always present random variation and our estimated expected population-level screening effect based on the introduction of BreastScreen Norway. We simulated the number of breast cancer deaths, based on approximately 400 000 women aged 50 to 69 y, for the period 1985 to 2015.
When evaluating the simulated breast cancer mortality rates searching for the screening effect, we applied joinpoint regression analysis.27–30 Joinpoint is a robust, well-recognized, and well-documented package for identification of distinct changes in trends and has been used in several breast cancer mortality trend studies.6–8,10,17 A k-joinpoint model consists of k+1 linear segments, continuously connected at change points (joinpoints). We searched for up to 2 joinpoints in the simulated mortality rates. For any effect of screening to be regarded as identifiable, a joinpoint must be identified near the time of program initiation. We also performed simulations with an assumed screening program effectiveness of 10% and 33%, simulations with screening introduced over 2 y from 1996 (“rapid introduction”), and simulations with the gradual BreastScreen Norway introduction combined with doubling and 5 times the Norwegian female population. Last, we restricted the study periods to 1985 to 2005 and 1985 to 2010.
We used version 4.9.0.0 of the National Cancer Institute’s Joinpoint Regression Program (National Cancer Institute, Bethesda, MD, USA). 30 Searching for up to 2 joinpoints in the mortality rate means that 3 models are fitted. To select among the joinpoint models, we let the joinpoint program use the weighted Bayesian information criteria (BIC), which combines the BIC and a version of BIC with a harsher penalty term (BIC3), as this method is less conservative (joinpoints more easily detected) than the default choice of permutation tests. 31 Otherwise, we used the default settings in the joinpoint regression program, which includes logarithmic transformation of rates. All other statistical analyses and plots were conducted using the R statistical package (version 4.0.3, R Foundation for Statistical Computing, Vienna, Austria). 32
The funding agreement ensured the authors’ independence in designing the study, interpreting the data, writing, and publishing the report.
Results
We found that the population-level screening effect is likely to emerge very gradually (Figure 2; Supplementary Table A1). Given a screening program effectiveness of 25%, the expected population-level effect of screening on breast cancer mortality for women aged 50 to 69 y was estimated to 3% after 2 y, 11% after 5 y, and 16% after 10 y of screening when screening is introduced over 2 y. We estimated the long-term effect for this age group, reached after 20 y, to be 18%. Based on the introduction of BreastScreen Norway, we estimated the expected population-level screening effect in 2018 to be 17% for women between 50 and 69 y of age (Supplementary Table A2). The observed breast cancer mortality rate in Norway, and the corresponding counterfactual rate in the absence of screening, showed a very gradual separation over time (Figure 3).

Expected population-level screening effect on breast cancer mortality, based on an assumed 25% screening program effectiveness (33.3% among attending women and 75% attendance). The expected effect after 25 y of invitations is marked on the right axis.
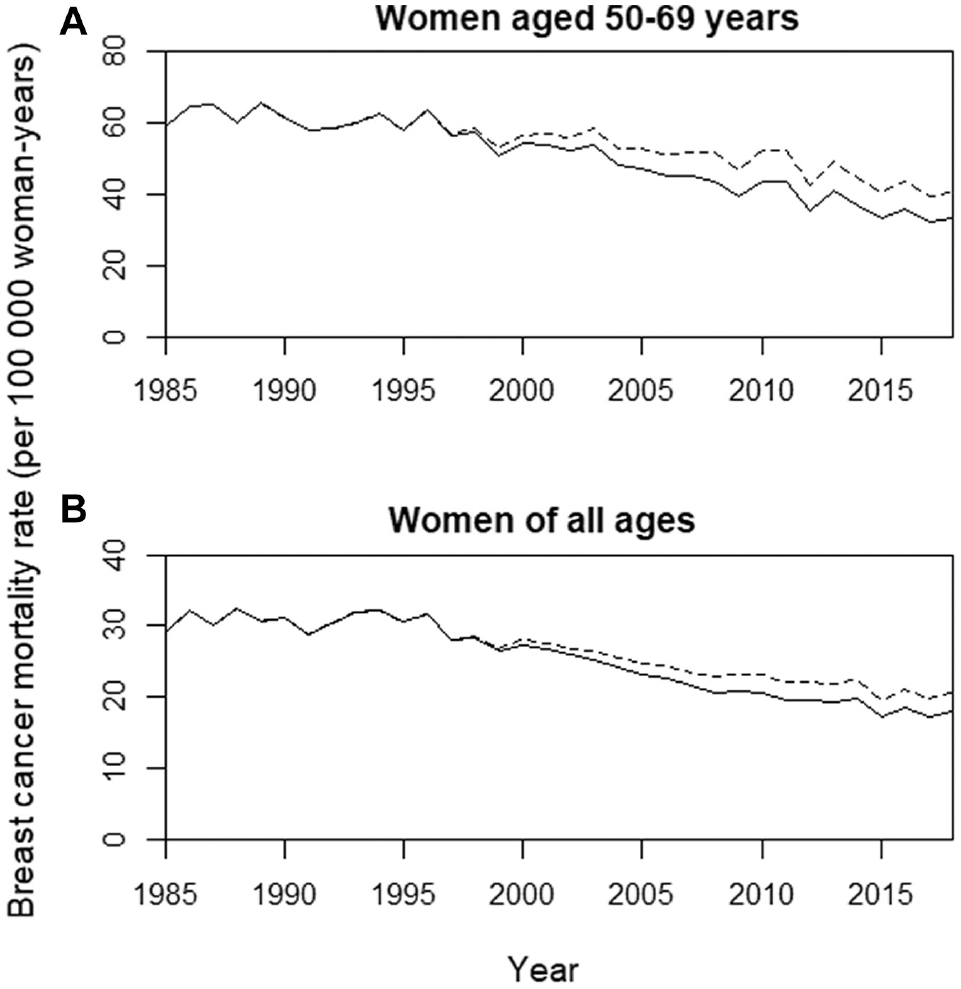
Observed Norwegian breast cancer mortality rate (solid line) and the expected corresponding counterfactual breast cancer mortality rate in the absence of screening effect, assuming a 25% screening program effectiveness (dotted line), for (A) women aged 50 to 69 y and (B) women aged up to 84 y (age standardized).
For the simulations, we defined the statistical power to detect the screening effect as the percentages of simulated mortality rates with at least 1 jointpoint identified between 1993 and 2003. Based on 10 000 simulations for women aged 50 to 69 y, with a 25% screening program effectiveness, we found a statistical power of 25% (Table 2). By doubling the size of the population, we found a power of 51%. A screening program effectiveness of 10% gave a statistical power of 4%, while an effectiveness of 33% (equaling a 44% effect among attendees) resulted in a statistical power of 42% (Table 2). Limitation to the study period 1985 to 2010 resulted in somewhat higher chances of joinpoints (Supplementary Table A3), but the statistical power was still low. Extension to 0 to 84 y for long-term follow-up data increased the statistical power somewhat as we also covered the postscreening age groups (Supplementary Table A4), but the effect is moderate.
Statistical power to detect changes in breast cancer mortality rates, 50-69 years of age, using joinpoint analysis in a setting like the Norwegian screening introduction. Simulations are performed for an artificially stable scenario of constant rates in the absence of a screening effect. Due to additional variations in risk factors and treatment, real-life statistical power is expected to be substantially lower. Calculations are based on 10 000 simulated breast cancer mortality rates.

The effect of screening on breast cancer mortality will always stabilize at some time point, ending the declining trend. Longer follow-up could then dilute change points in trend, so a model free of joinpoints fits the rate better. With a more rapid screening introduction, the trend is stabilized earlier, increasing this phenomenon. With a rapid screening introduction and long follow-up, there is also a tendency for a screening-related joinpoint to occur before program initiation, especially in a 1-joinpoint model (Figure 4).

Changes in the expected breast cancer mortality rate (solid line) due to (A) a screening introduction a la Norway and (B) a 2-y introduction. The dashed line shows the fitted 1-joipoint model, with the joinpoint highlighted (circle). The vertical dotted line shows the time of screening initiation.
Discussion
In this study, we found that an effect of screening on breast cancer mortality could not be detected in population-wide breast cancer mortality trend studies for the most realistic settings. The low statistical power makes analyses of overall breast cancer mortality trends nonconclusive. We found that the population-level screening effect emerges very gradually and that the population-level effect is considerably lower than the effect reported in screening trials. The reason for the low statistical power of jointpoint and other methods of linear trend analysis is 2-fold: first, a screening effect emerges so gradually that trend analysis using joinpoint regression has a very low chance of detecting the effect, and second, the methods are well suited for detecting linear trends, but screening effects do not appear in a linear fashion (Figure 2). A cohort of approximately 2 million women in the age range 50 to 69 y was necessary for the statistical power to be satisfactory, even in the artificially stable scenario of constant baseline breast cancer risk over time. This is 5 times the number of women aged 50 to 69 y in Norway.
It has been discussed at which time point breast cancer mortality rates may start showing a downward trend that can be attributed to mammography screening.17,33 Population-based studies have sometimes detected turning points within the first 5 y after screening initiation,33–37 but turning points have also been found before screening was introduced. 38 Some studies that identified joinpoints before screening started concluded that the change could not be attributed to screening.6,8,17 However, using joinpoint analysis, we found that due to random fluctuations and nonoptimal fit to the joinpoint line segments, a break downward may well be observed before screening started. In practice, the joinpoint model aims to fit both the initial decline when screening first starts to have an impact and the flatter, long-term trend that occurs some years later. Balancing the fit to both the decline and the flatter part of the trend, the joinpoint may sometimes be shifted backward in time (Figure 4). Generally, we find that a turning point in the trend should appear around the time screening is introduced: the joinpoint routine typically highlights joinpoints early after screening introduction, as this coincides with the initial decline (Table 2). In practice, fitting a simulation model with different levels of screening effectiveness will be better for studying trend changes than joinpoint analysis, as simulation models provide a more realistic change in mortality trends. 39 However, with data combining deaths from breast cancers diagnosed before and after screening, all analyses will have a low statistical power to identify any effect of screening.
The distribution of times from diagnosis to death from breast cancer (Supplementary Appendix A1) is a key input for our analysis. In practice, we had only the time interval since first diagnosis of breast cancer. This could overrate time to death and bias our results, but second breast cancers are rare. 40 Regardless of screening, this distribution might change somewhat over time, due to increased awareness, changes in risk factors, and improved treatment. However, these factors could lead to both shorter and longer time intervals between diagnosis and death, and historical data showed only small variation by time (data not shown).
The assumed screening program effectiveness of 25% was based on results from high-quality studies.11–15 The real efficiency of modern mammography screening is not precisely known, 41 and some studies suggested smaller 42 or larger effectiveness.43,44 Regardless of the actual effectiveness, the screening would influence the population-wide breast cancer mortality rate just as gradually as shown here, only with a different scaling. The power to detect the effect of screening on breast cancer mortality is affected by the screening effectiveness, but even with an attendance rate of 75% and 44% mortality reduction among screened women, a very large population with similar screening startup times is needed.
We assumed the screening effectiveness to be present and constant already from program initiation among new breast cancer cases. Screening typically shifts the time of diagnosis forward by several years.18,45,46 Hence, some might argue that screening will have no influence on breast cancer deaths the first years after program start. However, many of the breast cancer deaths with a short time from clinical diagnosis to death are probably fast-growing tumors reaching high stages at clinical diagnosis. These fast-growing tumors probably also have a considerable potential for an improved prognosis with just slightly earlier diagnosis through screening. The Swedish randomized trials overview indicates a relatively larger impact of screening on breast cancer mortality the first years after screening introduction, but the numbers were too small to draw firm conclusions or determine statistical significance. 18 Overall, it is not known precisely how the effectiveness of screening varies; however, smaller variations in the initial effectiveness among the few breast cancer cases diagnosed soon after screening introduction would have limited impact on our results.
The down-weighting of the screening effectiveness at higher ages was based on simulations from the CISNET Stanford model. As this model is calibrated according to American screening practices, there are likely some deviations that may somewhat influence our results. This does, however, relate only to the 70+ y age group and would not affect our main results.
In practice, who is attending screening might vary somewhat between screening rounds. This might increase the screening effect compared with our simulated scenario with regular attendance. The increased statistical power is, however, limited, as even with 100% screening attendance, the statistical power is 42%. The attendance rate level affects the statistical power of trend analysis methods. Hence, the real statistical power is likely to be even lower in many countries that do not have the high attendance rate seen in Norway. Also, inaccurate registration of breast cancer deaths could lead to more noisy data, making it even more difficult to find an effect of screening.
In the real world, both breast cancer risk factors and available treatment change over time, and the true statistical power of trend analyses is probably considerably lower than demonstrated in this study.
Conclusion
Studies of breast cancer mortality trends that do not separate cases diagnosed before and after screening introduction cannot be expected to detect any effect of screening. Screening influences the overall breast cancer mortality rate very gradually. Hence, the population-level effect of screening will usually not be possible to reliably separate from random variations in trend analysis.
Public health officials should not rely on breast cancer mortality trend analysis mixing cases diagnosed before and after screening introduction and should be aware that the population-level screening effect is expected to be lower than the effect reported in screening trials.
Supplemental Material
sj-docx-1-mpp-10.1177_23814683221131321 – Supplemental material for Interpreting Breast Cancer Mortality Trends Related to Introduction of Mammography Screening: A Simulation Study
Supplemental material, sj-docx-1-mpp-10.1177_23814683221131321 for Interpreting Breast Cancer Mortality Trends Related to Introduction of Mammography Screening: A Simulation Study by Torunn Heggland, Lars Johan Vatten, Signe Opdahl and Harald Weedon-Fekjær in MDM Policy & Practice
Footnotes
Acknowledgements
We thank Sylvia Plevritis and Diego Munoz for providing inputs from the Stanford breast cancer screening model, funded by the National Cancer Institute CISNET program U01CA253911/U01CA199218. Computation of relevant variables used in the study is shown in the web-only appendix.
The authors declared no potential conflicts of interest with respect to the research, authorship, and/or publication of this article. The study used data from the Cancer Registry of Norway. The interpretation and reporting of these data are the sole responsibility of the authors, and no endorsement by the Cancer Registry of Norway is intended nor should be inferred.
The authors disclosed receipt of the following financial support for the research, authorship, and/or publication of this article: The work was done at Oslo Centre for Biostatistics and Epidemiology (OCBE), Research Support Services, Oslo University Hospital. Financial support for this study was provided entirely by a grant from the South-Eastern Norway Regional Health Authority. The funding agreement ensured the authors’ independence in designing the study, interpreting the data, writing, and publishing the report.
Supplemental Material
Data Availability
The data are available for research projects from the legal administrator of the data, the Cancer Registry of Norway. For data requests, contact
References
Supplementary Material
Please find the following supplemental material available below.
For Open Access articles published under a Creative Commons License, all supplemental material carries the same license as the article it is associated with.
For non-Open Access articles published, all supplemental material carries a non-exclusive license, and permission requests for re-use of supplemental material or any part of supplemental material shall be sent directly to the copyright owner as specified in the copyright notice associated with the article.