
Abstract
The volume of health care services delivered in specialty outpatient settings continues to grow.1–3 This trend is a result of multiple factors including technological advances leading to more procedures being done in ambulatory settings, lower costs associated with services in outpatient facilities as compared to hospitals, higher safety measures in outpatient settings, and outpatient facilities being better positioned to meet patient preferences and convenience. As the emphasis placed on value across health care continues to mature, it is expected that the growth in outpatient care delivery will also continue.
Increasing demand for specialty outpatient services has led existing health systems to build and grow their ambulatory care facilities. This growth has led to changes in the operational structure of how outpatient care is delivered. In response to meeting patient preferences for clinic hours that do not conflict with work or school schedules, more outpatient facilities are maintaining longer clinic days (e.g., 12-hour days). 4 This results in more efficient use of physical resources as there is less time the facility and equipment sit idle. Depending on affiliations with hospitals and the number of clinical sites needing coverage, providers may not necessarily be scheduled in a particular clinic full time. Rather, they may spend a half-day or a few days a week at a specific outpatient facility. Thus, newer facilities are being designed with more flexible space and shared resources in mind. The result is that the traditional approach of assigning clinic resources (e.g., exam rooms) to providers happens less often and provider staffing levels need to be balanced with availability of these shared resources. 5 Finally, as care becomes more interdisciplinary and the use of team-based care models grows, coordination of provider and ancillary staff schedules is an additional necessary consideration in operational planning. Collectively, these characteristics form the challenges in designing modern outpatient care delivery systems and represent the need for decision support approaches that balance these competing operational goals and requirements.
While a changing operational landscape is evident in specialty outpatient care, there is a continued need for administrative decision makers to maintain adherence toward traditional performance measures. Specifically, outpatient facilities continue to aim for high service levels through ensuring timely access to care and high patient visit volumes. Investments in expensive resources (facilities, equipment, highly trained specialists, etc.) underscore the constant goal of achieving high utilization rates and occupancy. Furthermore, patient and staff satisfaction give impetus to the design and operationalization of balanced and efficient practices. If ill-planned, the lack of a systematic decision-making approach to planning and delivering specialty outpatient care could result in poor quality, a high-stress working environment, provider burnout, and low patient satisfaction. An underlying tension at the center of decision makers’ implementation of outpatient clinic schedules is the need to maintain high utilization of resources and space, maximize patient access, and balance provider schedule continuity while at the same time mitigating the effects of an overly busy and crowded clinical environment.
The aim of this article is to develop a decision support method and tool that would provide an outpatient care delivery decision maker the means to balance the competing needs and objectives discussed above. The underlying research question can be described as follows: How should specialty provider schedules be designed in outpatient settings in order to be responsive to the changing state of outpatient care delivery? Specifically, this article presents a modeling-based approach for decision makers to obtain an outpatient clinic provider schedule that meets the needs and goals of their specific setting. The results presented in this article are based on a case study using real schedule requirements and demonstrate the value of the proposed method.
Methods
In this section, we present a constrained optimization model to support decision making in outpatient provider scheduling. Constrained optimization is a modeling approach that provides a prescribed solution to a defined problem. Its methods draw from operations research, computer science, mathematics, and early motivational applications focused on production and manufacturing environments. More recently, however, constrained optimization has proven valuable in health care delivery contexts including optimal treatment design, patient scheduling, resource allocation, and pharmacy inventory management. 6 The value of constrained optimization in health care decision making continues to be demonstrated to the broader health economic, outcomes, and evaluation communities. 7
To fully define a constrained optimization problem three elements are required: decision variables, an objective function, and constraints. Each of these pieces serve to bridge a problem context from description to mathematical representation. The decision variables represent the discretionary choices a decision maker may take in a problem setting. The decision variables are manipulated and adjusted to either maximize or minimize the objective function. The objective function evaluates the performance of a particular set of decisions with regard to defined measures or criteria. Finally, the constraints define the scope of available decisions and limit the range of values decision variables may assume. Together, these components define a constrained optimization formulation which is then solved using appropriate algorithms or optimization software.
Mathematical Model
With the aim of designing a provider schedule the decision variables are defined using the following indices: We let
Decision Variables
Enumerated over the indices
Objective Function
Different outpatient care delivery systems may have varying goals or criteria in designing provider schedules. Here, we introduce an objective function that aims to minimize the hourly variability in use of the clinic space in a scheduled time frame (e.g., a week). That is, we assume an objective function that minimizes the fluctuations between low utilization of resources and high, or potential overutilization of resources. Specifically, the following objective function minimizes the variance of the number of providers in the clinic across the scheduling time frame. We refer to this objective function as MINVAR (minimizes variance).

In objective function (1) the variance of the number of providers scheduled during each time unit is calculated with respect to the average number of providers scheduled across all time units and days in the scheduling time frame, µ. Using the objective function defined in (1), µ is incorporated as a decision variable and will be fully defined in the constraints to follow. Because µ will depend on the particular schedule being evaluated, it cannot be calculated a priori as a parameter.
While provider volume variability is identified as the principle objective here as it mitigates against both overcrowding as well portions of the schedule with empty clinic schedules, other objectives can also be considered. For example, achieving high patient throughput, maximizing resource utilization, or minimizing patient wait time are common operational goals for clinic settings. 8 Oftentimes such objectives may be in conflict with one another, or competing. That is, an operational schedule that maximizes patient throughput may also result in high patient waiting. Furthermore, other objectives such as these may also require altering the total number of providers in a clinic or changing how patients are scheduled. Alternatively, the objectives presented here assume that such decisions are static and we focus on improving the provider schedule based on the clinic settings current state (e.g., size, patient mix, etc.).
Constraints
The following set of constraints define the requirements for a feasible provider and for a repeatable scheduling time frame. The parameter


Constraint set (2) ensure that the prescribed schedule adheres to the stipulated clinic FTE allocation for each provider. The constraint set defined in (3) can be interpreted as requiring that if a provider is scheduled during two time units in a day (e.g., hours), they must be contiguous and part of a single duration. In other words, constraint set (3) make certain that a provider’s clinic schedule will not be segmented during a given day. Constraint set (4) calculates the average number of providers in clinic across the scheduling time frame and constraint set (5) require that the decision variables defined only take on binary values.
Alternative Measures to Balance Clinic Activity
As previously discussed, decision makers in different clinic settings may have alternative goals that better align with the nature of their specific practice. We introduce two alternative objective functions for evaluation. The first minimizes the range of providers scheduled and second minimizes the maximum number of providers schedule. However, we note that the constrained optimization framework introduced here is flexible and adaptive to other clinical and operational goals that can be articulated in this decision-making approach. While the two alternative objective functions introduced here are generally similar in aiming to more efficiently use clinic space and provider time, their underlying goals differ from the objective function in (1). Constraint sets (2), (3), and (5) remain as requirements for each of the alternative objectives.
The first alternative objective function seeks to minimize the range of the number of providers scheduled in the clinic across the scheduling time frame. That is, the difference between the maximum number of providers scheduled at any time and the minimum number of providers scheduled at any time is minimized. This objective is formulated in (6) with additional constraints (7). This objective introduces a new decision variable, α≥ 0, which represents the range of the number of providers scheduled. We refer to this objective formulation as MINRANGE.


The second alternative objective function evaluated minimizes the maximum number of providers scheduled in the clinic at any time and is referred to as MINMAX. Similar to MINRANGE, MINMAX uses the decision variable α≥ 0 to represent the maximum number of providers in the clinic. Constraints (9) ensure that α is greater than the total number of providers in the clinic at any time. The objective function in (8) minimizes α.


Incorporating Nonclinic Activity Schedules
Depending on the specialty clinic setting and context, the design of the provider clinic schedules may be influenced by nonclinic activities and commitments. These may include teaching and precepting responsibilities, dedicated research time, administrative duties, operating room (OR) schedules, and more. The scheduling of these activities may be directly incorporated into a constrained optimization model where additional decision variables are included to define when providers are scheduled to each activity.
9
Alternatively, such scheduling decisions may occur exogenous to the provider clinic scheduling process. In this case, additional constraints may be added to the model to restrict the clinic scheduling decisions to be consistent with nonclinic activity schedules. For example, if provider

Model Implementation and Solution Approach
The constrained optimization models MINVAR, MINRANGE, and MINMAX were coded in AMPL, an algebraic modeling language used for representing optimization models.
10
From a technical classification standpoint, the constrained optimization model MINVAR is a nonlinear integer program as the objective function (1) is nonlinear with respect to the decision variables and
Results
Study Setting
The constrained optimization models were evaluated using historic provider schedule templates from an outpatient specialty clinic at M Health Fairview’s Clinics and Surgery Center. This clinic is open 12 hours per day, 5 days per week. Three reference scenario schedules were used based on actual week-long schedules from the clinic. The reference scenario schedules were chosen as being representative of different schedules used at different times of the year. Multiple reference schedules were identified in order to evaluate the model results and improvements across instances. Furthermore, multiple week-long templates are commonly used as provider schedules may include weeks of inpatient service, conference travel, or other responsibilities which pull them out of the clinic for a week or longer. Provider schedules may also repeat on a weekly, biweekly, or monthly basis. The constrained optimization models analyzed here are flexible and can be adapted to a particular clinic’s scheduling time frame. Schedule characteristics of the three reference scenarios are provided in Table 1, such as the number of providers scheduled and provider clinic hours available.
Three-Week-Long Clinic Schedule Reference Scenarios Were Used to Evaluate the Model Results

Results Comparing Models and Actual Schedules
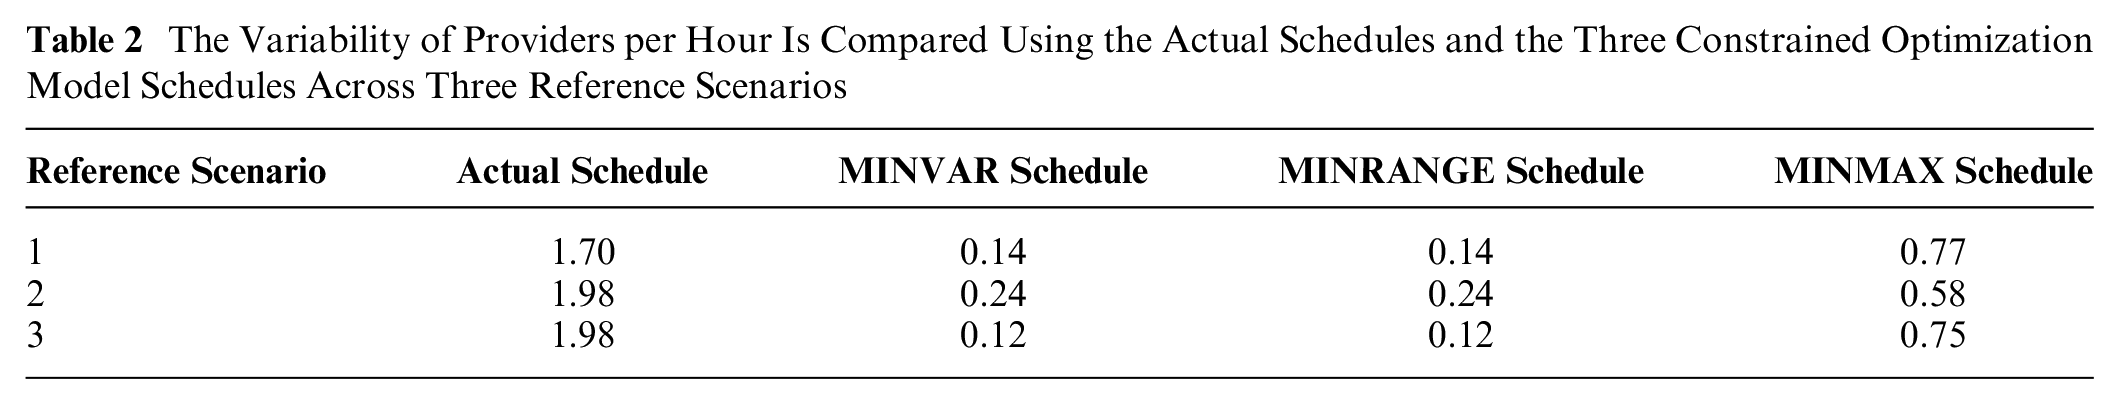
The three constrained optimization models were evaluated using parameters in each of the reference scenarios across multiple performance measures. Table 2 includes the variability in the hourly number of providers scheduled for each schedule and reference scenario. For illustration, Figure 1 shows the hourly number of providers in the clinic longitudinally for each of the 5 days in Scenario 1 for the actual schedule and the schedules resulting from the models. As can be seen in Table 2, each of the three schedules resulting from the constrained optimization models reduced the variability of the number of providers scheduled per hour when compared to the actual schedule in all of the reference scenario instances. The MINVAR and MINRANGE model schedules reduced the variability the most in each reference scenario (by as much as 94% in Reference Scenario 3). We note that the variability measures reported for the MINVAR and MINRANGE schedules are equivalent in each of the reference scenarios. This could be a result of the models resulting in identical schedules or the occurrence of multiple schedules yielding equal variance measures as defined in (1).
The Variability of Providers per Hour Is Compared Using the Actual Schedules and the Three Constrained Optimization Model Schedules Across Three Reference Scenarios

The number of providers scheduled in the clinic during each hour (12) for each day (5) for Reference Scenario 1 is shown for illustration. The actual schedule and the schedules resulting from the models are included.
The minimum and maximum number of providers scheduled within the clinic at a given time is presented in Table 3 for each of the resulting schedules. Each of the three constrained optimization model schedules make improvements over the actual schedules by reducing the maximum number of providers scheduled as well as reducing the range of the number of providers scheduled. In particular, the MINRANGE schedule results in the lowest maximum number of providers scheduled and the lowest range across each of the reference scenarios (3 and 1, respectively).
The Minimum and Maximum (Minimum, Maximum) Number of Providers Scheduled Throughout the Week During a Given Hour Are Compared Using the Actual Schedules and the Three Constrained Optimization Model Schedules Across Three Reference Scenarios

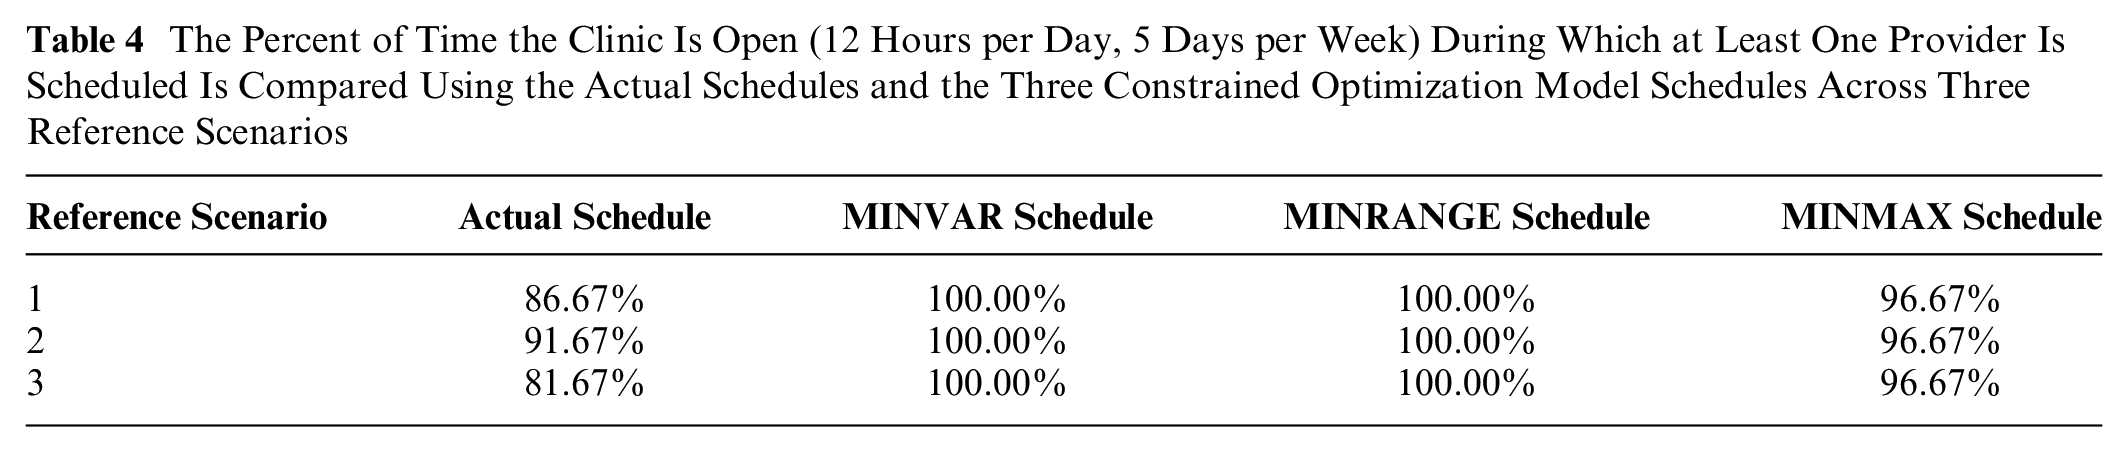
Clinic utilization rates were evaluated for the reference scenarios and each of the constrained optimization schedules. Clinic utilization is defined as the portion of time the clinic is open (12 hours per day, 5 days per week) during which at least one provider is scheduled. That is, the clinic is not considered utilized when there are no providers scheduled. Table 4 includes the utilization rates for each of the reference scenarios across each of the schedules. The MINVAR and MINRANGE schedules scheduled at least one provider during every hour the clinic was open in the week-long schedule. While the MINMAX schedule did not achieve 100% clinic utilization in any of the reference scenarios, the resulting clinic utilization rates were higher than the actual schedules in each of the reference scenarios.
The Percent of Time the Clinic Is Open (12 Hours per Day, 5 Days per Week) During Which at Least One Provider Is Scheduled Is Compared Using the Actual Schedules and the Three Constrained Optimization Model Schedules Across Three Reference Scenarios
Discussion
Three constrained optimization models were proposed and evaluated using three different performance measures: 1) the variability of the number of providers scheduled in the clinic, 2) the range in the number of providers scheduled in the clinic based on the difference between the maximum and minimum, and 3) the clinic utilization rates resulting from the schedules. Included in the results were comparisons to actual schedules used in practice from three different reference scenarios. The three constrained optimization schedules performed better than the actual schedules is each performance measure. Specifically, the MINVAR and MINRANGE schedules provided the lowest variability in the number of providers scheduled, the MINRANGE schedule achieved the lowest range of providers scheduled, and the MINVAR and MINRANGE schedules each attained 100% clinic utilization rates. In addition, each of the three constrained optimization schedules reduced the maximum number of providers scheduled at a given time when compared to the actual schedules in each of the reference scenarios.
Together, the three constrained optimization model schedules present improvements across all performance measures relative to the actual schedules. However, as observed in the results and noted in the methods, each of the models result in different schedules based on their specific objective function. The objective function in MINVAR minimizes the variance of the number of providers. As such, the resulting MINVAR schedules performed the best with respect to minimizing provider variance (Table 2). Similarly, the objective function in MINRANGE minimizes the range between the minimum and maximum number of providers scheduled. We would therefore expect that its resulting schedule would perform the best with respect to the range of providers scheduled (Table 3). With regard to maximizing clinic utilization, both the MINVAR and MINRANGE schedules achieved the highest utilization rates. This is due to the nature of their objective functions seeking to spread out providers across the week, resulting in a fully used clinic.
We note that some performance measures of different schedules are very similar or even equal (e.g., provider variance in the MINVAR and MINRANGE schedules). One explanation is that while the objective functions are different, their aim is similar in trying to level-load the provider schedules in the clinic. However, while it is possible that the different models result in identical schedules, we note that this was not the case here as evidenced by inspection of the daily and hourly schedules. In the end, the choice of which objective function a specific clinic employs in developing their schedule will depend on the goals of the clinic. However, in optimizing one specific objective, our results indicate that other performance measures will experience improvements.
Prior research related to provider scheduling has largely focused on inpatient settings such as hospital units and emergency departments where problems are often categorized as staffing (long term), rostering (medium term or operational), and dynamic rescheduling in their decisions. 12 The aims of provider rostering problems focus on achieving satisfactory coverage in a unit (e.g., emergency department)13,14 to meet uncertain demand and providing equity in the schedule with respect to provider preferences, night shifts, or weekend schedules.15,16 Research focused on provider scheduling in outpatient settings has been concentrated on medical resident scheduling, particularly related to specialty rotation scheduling.17–20
Yet, little is known regarding the design of provider schedules in outpatient specialty clinic settings where providers may spend only a portion of their time seeing patients (v. time allocated to research, education, and administrative duties). The focus of previous research on inpatient settings and specific outpatient settings can be attributed to outpatient care being delivered during “business hour” schedules with little discretion for managing decision-makers. However, as discussed earlier, the specialty outpatient care delivery environment is changing and now includes longer and more flexible clinic days. In contrast, the research presented here focuses on creating a balanced provider schedule in clinic. The impacts of balancing a clinic’s schedule (often referred to as “level-loading”) include more predictable resource and staff to provider ratios, fewer occurrences of highly congested clinic times, more consistent use of resources and capacity, and improved patient experience measures such as wait times. We note that many of the benefits associated with a balanced provider schedule may potentially have intangible benefits to the providers themselves, including lower stress clinic environments and fewer burnout factors. The constrained optimization models presented in this article support administrative decision makers in designing balanced provider schedules in an increasingly complex care environment.
There are several important limitations to the work in this article. First, being able to create a balanced provider schedule assumes and requires that the scheduling of providers is done in a centralized manner. This may not be the case in certain clinics where providers act more autonomously in determining their clinic schedules. Along similar lines, this modeling framework does not account for scheduling support care staff which may be important for cohesion and continuity in team-based care settings. Second, the approach to provider scheduling modeled in this article does not account for individual provider templates regarding how patients are scheduled into the provider’s clinic time. For instance, if certain providers have shorter visit durations and see more patients in a given time span it may be beneficial to schedule them at different times so as to mitigate congestion and blockage of shared resources or staff. Furthermore, the provider scheduling framework here does not directly incorporate provider-specific patient case mix templating which should precede such an implementation to better meet patient demand of services. Finally, this provider scheduling model’s use assumes that all provider schedules are being determined simultaneously. This is appropriate at certain time points (e.g., quarterly or annually) or junctures such as process improvement implementation efforts. However, it may also be the case where a new provider needs to be added or a provider leaves the clinic where the schedule needs to be adapted but redesigning everyone’s schedules may not be warranted. These considerations inevitably need to be made by clinics on a case by case basis.
Future work stemming from the research in this article includes multiple directions. First, incorporating uncertainties which are inherent in clinic scheduling into the modeling framework will provide a more robust evaluation of a particular schedule’s performance with respect to operational measures. These uncertainties may include provider cancellations or punctuality (considering providers are often coming from nonclinic activities at other locations), patient attendance and visit duration, and changes in assigned provider clinic time (i.e., clinical FTE). Second, characterizing the challenges experienced during a structured implementation of the model-based schedules will likely be an important and informative process and documentation for other outpatient clinic decision makers. This process should include a rigorous qualitative analysis of stakeholder perspectives, evaluation of adoption rates across different specialties, an analysis of adaptation practices as different clinics implement such scheduling models, and a longitudinal evaluation of key clinic operational performance measures tracked by provider schedules used.
Footnotes
Acknowledgements
The authors are grateful for the constructive feedback of the anonymous reviewers. The authors thank Dr. James Wilson for detailed comments and discussion in support of the work in this article.
The author(s) declared no potential conflicts of interest with respect to the research, authorship, and/or publication of this article.
The author(s) disclosed receipt of the following financial support for the research, authorship, and/or publication of this article: This work was supported in part by a Grant-in-Aid from the Office of the Vice President for Research at the University of Minnesota. The funding agreement ensured the authors’ independence in designing the study, interpreting the data, writing, and publishing the report.
Authors’ Note
This work was accepted as a poster presentation at the Annual Meeting of the Society for Medical Decision Making in Portland, OR, in October, 2019.