
Abstract
Background and Significance
A health utility is a quality of life weighting factor, measuring patients’ values and preferences for health states.1,2 Utilities in aggregate are critical components of health economic evaluations, such as cost-effectiveness analyses, through metrics such as the quality-adjusted life year. They can also support decision making at the individual patient level.3,4 The theoretical underpinnings of utility assessment derive from von Neumann-Morgenstern utility theory. 2 The resulting health utility weights range from zero to one: one representing full health and zero representing the worst outcome, generally death.
Multiple methods and approaches exist for assessing patients’ utilities including the visual analogue scale (VAS), standard reference gamble (SG), and time tradeoff (TTO).5–8 There have been many attempts to standardize the approach to the assessment process to avoid operator bias and variability, and to simplify the process to avoid repetitious and laborious work on the part of those assessing utilities. Earlier attempts used a variety of paper-and-pencil tools along with adjustable pie charts to represent gambles and TTOs. 9 More recently, computerized tools have been developed. 10 The Interactive Multimedia Preference Assessment Construction Tool is one of the earlier tools that has gone through several iterations and revisions with the most recent version using Adobe Flash and XML to build health utility assessment projects. 11 The Program to Survey Preferences by Evaluating Quality of Life Tradeoffs tool uses standard web platforms (XML, HTML) and contains features including demographic-adjusted information and three utility assessment methods, VAS, SG, and TTO. 12 Other tools are disease specific, or may only utilize a single assessment method. 13 One such example is a Microsoft PowerPoint-based standard gamble tool developed to assess asthma-specific health states in Malaysia. 14 Still some utility assessment methods are platform specific with the aforementioned PowerPoint SG tool or a TTO tool dependent on RedCap. 15
The Gambler II springs from an earlier version developed in 1992. 16 The Gambler was a generalized utility assessment tool that allowed authors to construct projects to assess health states for any disease process, utilizing any or all of a variety of assessment methods including the VAS, SG, and TTO. Life expectancy for the TTO was based on patient age, drawn from life tables published by the Centers for Disease Control and Prevention. The Gambler was coded in Visual Basic and does not run on newer personal computer platforms.
Since the development of The Gambler, many advancements and innovations in computer and software technologies have occurred. HTML and JavaScript matured enough to allow the development of sophisticated web applications.17,18 Increased internet bandwidth along with features such as multimedia clip playback, dynamic content generation, and improved server and graphics technologies supported the development of desktop-grade applications on the web. Database technologies now support storage and retrieval of information with protection on secure servers. These advances coincide with the movement within the clinical informatics world to develop tools that are easier to use and geared toward patients.19–21 The Gambler II is a merited response to this goal.
Understanding the limitations of prior computerized health utility assessment tools and taking advantage of contemporary web-based client-server technologies, our goal was to develop The Gambler II (hereafter referred to as The Gambler) and evaluate its usability, ease of understanding, and feasibility of use in time-sensitive environments. The Gambler is composed of multiple components including the utility assessment authoring tool and the patient-user interface. This article describes the development of the patient-user interface and early feasibility and usability testing of said aspect.
Methods
Gambler: Technical Architecture
The Gambler uses multiple technologies to create a fully functional health utility assessment tool. The web application uses a common architecture known as a LAMP (Linux, Apache, MySQL, and Python) stack to implement web services. 22 Python provides the application backbone for The Gambler, performing the numerical calculations needed to convert SG and TTO results into utility weights. 22 It also serves as the interface between multiple technologies used to store and retrieve information from patients or study subjects. The Gambler uses MySQL as the database repository supporting simple query exchanges from the database to the application with aid from Python. Bootstrap, JavaScript, and Hypertext Markup Language 5 (HTML 5) support the graphic user interface (GUI), allowing web page development that supports the use of multimedia clip, popups, buttons, sliders, and drag and drop features.17,23
Health Utility Assessment Methods
The Gambler supports the use of the following utility assessment methods: VAS, SG, and TTO. The VAS is the simplest and fastest assessment method, but some argue it is not a true utility measure. VAS cannot explicitly distinguish a health state rated at 80 (on a 0 to 100 scale) as twice as good as one rated at 40. SG may be most appropriate for decisions under uncertainty that entail risk, such as the choice between medical therapy and a surgical procedure with a significant risk of death. SG captures risk attitude holistically in its assessment. On the other hand, for decisions that do not entail significant risk, the TTO may be best. All of these methods can be used to assess utilities for either current health states or hypothetical, yet unexperienced health states.
The VAS asks the question, “On a scale where 0 represents death and 100 represents perfect health, what number best represents the health state being assessed?” The Gambler implements the VAS by having the patient move a slider to the point on the 0 to 100 scale to indicate the quality of life for the health state being assessed (see Figure 1).

Visual analogue scale. Patients performing the visual analogue scale assessment click on health state icons and drag them to an appropriate value. The numerical value displayed next to the icons is the utility on a 0 to 100 scale. Hovering over an icon will display a text description of the health state.
Of the three assessment methods, the SG is the most firmly grounded in expected utility theory. The SG assesses a health state by determining the risk of death one would accept to improve quality of life over the health state being assessed. 24 The most common form of the SG asks the respondent to make a choice between a health state with less than perfect quality of life (the health state for which the utility is being assessed), and a gamble with outcomes of perfect health or death. The utility of this intermediate health state is determined by assessing the probability of death at which the respondent is indifferent to the gamble and the intermediate health state. If, for example, the respondent is willing to accept a 15% chance of dying to be in perfect health, the expected value of the gamble would be 0.85.5,24
The Gambler uses the analogy of a pill bottle to represent the gamble (see Figure 2). The bottle contains a certain number of pills that will cure or completely alleviate symptoms of the intermediate health state. However, the bottle also contains some number of “poison” pills that will lead to death. The patient need only take a single pill to be cured. The Gambler ping-pongs back and forth between gambles with higher or lower risk of death, depending on the user’s responses. The goal is to find the point at which the user is indifferent between the health state being assessed and the gamble. At this point, the health state utility can be calculated as follows: Utility = 1 − (Number of poison pills/Total number of pills in the bottle).

Standard gamble. The standard gamble presents users with a visualization of a choice between an intermediate health state, in this case diabetic retinopathy (left side of figure), or a gamble (right side of figure), represented by a pill bottle with varying numbers of cure and “poison” pills. The user selects alternative A (the intermediate health state) or alternative B (the gamble) until they are ambivalent between the two choices, at which point they click on “Equal.”
The TTO assesses utility by asking how much time a patient would be willing to give up to be in a better state of health?24,25 This is accomplished by asking the patient to choose between a set length of life (The Gambler uses the patient’s calculated life expectancy) in a less than perfect state of health and a shorter length of life in a perfect state of health (see Figure 3). The Gambler presents the patient with a series of choices, varying the length of life in perfect health until the patient is ambivalent about the choice. As with the SG above, The Gambler ping-pongs between longer or shorter periods of time in perfect health, depending on responses from the patient. For example, if a patient is willing to accept 10 years of life in perfect health rather than 15 years in an intermediate health state, their utility for the intermediate health state would be 0.67 (10/15). The TTO utility is calculated as follows: Utility = (Time in best health state)/(Total life expectancy).

Time tradeoff. The user is asked to make a choice between a fixed length of life (based on the user’s estimated life expectancy) in an intermediate state of health, in this case, diabetic neuropathy, shown on the left side of the figure, versus a shorter length of time in perfect health, shown on the right side of the figure. The user selects between alternative A and alternative B until they are ambivalent regarding the time tradeoff, at which point they click on “Equal.”
Testing: Usability and Understandability
In order to evaluate The Gambler we developed a full health utility assessment project. We selected type 2 diabetes mellitus (DM), a common health condition that affects over 9% of the US population, so most users would be familiar with the condition and its complications. 26 We developed scenario descriptions for three intermediate health states representing complications of DM, in addition to anchor states of well and dead. These included the following: well with diabetes, diabetic neuropathy, diabetic retinopathy, diabetic foot infection requiring transmetatarsal amputation, and death. We represent each health state with an icon and an accompanying brief text description. In order to make full use of Gambler’s features, we also created video clips using patient actors to describe each health state and the impact it has on their function and mood. We developed four sets of multimedia clips for each health state, one for each of the following demographic groups: White men, White women, Black men, and Black women. Thus, for example, a Black female using The Gambler would view multimedia clips of Black women describing each of the health states representing complications of DM. We asked users to assume the role of a patient with DM.
Our evaluation goal was to enroll a minimum convenience sample of 50 subjects, with varying demographic characteristics as previous efforts have demonstrated acceptable usability sample sizes of 10 or fewer.15,27 Participants came from different parts of the United States, including Ohio, Washington DC, and New Jersey.
We collected a minimal amount of demographic information (age, gender, race), along with highest educational level attained. We also administered a short knowledge survey developed by one of the researchers (MHE), consisting of 10 multiple choice questions (Appendix B) before and after using The Gambler to see whether the process of utility assessment and presentation of information about diabetic complications improved users’ knowledge about these complications. We also asked users to fill out a brief feedback survey at the end of their visit and had an investigator (AAA) conduct a semistructured interview about their experience using The Gambler—problems, what they liked, and suggestions for improving the tool (see Appendix B for questions).
We used an adapted version of the System Usability Scale survey, which uses a 5-point Likert-type scale to evaluate the usability and feasibility of The Gambler (see Appendix B). 28 If responses were missing for any data elements, we simply noted this and factored it in our statistical evaluations.
Tools
We used Apple QuickTime X 10.4-10.5 on an Apple MacBook Pro to record video clips for multiple demographic categories. We evaluated the software using multiple physical and software configurations, including different internet browsers (Apple’s Safari 12.0.0–12.0.2 and Google Chrome OS 68.0.3440–71.0.3578). Many participants used their own computers with a variety of operating systems including Microsoft Windows 10 OS, Google Chrome OS, and Apple Mac OS. A significant number (>25) of users used an Apple MacBook Pro with Mac OS 10.13.6–10.14.2 and a Hewett-Packard Mouse.
Institutional Review Board
The research was submitted to the University of Cincinnati’s Institutional Review Board (IRB) for project approval. The IRB approved the project as nonhuman subjects.
Results
User Characteristics
We enrolled 55 users for this study. Ages ranged between 19 and 71 years, with mean age of 40 years. Locations for testing included Ohio, New Jersey, and Washington DC. Highest educational level attained ranged from high school to doctoral level, with master’s-level education having a plurality. We had a diverse representation of races as shown in Table 1.
User Characteristics

Usability and Understandability
We used nonparametric tests of significance (Mann-Whitney) in our analyses. As shown in Table 2, 79% of the 55 users were satisfied with The Gambler, with scores of 4 or higher. Users understood the utility assessment process. Health state descriptions were clear and understandable for most users. Eighty-three percent and 81% of users, respectively, gave a rating of 4.0 or higher for the SG and the TTO. The majority of users found the pill bottle and the “time bar” useful as representations for the SG and TTO, with 89% and 86% of them affirming that the visuals were easy to understand. Cronbach’s alpha for the usability and understandability questionnaire for all questions excluding the Health State Video and Video instructions for completeness was 0.93.
Understandability and Usability

IQR, interquartile range.
Likert-type scale range of 1 to 5.
Normalized to a range of 0 to 100.
A supermajority of users found health state information easy to understand, with 63% giving the health state information a score of 5. Fifty-seven percent of those who read the text descriptions of health states gave a score of 5. Of those who viewed the multimedia clips describing health states, or the instructional videos, more than half (52%) gave a rating of 5. The total usability score, normalized to a 0 to 100 scale, was 84.9 for total population.
Knowledge Assessment
Fifty-five users completed pre- and postknowledge assessments about the three diabetic complications described in this Gambler project. As shown in Table 3, knowledge scores increased significantly following use of The Gambler. The mean pretest score for the full cohort was 68%, while the posttest mean was 76% (P = 0.005), resulting in an increase of almost 8%. Most subgroups demonstrated statistically significant gains in knowledge following use of The Gambler; knowledge gain between pre- and postassessments were not statistically significant between subgroups. A trend exists suggesting a greater impact on knowledge gain among respondents with less than a bachelor’s degree compared with more highly educated respondents, 10.5 versus 6.1, respectively.
Diabetic Complications Knowledge Assessment
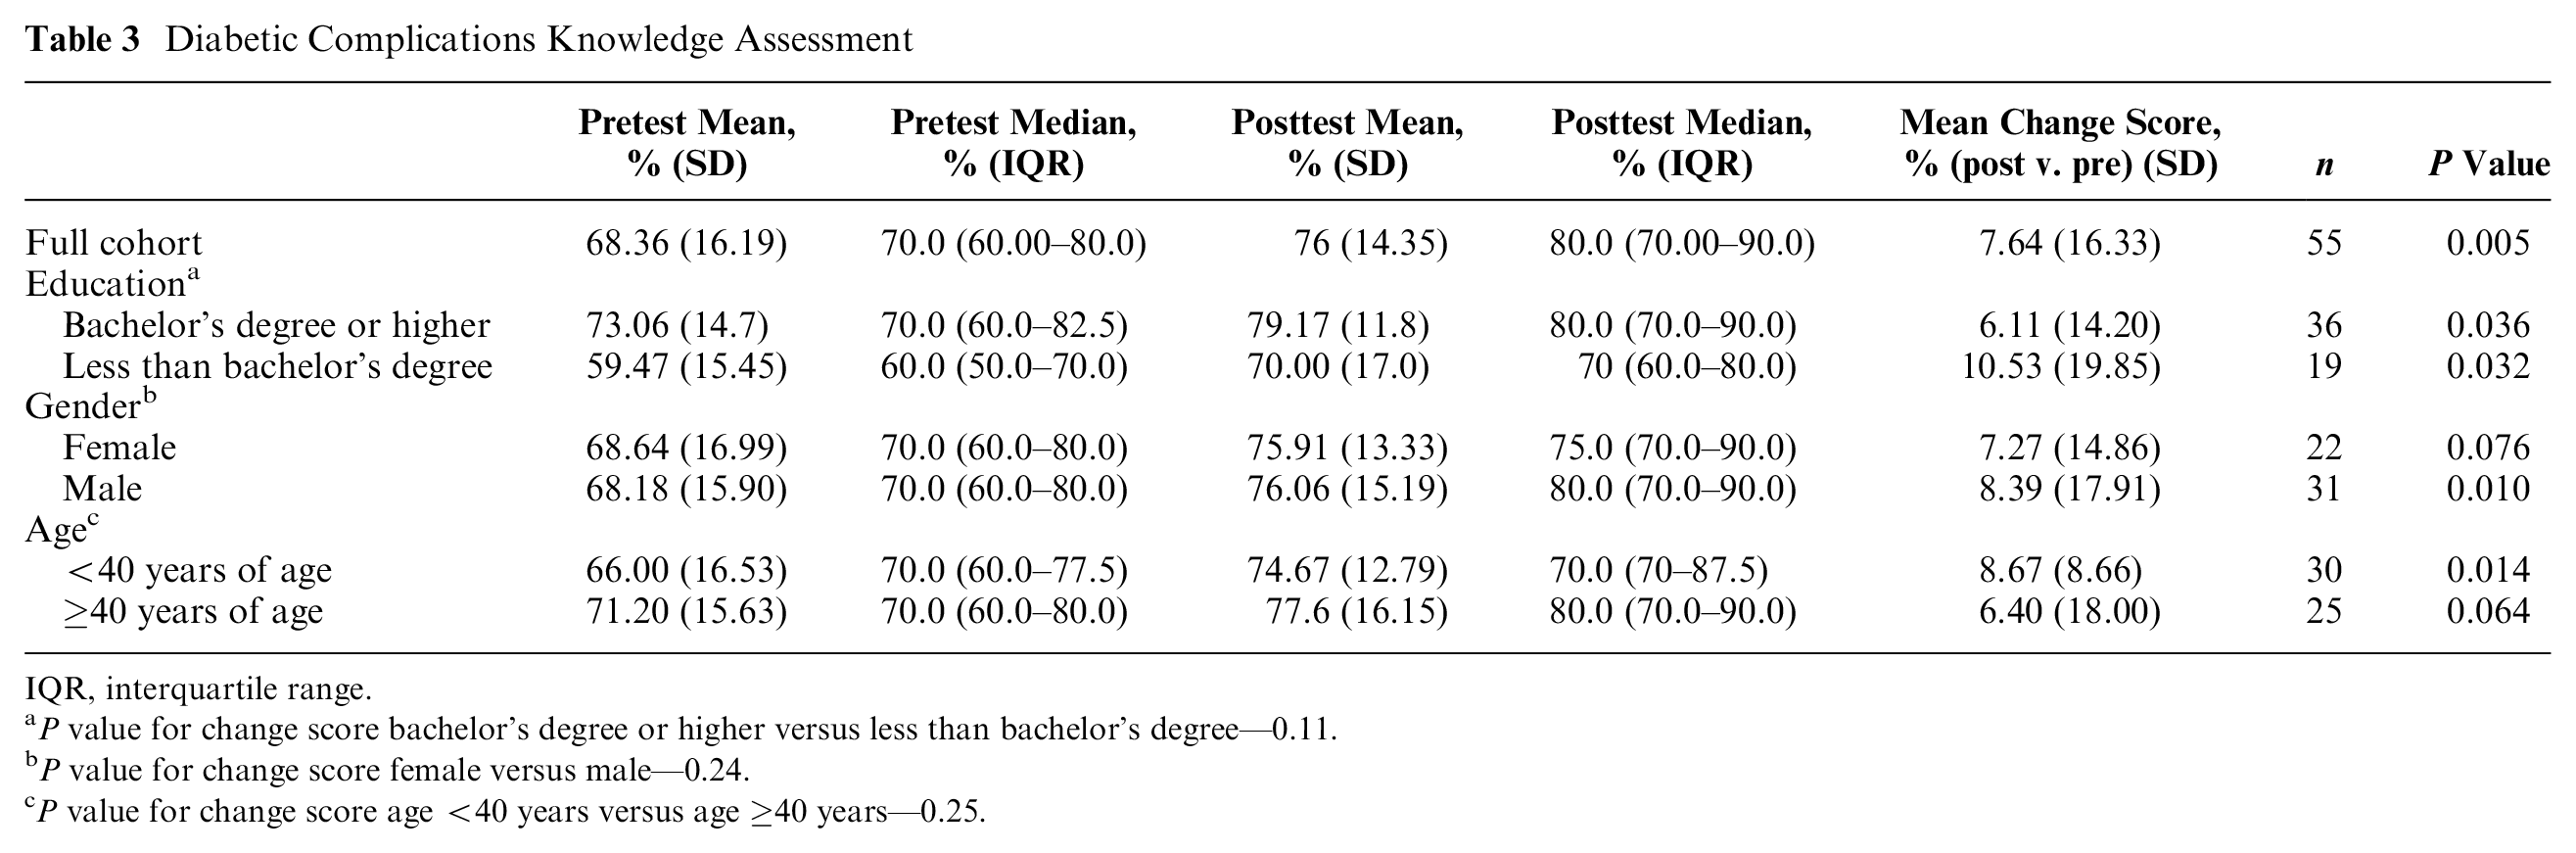
IQR, interquartile range.
P value for change score bachelor’s degree or higher versus less than bachelor’s degree—0.11.
P value for change score female versus male—0.24.
P value for change score age <40 years versus age ≥40 years—0.25.
Test Study for Diabetic Health State Utilities
We assessed utilities for three health states representing complications of DM. As shown in Figure 4, utilities for each health state varied dramatically across users. Utility scores for each respective health state were lowest using the VAS (see Table 4). Utilities using SG assessments were generally higher than either VAS or TTO, with the exception of diabetic retinopathy where the highest mean ratings were from the TTO. As expected, standard deviations around the mean utility scores for each health state are large, likely reflecting large patient-to-patient variation.

Results of health state utility assessments. Radar plots of health utilities for diabetic neuropathy (blue), diabetic retinopathy (orange), and diabetic foot infection requiring transmetatarsal amputation (gray). Each panel depicts results using a different assessment method. Panel A—Visual analogue scale. Panel B—Standard gamble. Panel C—Time tradeoff.
Full Cohort Average Utility for Utility Assessments

IQR, interquartile range.
We examined differences in utilities across user subgroups. Patients 40 years of age and older had higher utilities exclusively with SG than their younger counterparts (P = 0.048; see Appendix A). We noted a similar pattern among respondents with less than a bachelor’s degree compared with those holding a bachelor’s degree or higher, with more highly educated individuals demonstrating a nonsignificant trend toward higher SG ratings for all health states. We found no significant trend in utilities between Black and non-Black users in our analysis. Finally, women demonstrated a nonsignificant trend toward higher health states ratings than men in SG assessments, but there was no consistent pattern in the VAS and TTO assessments. To investigate the possibility of confounders, we performed linear regression analyses on multiple characteristics including age, race, gender, and educational status. We found no statistical significance in usability for users with various differences in characteristics.
Discussion
We developed a usable and easy to understand computer-based utility assessment tool. In our evaluation, for each health utility assessment task, users scored the ease of completing the task at 4 (out of 5). Building on prior efforts, it takes advantage of the latest web technologies to support both the development of health utility assessment projects and the utility assessment process itself. Key features include an interactive user interface that provides graphic visualizations for utility assessments, along with multimedia clips that support both user instructions and health state descriptions using media clips that are demographically matched with users.
A strength of this article, improving the generalizability of our results, is the diversity of participants from different parts of the United States including Ohio, Washington DC, and New Jersey, different age ranges, genders, race, and educational attainments.29,30 Most users regardless of educational status, race, age, or gender found the software easy to use and understandable.
In our review of the literature, we found a number of Gambler’s features to be unique. While other utility assessment tools have used videos as means of communicating information, to our knowledge, none implemented multimedia instructions for patients or used demographically matched video clips to personalize information about health states.11,31 This Gambler feature is based on exemplar theory. 32 In studies examining the influence of narrative health communication on behavior change, exemplar theory proposes that the use of exemplars that more closely match individual patient characteristics engage patients more fully and have a greater impact on behavior change. 33 In unstructured comments, many users stated the availability of multimedia clips was one of the best parts of The Gambler, allowing them to understand health states and utility assessment instructions better (Appendix D).
A key feasibility factor affecting the use of these tools in practice is the time it takes for patients to complete the assessment process.34–36 In particular, if utility assessment tools are to be part of a shared decision-making experience, they must be quick and easy to use. In comments and interviews, users felt the assessment process took a reasonable amount of time to complete. We used metadata to determine the amount of time users spent in total and for each activity. Users spent an average of 2.5 minutes completing the SG, 1.3 minutes completing the TTO, and 1.4 minutes completing the VAS (Appendix Table 2). The total time taken to complete all assessments was roughly 7 minutes (Appendix Table 2). The median time patients spend with their physicians in general practice settings is between 15 and 18 minutes.37,38 Seven minutes added to the beginning of a visit to perform utility assessments is not unreasonable, and in fact appreciated if incorporated into a shared decision-making visit.
As a beneficial side effect of describing health states that patients might face as a consequence of their underlying illness or chronic disease, we hypothesized that use of The Gambler would improve patients’ understanding and knowledge regarding these health states. Indeed, we found that patients’ interactions with The Gambler improved knowledge regarding complications of DM. Median scores on a 10-item knowledge assessment improved from 68.4% to 76.0% (P = 0.005) following interaction with The Gambler. In subgroup analyses all groups except for females and users 40 years of age or older had a statistically significant gain in knowledge after use of The Gambler (Table 4). Interesting trends in change scores existed between subgroups. For example, knowledge assessment scores for users with less than a bachelor’s degree actually improved more (10.5%) than scores for those with a bachelor’s degree or higher (6.1%), suggesting that the educational benefit of The Gambler might be more pronounced for subjects with a lower level of educational experience.
Our review of the literature did not find other studies examining the impact of utility assessment tools on patient education (Appendix B). Thus, in addition to eliciting utilities, The Gambler may serve as an educational adjunct to further support health communication as part of the shared decision-making process. Little work has been done to explore the use of exemplars in the health utility assessment process. 39 This is particularly important as we try to confront racial disparities in health care and health education.40,41 While efforts to combat racial disparities through technology are ongoing, there has been little research in this area in the clinical informatics literature.31,42,43
We used complications of a common health condition, DM, as our test case for The Gambler evaluation. In general, utilities we found for these health states were similar to those described in other studies.44,45 In addition, we found systematic differences in utilities assessed with different methods. In particular, we found that utilities for health states were generally higher with the SG than with the VAS or TTO.3,5,24,46,47 The holistic incorporation of risk attitude in SG assessments influences the utility assessment process. Thus, as most people are risk averse, SG assessments are higher because people are less willing to accept a risk of dying in the SG to avoid the intermediate health state.48–50 We also examined whether there were differences in median utilities for each health state across subgroups as has been described in other studies.51,52 Most dramatic differences were for SG assessments comparing users <40 years of age with users ≥40 years of age (see Appendix Table 1). Older respondents consistently rated all health states higher than younger respondents. This is consistent with other studies showing that older individuals are more risk averse. 53
We also found that users with lower educational attainment had lower SG utilities for all health states than their more highly educated peers, suggesting increased risk aversion compared with their more highly educated peers. This was statistically significant for the health states of diabetic neuropathy and retinopathy, but not for diabetic foot infection leading to need for transmetatarsal amputation. This is also consistent with other studies suggesting that more highly educated patients are generally more willing to accept risks to improve health. 54 While women consistently had higher SG utilities than men, suggesting a higher degree of risk aversion in women, this was only statistically significant for diabetic neuropathy. Similar trends have been noted in other studies.46,54–56
What are the implications of such differences in utilities and risk attitude across sociodemographic groups? Does risk attitude contribute to practice variation and the underutilization of appropriate health care services we sometimes see among women or underrepresented minorities? Indeed, other investigators have found that when faced with a risky medical procedure, such as carotid endarterectomy, Blacks would accept higher risks of stroke to avoid the risky and invasive procedure. 57 Such disparities may be compounded by potential biases triggered by inadvertent mismatching of demographic factors such as race, between patient actors seen in video clips describing health states and patients. 39
In our assessment of utilities for complications of DM, we assumed anchor states of well and dead to be the best and worst outcomes, and then assessed the utility of the diabetes complications, assuming they all had intermediate values falling between the absolute utilities (0 and 1) of these anchor states. Some patients may find certain health states to be worse than death. The Gambler is capable of using health states other than Dead as the anchor state for the worst outcome. However, if the investigator or clinician expected this might be the case for some of the health states being evaluated, they would need to develop a second version of the utility assessment project that used such a state as the anchor for the worst outcome.
Individual patient utilities can be used to inform shared decision making through the use of personalized decision analyses for a variety of clinical disorders.3,4,58–60 Most recently, we examined the feasibility of performing real-time utility assessments and personalized decision analyses to facilitate patient visits with their cardiologists to discuss anticoagulation options to prevent atrial fibrillation-related stroke. 59 One could envision a future in which many preference sensitive decisions are facilitated by such an approach.
The Gambler has limitations. While there is full support for direct utility assessment techniques, the software does not support use of indirect utility assessment methods such as European Quality of Life 5D (EuroQol) or the SF-6.61–64 These indirect methods map multidimensional measures of health status onto utilities, most often obtained through TTO assessments. When evaluating a tool such as The Gambler, it is difficult to separate usability and understandability of the software tool itself from understandability of the health state descriptions and the complexity of the clinical disorder being evaluated. In order to truly demonstrate that usability and understandability are generalizable across a wide range of clinical disorders and their relevant health states, a much more comprehensive evaluation would need to be performed. We chose a common disorder, DM, so users would not be confused or distracted by the complexity of the health states. We believe this provided results that were most representative of the software tool itself.
Conclusions
We demonstrated the feasibility of using The Gambler as an efficient means of collecting utilities. Users satisfied with their interactions found the tool easy to use and easy to understand. We found educational benefits as a positive side effect of the utility assessment process with The Gambler. The Gambler adds a powerful research tool to the armamentarium of health services and outcomes researchers. The Gambler can be a useful adjunct supporting real-time personalized decision analyses as part of shared decision-making approach to patient care.
Supplemental Material
GamblerHUAT_02262020_Appendix.rjf_online_supp – Supplemental material for Automated Tool for Health Utility Assessments: The Gambler II
Supplemental material, GamblerHUAT_02262020_Appendix.rjf_online_supp for Automated Tool for Health Utility Assessments: The Gambler II by Adeboye A. Adejare and Mark H. Eckman in MDM Policy & Practice
Footnotes
Acknowledgements
We would like to acknowledge Robert Ireton for technical support for The Gambler. We would also like to acknowledge the University of Cincinnati Department of Biomedical Informatics and Cincinnati Children’s Hospital Medical Center for technical resources.
The author(s) declared no potential conflicts of interest with respect to the research, authorship, and/or publication of this article.
The author(s) received no financial support for the research, authorship, and/or publication of this article.
References
Supplementary Material
Please find the following supplemental material available below.
For Open Access articles published under a Creative Commons License, all supplemental material carries the same license as the article it is associated with.
For non-Open Access articles published, all supplemental material carries a non-exclusive license, and permission requests for re-use of supplemental material or any part of supplemental material shall be sent directly to the copyright owner as specified in the copyright notice associated with the article.