
Abstract
The calculation of population health metrics plays an integral role in decision making for governmental policy makers and there is increasing demand for incorporating population health metrics into the decision making of integrated health systems.1–3 Population health metrics can serve to identify both successes and opportunities for targeted improvement; however, current reference life expectancy metrics do not take into account variation in geographies, populations, and disease states. We propose a new method for calculating a reference life expectancy metric that will incorporate this variation.
Among population health metrics most commonly used in policy decision making, including years of life lost due to premature mortality (PYLL), disability-adjusted life years (DALY), and health-adjusted life years (HALY), each use a reference life expectancy in their calculation. For example, PYLL compares observed life expectancy to a reference life expectancy that reflects a hypothetical age to which the individual would have lived had they not died prematurely. Current methods for estimating the reference life expectancy, and therefore for estimating PYLL, however, rely on assumptions that are potentially overly simplistic and likely inaccurate. In particular, common approaches for estimating reference life expectancy, such as those using current lifetables of mortality,4,5 the lowest death rate among countries,2,5–7 a fixed age value such as age 75 (age-75 truncation), 8 or creating a composite life expectancy based on the lowest observed death rate for each age group across countries,9,10 assume that any population’s life expectancy is, at most, equal to some life expectancy that is observed today. In addition, most of these approaches do not incorporate knowledge about a population’s leading causes of mortality nor the prevalence of the risk factors underlying these causes of mortality. Therefore, current calculation methods are limited in their application to diverse population types. For example, when determining PYLL due to a behavior (e.g., smoking) in a relatively healthy population versus an unhealthy one (e.g., a population of people with morbid obesity), it would be inappropriate to use the same reference life expectancy for both populations as the unhealthy population could not be expected to have the same life expectancy as a healthy one, regardless of smoking behavior. In this example, the use of the same reference life expectancy could lead to the underestimation of the impact of smoking in the unhealthy population due to competing mortality risks and may result in undervaluing the benefits of curbing this risk behavior. Therefore, when estimating population health metrics it is crucial to consider the underlying population characteristics that may act as competing risks for mortality such as comorbidities or underlying predispositions.
The imprecise estimation of PYLLs and DALYs is especially significant because these metrics are often used to determine resource allocation and health policy decision making. For example, the DALY, which combines PYLL with years lived with disability (YLD) to quantify the burden of disease, has served as the prominent measure in the World Health Organization’s Global Burden of Disease, since its introduction,11–13 and PYLL have been calculated employing age-75 truncation by Robert Wood Johnson’s County Health Rankings.8,14 Due to its use in high-impact public health projects, population health metrics, and consequently the methods for the calculation of a reference life expectancy, can have a significant impact on decision making and resource allocation.
By creating estimates that are statistically replicable, consider competing causes of mortality, and can be tailored to a population’s particular characteristics, mathematical simulations hold the potential to improve the estimation of reference life expectancies, and therefore PYLL and other population health metrics. In this way, a mathematical model can ultimately be a useful tool in setting health target priorities. To this end, our objective is to address the question: What could be the reference life expectancy in the United States in the idealized scenario in which modifiable risk factors (e.g., smoking, unhealthy diet) were eliminated and adherence to evidence-based therapies was perfect?
Methods
We sought to develop a mathematical model that could be used to estimate a reference life expectancy that can be used calculate population health metrics across various populations. This proposed reference life expectancy for the United States is reflected in an idealized scenario where public health goals are achieved by eliminating modifiable risk factors (e.g., smoking, unhealthy diet) and maximizing adherence to evidence-based therapies. We developed a Monte Carlo microsimulation model that simulates a cohort of hypothetical individuals where each individual is generated at initiation with an age, a gender, a set of mortality causing conditions (Table 1), and a set of risk factors (Table 2). He or she then goes through a virtual life in the model, developing new risk factors and/or new conditions, or having existing risk factors or conditions resolve, until he or she dies.
Top Mortality-Causing Conditions and Corresponding Model Mortality-Causing Conditions a

CDC, Centers for Disease Control and Prevention; ICD-10, International Classification of Diseases, 10th Revision.
ICD-10 codes represent the causes of mortality definitions used by the CDC.
Risk Factors Associated With Mortality-Causing Conditions

AUDIT-8, Alcohol Use Disorders Identification Test, Eighth Edition; BMI, body mass index; DSM-IV, Diagnostic and Statistical Manual of Mental Disorders, Fourth Edition; HPV, human papilloma virus; IV, intravenous; WHO, World Health Organization.
With 19 conditions, 27 risk factors, and the potential for treatment and screening, the model includes over 20,000 input values. To address this large quantity of data the model inputs are organized into arrays by condition, risk factor, screening/treatment, age, and sex (Figure 1). The number of parameters was chosen to ensure that the model was granular enough to have utility to measure the impact of top mortality causing conditions and changes in population epidemiologic characteristics, while maintaining model tractability. The simulation structure has been designed with flexibility in mind so that additional risk factors and/or mortality driving conditions can be added or removed as necessary based on a population’s characteristics. To assess the quality of a body of evidence regarding inputs, we used a synthesis of the Grading of Recommendations Assessment, Development and Evaluation (GRADE) guidelines for rating the quality of evidence 15 and the Agency for Healthcare Research and Quality level of evidence guidelines 16 to estimate the likelihood of causality regarding each risk factor/mortality and provided each with a grade of A, B, or C, with A representing the highest quality of evidence and C lowest quality of evidence used. When epidemiological or effect data were unavailable for specific age category, linear extrapolation from the nearest age group was used to determine the age-specific parameter. A complete explanation of the model and complete input tables are available in the Online Technical Appendix.

Excerpt from model input array.
Mortality-Causing Conditions
The model includes 19 conditions representing the top causes of mortality across age deciles that individuals could develop during their virtual life. Each condition has a probability of development, as well as an associated likelihood of mortality. The top causes of mortality were compiled from Centers for Disease Control and Prevention (CDC) tables of the top 10 causes of mortality by sex in each 10-year age group in the United States. 17 The final list of conditions was selected by merging the top 10 conditions for each age/sex group and identifying a superset that included all of these top conditions. That list was then narrowed down to exclude conditions that could not be readily simulated based on patient risk characteristics (i.e., septicemia and congenital malformations). These excluded conditions were accounted for in “other mortality.”“Other mortality” was defined as mortality resulting from anything other than the 19 conditions. As some mortality-causing conditions were difficult to distinguish from one another due to similar pathophysiology, and others were reported together but were distinguishable because of distinct pathophysiology and/or risk factors, the mortality-causing conditions represented in the simulation differed slightly from the CDC top causes of mortality (Table 1).
Risk factors
The model includes 27 risk factors that each modify the likelihood of developing associated conditions. Risk factors were selected if they had an effect size of less than RR 0.9 or at least RR 1.2 for at least one mortality-causing condition. These cutoffs were selected because it is widely regarded that associations of clinical significance in the range of 0.9 to 1.2 are too weak to be detected by epidemiologic study. 18 If a risk factor was included under this criterion, the association between that risk factor and all conditions was evaluated. The included risk factors were chosen if they had consistent direction of effect as well as clinical and statistical significance. Twenty-seven risk factors associated with the onset of the mortality-causing conditions are included in the model (Table 2). A low socioeconomic status risk factor was included that acted by considering the impact of socioeconomic status on mortality that is not a direct consequence of more prevalent unhealthful behaviors in lower socioeconomic populations. To avoid double counting, the variable was designed to account for the portion of low socioeconomic strata–associated mortality that is attenuated in more egalitarian countries, above and beyond what would be explained by the behavioral changes. 19
These risk factors do not necessarily represent an exhaustive list and in specific populations, or as additional evidence is found, additional risk factors may need to be added to the model. The model design has been developed specifically to allow for the incorporation of additional risk factors and condition as needed. Individuals were capable of developing any number of risk factors. Although in real individuals risk factors are often correlated, this simulation currently makes the simplification that risk factor development is not linked to other risk factors. A full description of the risk factor to condition pathways is available in the Online Technical Appendix.
Model Validation and Calibration
Prespecified validation tests were 1) ability of the simulation to predict life expectancy at age 15 for men, women, and all persons in the United States; 2) survival curves for men, women, and all persons as compared to the 2014 US life tables 20 ; and 3) and age-specific attributable mortality of each mortality causing condition for men, women, and all persons. 17 Validation was performed using visual inspection and through analysis of sum of squared errors (SSE), while acknowledging with regard to SSE that statistically significant deviations are not always clinically significant deviations. 21 To calibrate the model to the average life expectancy, a general mortality dial was implemented for individuals over age 35. This dial decreased the overall mortality rate in the population and affected all conditions proportionally.
Hypothetical Population
We constructed hypothetical populations using the 2014 US national prevalences of age, gender, mortality-causing conditions, and risk factors. When specific 2014 estimates were not available (which was the case for most conditions and risk factors), the most recent prevalence was used. All simulation life expectancies reported are a life expectancy at birth; however, the simulation focused on individuals aged 15 years or older because risk factor and condition data were typically not available for persons below this age, and because the contribution of mortality at ages 1 to 14 years to life expectancy in developed countries is extremely small (<0.5%).22,23 Details of model inputs have been provided in the Online Technical Appendix.
Idealized Health Scenario
In order to determine an upper bound for life expectancy that could be interpreted as a maximum for possible population health in an idealized scenario, we simulated a birth cohort at age 15 of one million patients with characteristics resembling the population of the United States. Unlike baseline simulations, however, modifiable risk factors were eliminated and adherence to evidence-based therapies and cancer screenings was assumed to be perfect. Modifiable risk factors were defined as those that an individual and/or health system has potential to attenuate or eradicate (e.g., high cholesterol, smoking, and obesity), and nonmodifiable risk factors were defined as those that may not be attenuated or eradicated within the scope of patient behaviors or health systems (e.g., family history and BRCA1/2).
Assessing Performance Compared to Established Reference Life Expectancies
After determining the average US life expectancy based on what could be achieved in an idealized scenario, we sought to compare the model-generated life expectancy to commonly used reference life expectancies (Table 3). To do this, as an example we selected three of most common causes of mortality in the United States among all peoples age 15 to 80 years in 2014 according to the CDC (accidents, cancers, and diseases of the heart). We then calculated PYLL stratified by race and sex using the 2014 CDC mortality statistics of the number of individuals that died at each age from each of the three conditions. 24 We calculated the total number of PYLL using the model generated reference life expectancy estimate, age-75 truncation, maximum observed life expectancy, and World Health Organization (WHO) guidelines.
Simulation Output and Commonly Used Reference Life Expectancy Measures

Results
Model Validation
The model predicted a life expectancy of 78.83 years (81.30 years for females, 76.49 years for males) for the general US population. These estimates closely mirror the 2014 life expectancy observed in the United States (78.74 years for the general population, 81.20 years for females, and 76.40 years for males). The survival curves generated by the model also closely reflect the current survival curve observed in the United States (Figure 2). Condition-specific mortality estimations also performed well upon visual inspection and with SSE mortality was a good fit; however, condition prevalence performed less well. Fit is described further in the Online Technical Appendix.
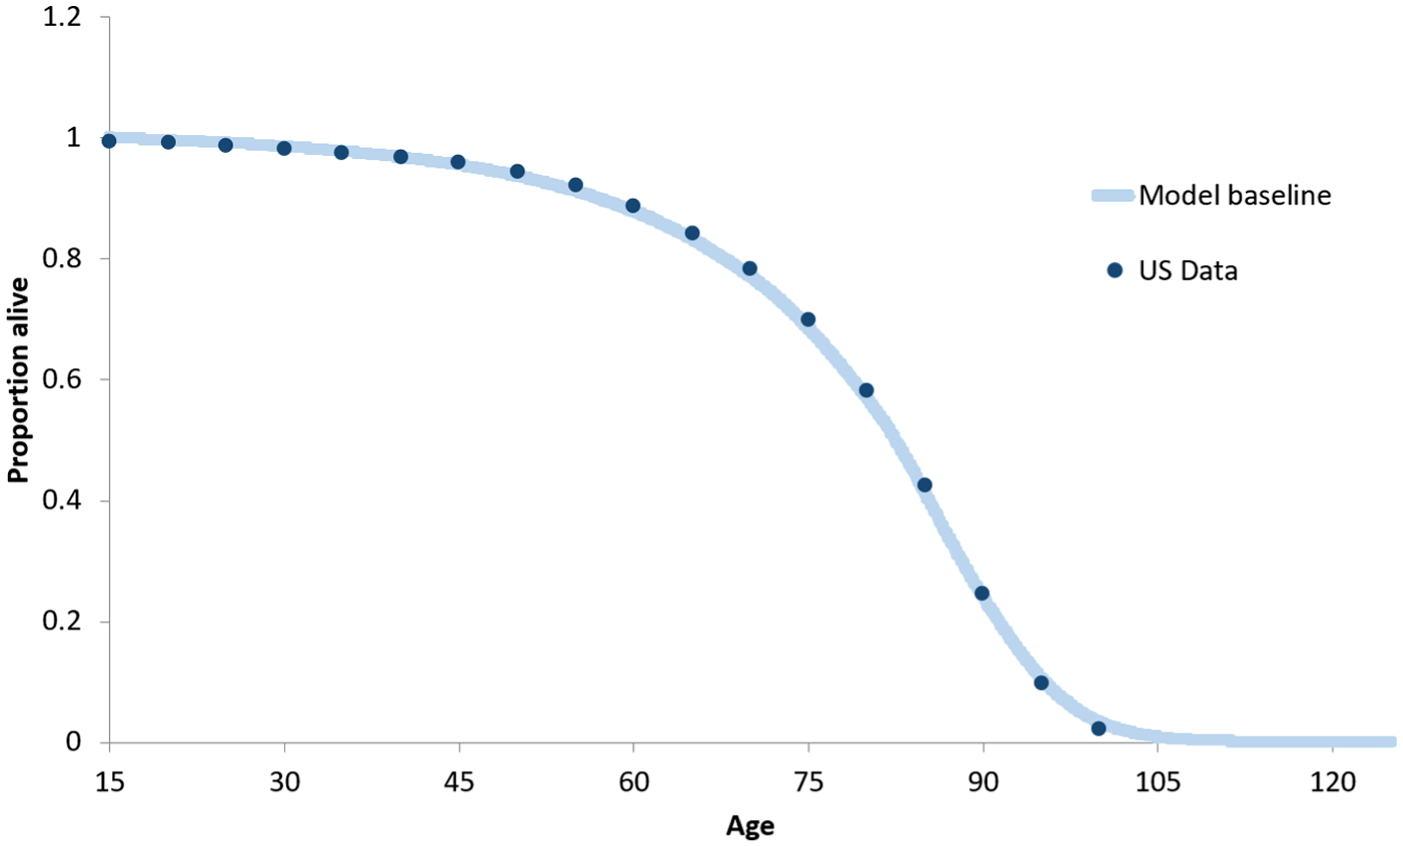
2014 US and model survival curves.
Estimated Life Expectancy
In the idealized scenario, in which modifiable risk factors were eliminated and adherence to evidence-based therapies was perfect, the average life expectancy in the United States would be 84.7 years (an increase of 5.9 years over 78.8 years from USA life tables) (Table 3). While the estimated life expectancy for women remained higher overall than for men, the life expectancy for men increased more than for women, increasing from 76.5 years to 82.5 years (a 6-year increase), while the life expectancy for women increased from 81.3 years to 86.8 years (a 5.5-year increase) (Table 3).
Population Survival
Under the idealized scenario, the change in the proportion of individuals living past a particular age compared to baseline was greatest in the highest age range of survival over age 85 years. In the idealized scenario, the proportion of men surviving past ages 65, 75, and 85 increased from 79.7%, 63.1%, and 34.8% to 87.2%, 76.0%, and 52.8%, respectively. The proportion of women surviving past ages 65, 75, and 85 increased from 86.9%, 74.1%, and 48.3% to 91.9%, 83.8%, and 64.9%, respectively.
PYLL by Reference Life Expectancy
The idealized reference life expectancy measure affected the total number of PYLL attributable to each condition (Figure 3a). When examining the proportion of total PYLL from these three example conditions, the model LE and the commonly used reference life expectancies each estimate a different proportion of PYLL for each condition, as well as predict different proportions of PYLL within populations (Figure 3b). The difference in the proportion of PYLL attributable to accidents between the WHO reference life expectancy and the age-75 truncation proportions ranged from 10.9% in White to 7.1% in Native Americas males and from 10.0% in Native American to 6.4% in Asian women. The differences in the proportion of PYLL attributable to cancer between the WHO reference life expectancy and the age-75 truncation proportions ranged from 4.3% in Native American to 7.1% in White males and from 2.3% in Asian to 6.3% in Native American women. The differences in the proportion of PYLL attributable to diseases of the heart between the WHO reference life expectancy and the age-75 truncation proportions ranged from 2.8% in Native American to 3.9% in White males and from 6.3% in Black to 4.0% in Asian women (Figure 3b).

Years life lost from three top causes of mortality using various life expectancy standards by sex and race, United States 2014. (A) Number of PYLL per 100,000 people and (B) as a proportion of total PYLL
Discussion
A reference life expectancy is a key component in the calculation of metrics that are often used to assess disease burden and target resource allocation. Using a Monte Carlo microsimulation model we were able to replicate life expectancy and condition mortality rates, as well as predict the life expectancy achievable in the United States under current population characteristics in an idealized scenario. Our model predicts that the idealized average life expectancy in the United States given current state of health science and technology is 84.7 years, an increase of 5.9 years above current life expectancy. This simulation-based, idealized life expectancy estimate can be used as a reference life expectancy in the calculation of population health metrics such as PYLL. This method of calculating a reference life expectancy can be particularly useful when examining health metrics between different populations that have varying underlying risk profiles as this simulation takes into account competing mortality risks.
The selection of a reference life expectancy can be very important as different reference life expectancy measures can lead to different conclusions. Estimates of PYLL based on the simulation’s idealized reference life expectancy contrast substantially with estimates of PYLL based on commonly used reference life expectancy approaches. Women have 70% greater PYLL using the idealized reference life expectancy compared to age-75 truncation, whereas men have 40% greater PYLL using the idealized reference life expectancy compared to age-75 truncation. Accordingly, the age-75 truncated method used to estimate PYLL may vastly underestimate the quantity of PYLL for many conditions overall, as well as may underestimate the relative PYLL of women compared to men (Figure 3a). Consequently, the selection of a reference life expectancy can have a large impact on resource allocation decision making because the relative health impact of a condition and thus its prioritization will change depending on the reference life expectancy used. For example, using the age-75 truncation method places a greater emphasis on accidents as a contributor to PYLL because accident deaths can and do occur at younger ages, while longer reference life expectancies place a greater emphasis toward more late occurring causes of mortality such as cancer or diseases of the heart (Figure 3b). While this artifact could potentially be adjusted for, the presence of a differential magnitude of impact between different subgroups indicates that without incorporating population specific characteristics and competing mortality risks, we cannot accurately determine a reference life expectancy.
PYLL are not only applied to a general US population, but are often applied to subpopulations for which the 75-year or an even longer life expectancy is not possible or true, as the fixed value does not take into consideration the comorbidities and risk factors associated with that subpopulation, such as in opioid drug users who often have associated risk factors (e.g., smoking, drinking, hepatitis) that significantly reduce baseline life expectancy. Similarly, our estimate is higher than the life expectancy from the lowest death rate country, Japan (83.3 years),2,5–7,25 indicating that using the life expectancy from other countries may also underestimate the reference life expectancy. Assuming the model output represents the true potential life expectancy in the United States, using the Global Burden of Disease reference life expectancy would underestimate the female life expectancy, but overestimate the male life expectancy. Conversely, using the country with the greatest life expectancy would overestimate the female life expectancy and underestimate the male life expectancy. Furthermore, using the country-specific life table would underestimate the reference life expectancy for both sexes. These discrepancies influence not only the number of PYLL attributable to a condition (Figure 3a) but also alters the proportion of PYLL attributable to a condition relative to other causes of mortality (Figure 3b). Additionally, the differences between the life expectancies do not affect all subgroups equally (Figure 3a and b). 24 These differences can have serious indications for policy making and emphasize the importance of developing a population-specific measure of life expectancy.
Our predicted idealized reference life expectancy is higher than other methods, with the exception of the WHO Global Burden of Disease approach. Additionally, the predicted idealized reference life expectancy far exceeds the 75-year-old default estimate commonly used in the United States, thus reinforcing that using the use of arbitrary numbers (e.g., 75 years-old) or life tables to estimate a reference life expectancy likely underestimates the average burden of disease in the United States.
Other investigators have sought to determine the potential life expectancy for developed countries, and notably, our prediction of an idealized US life expectancy is very similar to the cohort-based projection life expectancy of 85.5 years (male 82.5 years, female 88.6 years) for Germany in 2050 performed by Bomsdorf 26 and the probabilistic projection for developed countries developed by Olshansky and colleagues (overall 85 years, male 82 years, female 88 years). 27 The similarity between our simulation’s estimate and the estimates of others provides support for the validity of the simulation’s estimation. The unique feature of our simulation, which takes into account competing risks for mortality, however, sets our method apart from others as it can observe in a dynamic way the impact of decreasing the prevalence of a mortality-causing condition or associated risk factor. The model structure, which incorporates the impact of a risk factor on multiple mortality causing conditions and accounts for the competing risks resulting from other risk factors and conditions creates a more precise estimate of what occurs in real life than previous models that look at risk factors and treatment effects on overall mortality. While it is important not to overgeneralize the estimates generated by this analysis beyond the United States because population differences and risk factors for mortality-causing conditions may be distinct, the simulation modeling approach described here is likely to yield comparably accurate country-specific estimates when incorporating country-specific data.
Our work has several applications. First, it not only has the potential to distinguish between geographic regions or health systems with better and worse health, but can be used to assess how far away a particular geographic region or health system is from perfect health. It can address the question, “How far do we still have to go?” in addition to the question, “How are we doing compared to others?” In this respect, it offers what we view as a methodological advance beyond commonly employed approaches, such as used by Institute for Health Metrics and Evaluation (IHME), which chooses arbitrary anchor points for maximum population health. IHME calculates PYLL using the lowest observed age-specific mortality rates by location and sex across all estimation years from locations with total populations greater than 5 million in 2016 to establish a theoretical minimum risk reference life table, which are self-evidently not maxima since they are empirically observed in contexts where no maximization has occurred. 28 Second, extensions of our approach may be used within large integrated health systems to assess whether the health of their clients is improving over time, and whether that health is converging toward maximum population health or, while improving, remains distant from that goal. Third, because our work seeks to quantify distinctions in absolute health, it could potentially be used as the basis for a health-based criterion for reimbursement for health systems (e.g., based on changes in QALY expectations over time in a cohort of patients) rather than a volume-based reimbursement. In the US and UK contexts, value-based purchasing efforts (e.g., attempting to add quality of care, and by inference, health; into the reimbursement algorithms) have largely failed. 29 As a result, any new ideas that may advance the movement toward a health-based rather than volume-based reimbursement schedule may have transformative potential (say, e.g., a “Health Value Unit” rather than a “Resource-Based Relative Value Unit”). Finally, our approach may facilitate allocative efficiency analyses among health systems, where budget constraints may be considered explicitly and alternative resource allocations may be evaluated for their health impact.
The use of population-specific reference idealized life expectancy estimates has the potential to disaggregate the burden of a disease from the impact of underdevelopment that cannot be attenuated or eradicated within the scope of patient behaviors or health system performance. Anand and Hanson have argued that metrics, such as DALYs, being derived from measurements from wealthy countries, consequently measure the “burden of disease and underdevelopment, and not that of disease alone” in developing countries. 30 The use of a population-specific idealized life expectancy simulation can isolate the impact of risk factor and condition reduction in the context of other population characteristics. In addition, this approach can be modified as new knowledge is discovered regarding modifiable risk factors and treatments for leading causes of mortality.
Limitations
Our study has several limitations. First, this model only considered the top causes of mortality and may therefore underestimate the impact of risk factor reduction on life expectancy. Second, a limited number of risk factors were included in the model. Therefore, the presented simulation estimates do not to apply to persons with conditions or risk factors that confer substantial mortality above and beyond background mortality and mortality from mortality-causing conditions (e.g., Huntington’s disease carriers). However, the structure of the model is designed so that it is flexible and capable of accommodating additional risk factors or conditions if found to have a significant influence on mortality in a population. Additionally, risk factors are represented independently in the model; however, in real individuals, risk factors are often correlated (e.g., obesity with hyperlipidemia and hypertension) and future model iterations will incorporate correlation data from real patient populations. Not including correlation between risk factors likely distributes risk factors more evenly throughout the population than would otherwise be observed. Therefore, there are likely to be fewer very unhealthy individuals resulting in fewer deaths at younger ages, which may result in an underestimation of overall life gained in the idealized health scenario. This underestimation may also result in diminished impact when removing or acquiring an individual risk factor. Third, it is likely not coincidental that the life expectancy estimates generated by this model for the United States are approached by US counties with the highest life expectancies, including Marin County, California, where women have a life expectancy of 85.5 years, 31 and Fairfax County, Virginia, where men have a life expectancy of 82.4 years. 32 While this simulation takes into account a socioeconomic status variable that affects baseline mortality, as socioeconomic status is represented by a single risk factor, the simulation does not distinguish between health improvements that can be achieved through better health care and health improvements that are downstream effects of social circumstances that are more favorable for health. Fourth, the simulation does not consider the impact of perinatal and childhood mortality on life expectancy; however, the contribution of this mortality to life expectancy in developed countries is extremely small (<0.5%).22,23 Fifth, as elucidated by Christensen et al., in aging populations improving quality of life and the prevalence of disability can begin to have a greater impact than extending life by years alone. 33 Therefore, when examining population health metrics, the ability to calculate items such as QALYs is necessary. As with all reference life expectancies used to calculate PYLL, quality of life and disability are not currently incorporated into this particular analysis; however, the structure of the model allows for the use of health utilities and can be used in future analyses to assess QALYs gained. Finally, similar to other estimation approaches for health metrics, this model is only as good as the data that go into it. Finally, not all parameters had equally high quality of evidence and availability of epidemiological and effect data were occasionally inconsistent, particularly in regard to specific age groups and year of data collection. The direction of the bias introduced based on data availability is uncertain; however, sensitivity analyses demonstrated that narrowing the inputs to those with only the highest quality evidence resulted in a decrease in the overall health gain in the idealized scenario.
Conclusion
This mathematical model is able to accurately predict the life expectancy of the US population and an idealized life expectancy in which modifiable risks are eliminated and adherence to therapies is perfect given the current state of health science and technology. The use of mathematical simulations such as this one can be used to estimate a more accurate reference life expectancy among a population that can be used to better inform the estimation of population-specific health metrics and improve efforts to target population health priorities.
Supplemental Material
DS_10.1177_2381468318814769 – Supplemental material for An Alternative Mathematical Modeling Approach to Estimating a Reference Life Expectancy
Supplemental material, DS_10.1177_2381468318814769 for An Alternative Mathematical Modeling Approach to Estimating a Reference Life Expectancy by Elizabeth R. Stevens, Qinlian Zhou, Glen B. Taksler, Kimberly A. Nucifora, Marc Gourevitch and R. Scott Braithwaite in MDM Policy & Practice
Footnotes
The author(s) declared no potential conflicts of interest with respect to the research, authorship, and/or publication of this article.
The author(s) disclosed receipt of the following financial support for the research, authorship, and/or publication of this article: This study was funded in part by Kaiser Permanente Southern California and the New York University School of Medicine Department of Population Health. The funders had no role in the design of the study and collection, analysis, and interpretation of data or writing of the manuscript.
Authors’ Note
The summary of data inputs supporting the conclusions of this article are included within the article and its additional file.
Author Contributions
ERS conceived the project, contributed to model design, performed data analysis, and participated in manuscript preparation. QZ contributed to model design, performed data analysis, and participated in manuscript preparation. KAN contributed to model design, performed data analysis, and participated in manuscript preparation. GBT performed data analysis and participated in manuscript preparation. MG performed data analysis and participated in manuscript preparation. RSB conceived the project, contributed to model design, performed data analysis, and participated in manuscript preparation.
Supplemental Material
References
Supplementary Material
Please find the following supplemental material available below.
For Open Access articles published under a Creative Commons License, all supplemental material carries the same license as the article it is associated with.
For non-Open Access articles published, all supplemental material carries a non-exclusive license, and permission requests for re-use of supplemental material or any part of supplemental material shall be sent directly to the copyright owner as specified in the copyright notice associated with the article.