
Abstract
The World Health Organization (WHO) has announced the goal of achieving an AIDS-free generation by 2030. 1 Multilevel interventions are particularly useful to manage multiple risk factors facing high-risk people living with HIV/AIDS (PLWHA). 2 Through behavioral modification, risk behaviors associated with HIV progression and further transmission can be mitigated. There are an estimated 2.1 million PLWHA in India, and a multilevel intervention is being considered for implementation and/or further study. 3 The goal of the multilevel intervention is to reduce risks among alcohol-using HIV+ individuals on antiretroviral therapy (ART).
Multilevel interventions, which combine several single-focused interventions, are increasingly utilized in HIV prevention and care.4–6 Interventions targeting risk factors such as drug nonadherence, sexual risk-taking, or depression have been developed and can reduce the risk of HIV progression and transmission through improved patient outcomes.7–12 Single-focused interventions may have been evaluated individually but not collectively, raising programmatic questions about their feasibility, effectiveness, scalability cost, and value, when combined. Ideally, implementation decisions would be based on evidence supported by randomized controlled trials or other studies. However, studying the vast array of permutations of a multilevel intervention is not financially or operationally possible. A decision analysis can project the health and economic outcomes of multilevel interventions under consideration for further study and/or implementation and therefore potentially identify optimal permutations of alternative multilevel intervention designs.13,14
However, in addition to traditional measures of expected value, stakeholders often have constraints that cannot be easily incorporated within a decision analysis framework, such as short-term budget constraints due to near-term financial shortfalls. Therefore, the option with the highest expected value may not be affordable to a health system, thus affecting the options under consideration. Furthermore, decision makers may be risk averse, preferring to have a high level of certainty regarding effectiveness and benefit-to-harm prior to dissemination. Organizational decision makers not only may want to maximize average expected value but may also prefer a higher likelihood that an option is efficient, even if the magnitude of health benefit is smaller than the average. 15 Risk information can potentially be a valuable resource to decision makers that are investing in new research projects with many alternatives to choose from.
Based on the stakeholder constraints described above, we sought to optimize a multilevel intervention design for HIV-infected persons in Maharashtra, India, under three scenarios: 1) no constraint (“maximize expected value”), 2) the combination must maximize expected value within short-term budget constraints (“maximize expected value with an annual intervention cost constraint”), and 3) the combinations must maximize expected value with a preference of a high likelihood that it is efficient relative to alternatives (“maximize expected value for a risk-averse stakeholder”).
Methods
Overview
For the purpose of this article, constituent intervention refers to a single-focused intervention addressing an HIV risk factor such as motivational interviewing targeting unhealthy alcohol use or cognitive behavioral therapy targeting depression. Multilevel intervention refers to two or more constituent interventions in combination, and different permutations of these constituent interventions that would result in different configurations of the multilevel intervention. We examined different ways the constituents could be configured to achieve optimal outcomes based on our three scenarios (maximize expected value, maximize expected value with an intervention cost constraint, and maximize expected value for a risk-averse stakeholder). To perform this constrained optimization, we utilized a decision analytic model and applied successive constraints (financial or risk) to evaluate the best choice in each scenario.
Decision Model
We developed a decision analytic model for the Indian state of Maharashtra that was adapted from a previous HIV simulation model developed for East Africa (Figure 1). The simulation describes HIV progression and transmission dynamics at a population level. Further details describing the progenitor model, including development, parameterization, and calibration, can be found elsewhere.16,17 We revised the model with updated input data from Maharashtra that came from an electronic medical record (EMR) data analysis or published literature. We then calibrated the HIV progression component of the model (“progression module”) to patient-level survival, time to viral failure, and CD4 response data from medical records of Indian HIV patients or published literature. 18 We calibrated the transmission component of the model (“transmission module”) to population-level HIV incidence, prevalence, death, and number of people on treatment based on published data from UNAIDS estimates for India. 19 Additional details of model development and calibration are listed in the technical appendix (available in the online version of the article). Outcomes of interest included number of HIV transmissions, costs of treatment and care, and quality-adjusted life years (QALYs) within a simulated population of Maharashtra in the next 20 years. We chose a 20-year time horizon because it allowed us to more fully evaluate the long-term implications of the interventions on secondary HIV transmission, and we have found that 20 years is the longest time horizon viewed as credible by most stakeholders. All results were presented at the population level, and we did not allow for partial funding of programs such that the entire target population was assumed to receive all interventions if that package was selected.
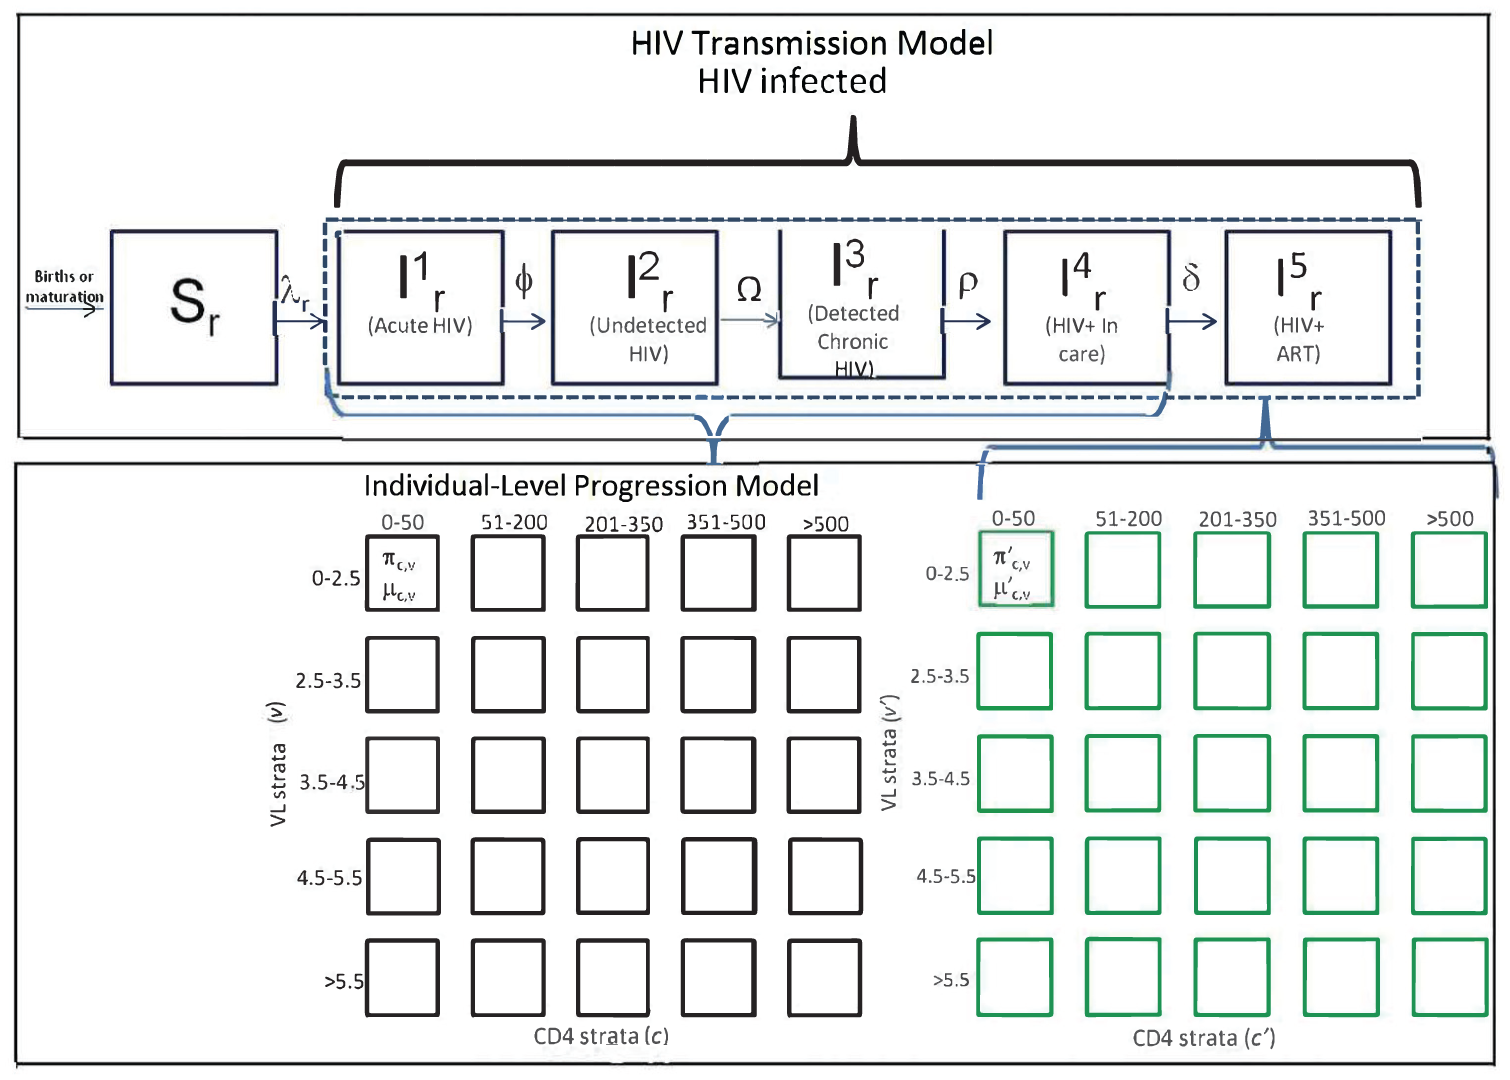
Simulation structure and dynamics. In order to simulate interventions that had individual patient benefits and population benefits, this analysis involved an individual-level microsimulation combined with a compartmental dynamic transmission model. Further details of the simulation calculations and logic can be found in the technical appendix.
Input Parameters
Model inputs and their uncertainty distribution are listed in Tables 1 and technical appendix Table S4. There were four categories of inputs in this simulation model: intervention-related inputs (costs and effectiveness), HIV progression, HIV transmission, and HIV risk behavior inputs. Two main sources were used to estimate inputs or to derive calibration data: state-level EMR data from Maharashtra collected from HIV clinics from 2007 to 2014 (n = 23,701) and literature reviews. The EMR data provided individual-level characteristics for the progression model including CD4 count trajectory over time, survival, and the distribution of individual-level covariates that altered HIV progression. Other risk factors relationships including sexual risk-taking and adherence to ART were derived from the published literature (technical appendix Table S4).
Intervention Inputs

STI, sexually transmitted infection.
Range based on 95% confidence interval reported in published reviews.
Annual cost per person in 2016 US dollars based on labor and pragmatic costs estimates; average time to deliver intervention was derived from published reviews or assumed based on expert opinion.
Constituent Interventions
Constituent interventions were identified from the published literature. The two primary goals of the multilevel intervention are to reduce ART nonadherence and to reduce the risk of HIV transmission. The multilevel intervention could be composed using possible components of individual or group alcohol counseling, individual or group depression counseling, individual or group or community sexual risk intervention, brief adherence counseling, or short-message service (SMS) adherence support (Table 1). Additional description of the constituent interventions is listed in the technical appendix.
Multilevel Intervention Costs and Effectiveness
We abstracted constituent intervention effectiveness data from the individual studies reported in five systematic reviews of randomized trials. Table 1 lists cost and effectiveness of the constituent interventions, along with their sources. We estimated the effectiveness of longer or brief interventions by pooling the results of individual trials that studied long or brief versions of the same intervention. In the simulation, some constituent interventions predominantly addressed patient-level risks, while others predominantly addressed HIV transmission risks. We assumed that two interventions addressing the same risk did not have additive effects and used the higher effect size if they were both bundled together. However, we included the cost of both interventions to the total package cost. This particular assumption was made in order to deliberately bias the analysis toward being conservative (i.e., underestimating rather than overestimating the effect of interventions in combination).
We estimated constituent intervention cost data from the same studies. If time data were published, we used the total time required for the behavioral interventions and hourly counselor wage in India to calculate the cost of labor. We increased the labor costs to account for program administration costs based on a WHO report of average HIV program costs. 20 We derived uncertainty distributions from published data when available or used a uniform distribution over a range informed by expert opinion if data were not sufficient. Programmatic staff from India provided insights when assumptions regarding intervention costs were needed. The total time of the individual and group constituents was a function of the number of risk factors addressed. For example, the individual component could focus on alcohol use, depression, and nonadherence, but it would increase the time (and cost) to address all three. Additionally, the cost was dependent on whether an intervention was brief (e.g., alcohol motivational interview for 60 minutes) or long (e.g., alcohol motivational interview for 240 minutes).
Analytical Approach
We compared multilevel interventions for a population of HIV+ males on ART that misuse alcohol in Maharashtra. Based on the combinations of 15 constituent interventions, we iterated 5,836 possible alternative configurations for the multilevel intervention, ranging from single interventions to nine interventions combined together. Long and brief versions of the same intervention would not logically be combined. We used Monte Carlo simulation to draw parameters from prespecified uncertainty distributions during probabilistic analyses (PA). We used a health system payer perspective and discounted cost and QALY outcomes at a 3% discount rate based on WHO recommendations. 21
Identifying Optimal Choices
Using probabilistic results, we constructed efficiency frontiers based on the expected value of each option and then calculated the probability of being on the efficiency frontier (PEF) using individual iterations of the PA. An efficiency frontier is plotted relative to the option with the lowest average incremental cost-effectiveness ratio (origin). From the origin, subsequent alternatives are categorized as efficient, dominated, or extendedly dominated until all options have been categorized. The options that are efficient form a frontier that reflects the most efficient options in order of increasing ICER. Options that are dominated or extendedly dominated would not be considered for investment based on economic attributes alone. Through this process, the most efficient interventions can be selected with diminished health benefits as the ICER increases. We used the efficiency frontier technique outlined in Hunink et al and encourage interested readers to reference this book for more details on its calculation. 13 The PEF was calculated by deriving a new efficiency frontier for each iteration of a PA and tracking the number of times that a configuration was on the efficiency frontier, an approach that has been previously reported. 22 Through this approach, we determined the probability that a given package was efficient relative to alternative packages.
Stakeholder Scenario 1: Maximize Expected Value
Some stakeholders would make a choice based on efficiency and expected value alone. The most valuable configuration to study would maximize ENMB at a plausible value of willingness-to-pay (WTP) threshold.23,24 WHO guidance previously suggested approximately three times the GDP of a country as a threshold, which was US$4,746 for India in 2014. 25 While this threshold rule has been challenged in recent years, the few alternative approaches to decision making have limitations of their own. 12 Since the WTP threshold is unknown in India and cannot easily be estimated by looking at past budget-constrained decisions, the old WHO WTP threshold guidance served as a reasonable starting point for decision making. We used WTP thresholds of $5,000/QALY and $15,000/QALY (2016 US dollars) to reflect two potential values for the WTP threshold. The net monetary benefit was calculated using the formula below and the ENMB was the average NMB across the PA iterations.

Stakeholder Scenario 2: Maximize Expected Value with a Program Cost Constraint
While maximizing expected value is the ultimate health system goal and every budget should correspond to a societal WTP threshold, unexpected financial constraints in the short term may result in unplanned deviations from resource distributions made in accordance with that WTP threshold. Correspondingly, for the purpose of this article, the “budget” represents the real and often unanticipated constraint faced by program managers who seek to implement programs, and may be different from the stated “WTP threshold,” which under perfectly efficient circumstances and longer term horizons would be reflective of the overall health budget. Note that, in a perfectly efficient system, it would not be necessary to specify both budget and WTP threshold because the value of one would imply the value of the other. However, we choose deliberately to distinguish between the two, because changes in budget may occur over the short term in unpredictable ways, particularly in specific sectors (e.g., foreign aid might unexpectedly stop), whereas a change in the WTP threshold would lag behind. To consider the constraints “on the ground” including shorter term decision making and coexisting short-term budget limitations, the optimal options were evaluated when annual program costs were constrained at $200,000 and $400,000, estimated based on the sizes of other simultaneous programmatic budget constraints of the same ministry.
Stakeholder Scenario 3: Maximize Expected Value for a Risk-Averse Stakeholder
Risk-averse organizational decision makers could choose to forego some expected value for a lower risk option over a higher risk option. 15 We specified a heuristic that is a possible expression of risk-aversion: choosing a program with a high likelihood of being efficient is preferred to choosing a program with a lower likelihood of being efficient, even if the alternative program has greater expected value (i.e., greater expected health benefit per incremental cost, during PA). We chose this heuristic in full appreciation of its limitations: a risk-averse entity might prefer a program with 99% likelihood of some benefit (albeit a benefit not as great as one corresponding to the efficient frontier) to a program with <99% likelihood of being on the efficient frontier, even if it has greater benefit, as it is possible that the optimal program for a particular risk attitude is not on the efficient frontier. That being said, our heuristic has the desirable effect of using the efficient frontier as a “lens” through which to focus on a tractable subset of the 5000+ interventions with the capability of delivering the greatest value.
To communicate risk and uncertainty, a PEF was used instead of the traditional CEAC (cost-effectiveness acceptability curve).23,26 While the CEAC plots the probability of an option being the most cost-effective option at a specific WTP threshold, it cannot distinguish between alternatives with different variance in their outcomes (i.e., different joint distributions of incremental costs and effectiveness). 26 Two alternatives can have the same CEAC if they have the same proportion of their incremental joint distributions above and below a given WTP threshold even if they each have vastly different outcome uncertainty. The PEF uses the incremental joint distribution directly in its calculation, since a new frontier was constructed for each iteration of the PA. This approach reflects the probability that an option will be efficient relative to alternatives. While each organizational decision maker may have a different level of risk tolerance, we used an arbitrary threshold that an option must appear on the efficiency frontier >50% of the time to evaluate the impact of this constraint on the optimal choice. We additionally report the probability of efficiency for each option, so that decision makers could use other values if desired.
Results
The analyses yielded configurations with contrasts in affordability, outcomes, and risks. The optimal choice depended on which stakeholder constraints were employed. Full results are listed in Table 2, but are discussed by the three scenarios. Of the initial 5,836 configurations, 22 were dominant over the remaining configurations because they were both more effective (higher population-level QALYs) at lower costs than the other configurations. The analytical procedures that yielded this result are described in greater detail in the technical appendix.
Health and Economic Outcomes of Top Configurations Arranged in Ascending 1-Year Program Costs

Adh, adherence; Alc, alcohol; B, brief; G, group; I, individual; L, long; QALY, quality-adjusted life year; Sex, sexual-risk; SMS, weekly text-messages.
Expected net monetary benefit (ENMB)—Option with the highest ENMB is in bold.
Willingness-to-pay threshold.
Stakeholder Scenario 1: Maximize Expected Value
Five configurations were on the efficiency frontier and were cost-saving compared to standard care. Stakeholders may consider one these five configurations as possible candidates, but need a precise WTP threshold since the optimal option was dependent on it (Table 1). The optimal configuration of a multilevel intervention at a WTP threshold of $15,000/QALY consisted of long individual alcohol counseling, individual weekly text-message support, long sex-risk group counseling, and long individual counseling for sex-risk (annual cost = $428,886; PEF ∼27%). The optimal configuration of a multilevel intervention at a WTP threshold of $5,000/QALY consisted of long individual alcohol counseling, individual weekly text-message support, and long sex-risk group counseling (annual cost = $241,476; PEF ∼48%).
Stakeholder Scenario 2: Maximize Expected Value Within a Program Cost Constraint
Assuming an annual intervention cost constraint of $200,000 (Figure 2A), the combination that maximized ENMB consisted of long individual alcohol counseling, individual weekly text-message support, and brief sex-risk group counseling (annual cost = $187,335; PEF ∼54%). Assuming an annual intervention cost constraint of $400,000 (Figure 2B), the combination that maximized ENMB included long individual alcohol counseling, individual weekly text-message adherence support, brief group counseling for sex-risk, and long individual counseling for sex-risk (annual cost = $374,745; PEF ∼4%), an option that was extendedly dominated in the unconstrained scenario (Figure 2C).

Optimal options considering programmatic budget constraints. (A) The optimal options with a 1-year program cost below $200,000. If a funder perceived uncertainty in future health care budgets, they may impose a restriction on what to study based on annual program costs. (B) The optimal options with 1-year program cost below $400,000. A constraint on annual spending is a manifestation of an implicitly high discount rate. It may be driven in part by uncertainty in future sources of financing. (C) Under no cost constraint, all five options are considered. These five configurations were the most efficient, but each had different programmatic costs and probability of being most efficient. Decision analysis eliminated 5,815 of the 5,836 options, leaving 22 choices to consider.
Stakeholder Scenario 3: Maximize Expected Value with Risk Aversion
Decision makers could impose any level of risk and choose an alternative based on the expected value in conjunction with risk. In the last scenario, the risk tolerance of decision makers was considered (Figure 3A and B). The top choice, assuming the requirement that an option has >50% chance of being on the efficiency frontier, was a combination that included long individual alcohol counseling, individual weekly text-message support, and brief sex-risk group counseling (annual cost = $187,335; PEF ∼54%). The risk of being off the efficiency frontier rose along with the number or intensity of constituents across our analyses (Figure 3B). This finding suggested that more intensive options had diminishing health returns at greater risk of inefficiency, thus requiring a tradeoff to be made between expected value and probability of efficiency.

Optimal options considering a risk-averse decision maker. (A) The optimal options with a constraint of having at least a 50% chance of being on the efficiency frontier would leave two of the five options. (B) Decision makers may have alternative levels of risk requirements, so presenting the risk along with the expected value can make the tradeoff between more extensive intervention packages and risk of inefficiency relative to less intense intervention packages more explicit.
Discussion
We evaluated alternative designs of a multilevel behavioral HIV intervention by systematically evaluating long-term health and economic outcomes, narrowing the number of permutations under consideration from 5,836 to 22 options. We estimated the annual program costs, PEF, and ENMB. Of the final choices, the configuration with the highest PEF differed from the most affordable configuration by about $50,000 per year and differed from the configuration with the most health benefits by 671 QALYs.
The efficiency frontier shows five alternatives that could be valuable to implement and/or designate for future study with the sole goal of maximized expected value (Figure 3B). As would be expected, the option that maximized ENMB changed between WTP thresholds of $5,000/QALY and $15,000/QALY. Thus, in cases where a WTP threshold is not well established, additional attributes of interventions should be considered to make appropriate funding decisions about further research or implementations. One consideration is the annual budget constraints of the health system to implement the interventions. Decision makers may choose to impose a limit on annual programmatic costs. Imposing a limit led to the optimal option to include long individual alcohol counseling, individual weekly text-message adherence support, brief group counseling for sex-risk, and long individual counseling for sex-risk, an option that was off the unconstrained efficiency frontier.
A second consideration could be the risk of choosing an option that is not the efficient choice. A notable insight of our analyses is that the expected value could only be improved by allowing substantial uncertainty of efficiency relative to alternatives, a situation unlikely to be acceptable to risk-averse decision makers. In particular, as the length or number of sexual risk reduction constituents increased, the uncertainty of efficiency also increased. This finding was consistent across our analyses, suggesting that a risk-averse research stakeholder could favor a multilevel intervention with a single brief sexual-risk counseling constituent rather than an intervention with multiple or long sexual-risk counseling constituents. The probability of efficiency can be displayed along with expected value to give research stakeholders a more transparent understanding of the decisions they are making. The presentation of this information emphasized the explicit tradeoff between incremental increases in expected value with increased risk of inefficiency to guide conversations about how thorough and exhaustive the final intervention combination should be.
Limitations
As with any model, the input data and model structure can have unknown biases or imperfections. We extensively calibrated our simulation using epidemic and surveillance data and conducted a probabilistic sensitivity analysis to limit the bias introduced by uncertainties. Additionally, there could have been synergies or redundancies when two interventions targeting the same risk factor were combined. We made the simplifying assumption that two or more interventions targeting the same risk had the effect size of the most effective intervention, and we did not consider synergies or redundancies in the base case analysis. But it is important to note that our model may be used even if particular known synergies or redundancies are incorporated into the analysis. To demonstrate this fact, we conducted a deterministic sensitivity analysis where intervention effect sizes were added when two interventions targeting the same risk were paired. The results of this scenario analysis are in the technical appendix. In contrast to the MAX assumption when two interventions targeted the same risk factor, if two interventions targeted the same outcome through different risk factors, their effects were assumed to be additive, and we did not consider any synergies or redundancies. However, we also explored these possibilities in sensitivity analyses (technical appendix Figures S5 and S6).
A third limitation was that evidence about intervention effectiveness came from outside of India, and the evidence had a varying degree of generalizability to the target population. The direction of bias introduced by lack of generalizability remains unknown. To mitigate this risk, we predominantly relied on randomized trial data to inform the intervention effectiveness inputs. Additionally, expert opinion was needed to make reasonable assumptions for some parameters. The uncertainty distributions were based on the best available information, but bias in the inputs could affect the final results in an unknown direction. Related to this point, while a value of information analysis would be a natural extension of our proposed work because it is unknown a priori whether additional research would be desired prior to investing in the optimal multilevel intervention, we decided not to perform this analysis because the organization would mandate new evidence prior to implementation regardless of our estimated value of information. This is heightened by concerns of the propriety of generalizing evidence to Maharashtra and/or of numerically representing the underlying uncertainty with sufficient accuracy. An important limitation of our study is that we do not consider a full array of possible constituents in our multifaceted intervention, such as PrEP, which may have substantial implications for HIV prevention.
In conclusion, to aid multilevel intervention design decisions, we identified the optimal configuration of a multilevel intervention while considering potential stakeholder constraints. By considering intervention risks and benefit tradeoffs in advance of a study, the resulting intervention has a higher chance of health system adoption and acceptance after the trial. This type of systematic evaluation could improve the efficiency of the research process and provide insights for transparent discussion of the risks-benefits when research teams are faced with a staggering number of options.
Supplemental Material
MDM_PP_Technical_Appendix_online_supp – Supplemental material for Evaluating Alternative Designs of a Multilevel HIV Intervention in Maharashtra, India: The Impact of Stakeholder Constraints
Supplemental material, MDM_PP_Technical_Appendix_online_supp for Evaluating Alternative Designs of a Multilevel HIV Intervention in Maharashtra, India: The Impact of Stakeholder Constraints by Anik R. Patel, Kelly V. Ruggles, Kimberly Nucifora, Qinlian Zhou, Stephen Schensul, Jean Schensul, Kendall Bryant and R. Scott Braithwaite in MDM Policy & Practice
Footnotes
Acknowledgements
We thank Mark Roberts for feedback and input with this work.
The following author is employed by the sponsor: Kendall Bryant. The other authors have not conflicts of interest to disclose.
Financial support for this study was provided by a grant from the National Institutes of Health under Grant # U01AA021990-01. The funding agreement ensured the authors’ independence in designing the study, interpreting the data, writing, and publishing the report. Dr. Patel was supported in part by the Canadian HIV Trials Network and by the National Institutes of Health under Grant Numbers R01MH0975589-01 and U01AA021990-01.
References
Supplementary Material
Please find the following supplemental material available below.
For Open Access articles published under a Creative Commons License, all supplemental material carries the same license as the article it is associated with.
For non-Open Access articles published, all supplemental material carries a non-exclusive license, and permission requests for re-use of supplemental material or any part of supplemental material shall be sent directly to the copyright owner as specified in the copyright notice associated with the article.