
Abstract
In recent years, preference-based health-related quality-of-life (HrQoL) measurement of specific diseases has advanced, largely in response to concerns that traditional generic measures may not detect domains of importance in these circumstances. Examples of newer tools include the Diabetes Utility Index (DUI), the Patient-Oriented Prostate Utility Scale (PORPUS),1,2 and a menopause-specific HrQoL instrument, 3 among others. This trend in measurement remains controversial, both in terms of the acceptability of the quality-adjusted life years (QALYs) generated, as well as best modeling methods. 4 Measurement of HrQoL was for many years done with separate traditions—either psychometric profiles or preference-based indexes. With the introduction of the SF-6D index from the SF-36 and SF-12 profiles,5,6 the intersections of these methods have become relevant and continue to develop. 4
Disease-specific data are of interest when different treatments for the same disease are being compared, or when HrQoL rather than life expectancy (less commonly) is the primary outcome. Such measurement may be of value in oncology, where illness severity and treatment may be profound and HrQoL, rather than life expectancy, may be cost-effectively enhanced. Still, disease-specific instruments come with the caution of potential failure to capture comorbidities and may exaggerate the importance of some problems, as noted by the Panel on Cost-effectiveness in Health and Medicine (PCEHM). 7
There is a call for the field to focus more on the value of its treatments, given the continued acceleration of expense for oncology outcomes obtained.8–10 With the above in mind, it seems reasonable to consider the costs and HrQoL of the most common and deadly neoplasms. Lung cancer is of great concern, given its status as the greatest killer of all the cancers, 11 and disease-specific data may inform our search for more cost-effective care. A generic index such as the EQ-5D, HUI3, or SF-6D does not have items of importance in this disease, such as cough, shortness of breath, nausea and appetite loss, or fatigue6,12,13; thus, evaluations of treatment differences or other studies of HrQoL may be less sensitive. The existing lung cancer–specific indexes converted a subset of items from the non–preference-based Functional Assessment of Cancer Therapy–Lung (FACT-L) instrument, 14 but do not address patient or US population preferences. Two versions have been developed—one based on the UK population and the other a Dutch population, both using societal samples and the same subset of items.15,16 The UK index’s validity was questioned in the literature, 17 and some modifications were made in the Dutch version. We feel that to better compare treatments, a version using patient preferences is justified, and US-based preferences are of interest. To this end, we embarked on the selection of items and modeling techniques for a patient-centered FACT-L Utility Index (FACT-LUI).
The prior and current PCEHM has indicated that utility indexes should reflect societal preferences, since society funds and benefits from health care. 7 Nonetheless, many studies on preferences are still done reflecting the patient perspective, the DUI and PORPUS being examples. Furthermore, the emphasis on societal preferences can conflict with the objectives of patient-centered care. It can also be argued that the more disease-specific HrQoL information becomes, the more difficult it is for someone inexperienced with a disease to provide meaningful preferences. The PCEHM recently modified prior recommendations, now accepting patient preferences as useful either as ancillary information or allowing their primary use in certain scenarios where patient preferences represent a best informed social judgment. 7
Methods
Population of Interest
We interviewed patients with non–small cell lung cancer (NSCLC), due to its prevalence (85% of lung cancers) and longer survival than small cell cancer (SCLC). 18 The majority of participants were expected to have advanced-stage (III-IV) disease, approximating the proportion seen in the usual lung cancer population. 19 Stage was delineated by the treating clinician based on clinical exam, history, pathology, and imaging. 20 Patients at any point in treatment were eligible, all temporal perspectives assumed as being equally important. All eligible patients in our Thoracic Oncology service were approached for participation unless the oncologist did not feel they could participate, or they were not able to read and communicate in English. Accrual of patient data took place from 2015 to early 2017.
Development of the FACT-LUI Classification
We chose the FACT-L over the European Organization for Research and Treatment of Cancer (EORTC) surveys 21 due to more concise treatment of some domains, and a larger response set per item (five levels in FACT v. four in EORTC). Concerning conciseness, the EORTC classification has multiple domains with two to three items (dyspnea, pain, cough), which are more difficult to model than single items per domain as the FACT-L has. Such aspects in the FACT-L facilitate structural independence (defined below in the next section), which is critical in applying multiattribute utility theory (MAUT). 22 MAUT is the extension of von-Neumann-Morgenstern expected utility theory to situations where there is more than one argument or attribute (or domain). Within this framework, multiple attributes or domains are aggregated with three forms of utility functions: linear additive, multiplicative, or the rarely used multilinear. 13 Details are provided in the section on MAUT below.
Selection of Items
Existing generic utility indexes cover pain, physical aspects, and psychological aspects with some instruments also covering social aspects included with psychological aspects. 23 These observations and other literature were strongly considered in FACT-LUI development. Chen and colleagues, 24 in a review, noted that the number of symptom clusters in lung cancer varied from one to four with great variability among studies, but dyspnea and cough among other respiratory symptoms were seen, and nausea and vomiting were noted in multiple studies. Iyer and colleagues found that a loss of appetite, cough, pain, and dyspnea were most predictive of quality of life in advanced disease. 25 Furthermore, Yang and colleagues found that fatigue, pain, dyspnea, appetite loss, and coughing were important in long-term survivors with quality of life decreases. 26 Henoch and colleagues studied 400 late-stage, inoperable patients with multiple instruments and statistical methods. This work showed clusters for pain/nausea/appetite loss/bowel issues/fatigue, mood/insomnia/concentration, and respiratory symptoms (breathing/cough). 27
To have an instrument inclusive of overall HrQoL, we took generic and symptom aspects into consideration along with the input of two thoracic oncologist collaborators and a survey scientist. We chose the parsimonious “within the skin” approach of the Health Utilities Index (HUI), where social aspects are not included.28,29 Thus, only aspects of health that originate within the patient are considered. As shown in Figure 1, the content of eight FACT-G and FACT-L items was used. Any level of function in one attribute should be conceivable without regard to others. 13 A set of attributes/domains lacking this structural independence cannot generate plausible corner states. Such states are used in MAUT-based models to obtain domain weights; a corner state is a domain or attribute valued at its worst with other attributes assumed normal.2,13 Such independence removes the need for direct valuations of thousands of states. We combined nausea from FACT-G and appetite loss from FACT-L into an item (nausea and/or appetite loss), since a nonsensical health corner state results where nausea is severe but appetite is normal; thus, there were seven total items in the FACT-LUI.

Domains of health in chosen subset of Functional Assessment of Cancer Therapy–General (FACT-G) and Functional Assessment of Cancer Therapy–Lung (FACT-L) items. Nausea and appetite were combined into one item due to structural independence issues for the multiattribute utility theory (MAUT) -based model (“I have nausea and/or appetite loss”). All FACT items have a 5- level response set (not at all, a little bit, somewhat, quite a bit, very much) and a 1 week recall period. Items are stated as “I have. . .”, “I feel. . . .” or “I worry. . .”.
Modeling With Multiattribute Utility Theory or Value Theory (MAUT/MAVT)
We considered the usual techniques of multiple regression, which is the most commonly used,6,12 along with MAUT. Other techniques, such as Discrete Choice, have a shorter history in valuation of utility indexes, but are being increasingly used in national studies and international studies, also incorporating Bayesian methods.30,31 We wished to use a method that has a long history of reasonable performance 32 and ease of implementation in variably sick patients, given the already controversial nature of disease-specific indexes. Among the widely used indexes in general, there have been issues with ceiling and floor effects using regression, and MAUT has a closer link with expected utility theory. Therefore, we chose MAUT for this work, and as has been done by many others for generic and disease-specific applications,1,2,13,33 use of a Visual Analog Scale (VAS) was complemented by transformation to Standard Gamble (SG).
The “person mean” approach was used where one model is generated by the mean values from survey groups for each relevant variable, instead of individual MAUT-based functions. 13 Valuations for levels of function within a MAUT/MAVT attribute/domain are usually done with a VAS, 34 described below. Weighting of each domain/attribute is typically obtained by subjects who value VAS corner states.2,13 VAS and SG values are also obtained for selected marker states. Markers are used for later regression through the origin to derive a transformation of overall model VAS variables to SG variables. 13 MAUT-based models serve to aggregate the domain values to a summary utility score, usually with additive or multiplicative-weighted structure.13,35 If the derived domain weights (referred to as kj in Equations 1 and 2 on a 0 to 1.0 scale) add up to 1.0, an additive model is satisfied (Equation 1). The global constant (K) is used in multiplicative models where kj do not add up to 1 (Equatiion 2). It scales a model between 0 and 1.0.

where
Equation (2) often fits experimental data.2,13 Preferences not constructed from standard gamble (e.g., VAS) use MAVT. MAUT and MAVT, however, use the same formalism for multiplicative or additive functions.33,36


uj(xj) is the single attribute/domain utility function for an attribute (j), where 0 is the worst morbidity value possible, and 1.0 is the best. U(x) reflects overall summary utility. The single attribute function reflects utility/value attached to each of the intermediate levels of an attribute/domain on a 0 to 1.0 scale. π represents multiplication through all attributes j = 1 through n.13,37 Equation (2B) facilitates the iterative calculation of K once the mean kj are known.13,38 In health modeling, a “disutility” model is usually applied, where the absence of morbidity is equal to 0 on the utility scale and 1.0 is equal to the worst health state (the opposite of utility; Equation 3). Our description of a corner state above indicates a disutility model, which is more realistic than the opposite case where all domains but one are assumed at their worst.

Disutility assumptions have been utilized in developing multiple indexes.2,13 In such models, the kj weight for each attribute/domain is equal to its corner state 13 ; in a disutility corner state, all other domains are at zero disutility and drop out, leaving the corner state kj.
We used an approach that has been cited for deriving domain weights and the global constant K.
39
One VAS corner state (fatigue) and ratio importance weights for all domains were obtained to minimize burden, instead of directly obtaining all VAS corner states. Our VAS had conceptual “Full Health” and “Dead” or “Full Health” and “Worst Possible Health State” scale anchors, depending on each patient’s preferred natural scale,
13
as explained below. Using

and the other domain weights are derived; thus,

All mean VAS measurements were entered in the model as disutilities. Mean kj weights were calculated for all participants in a group, followed by the iterative K calculation. Conversion of the model back to utility was done as in Equation (3).
Survey Groups and Tasks for a MAUT Model
To further minimize respondent burden in variably ill patients, modeling tasks were randomized among three groups. All patients were interviewed over the telephone by the same research assistant. Recruitment of patients was initiated in the thoracic oncology clinic with the oncologists’ permission. Patients were provided a packet with study information and surveys (including typical VAS feeling thermometers 34 and SG visual aids—discussed below) that were approved by the institutional human subjects committee (# 2014P002045). Patients who agreed were contacted later outside of the clinic setting. Prior to valuation tasks, patients considered all FACT-LUI items at their worst possible level at the same time (the “Pits” state as named by the HUI group 13 ) for “the rest of a patient’s life.” Patients could choose this state as being worse than dead, equal to dead, or better than dead. If the first choice was taken, it defined a Subgroup “A” in each survey (a 0 = Worst Possible Health State to 1 = Full Health natural scale). If either of the two latter choices were chosen, a natural scale of 0 = dead and 1 = full health was implied; thus Group “B” in each survey. Demographic differences (Table 1) were evaluated between Groups A and B using chi-square, Student’s t, or Mann-Whitney U tests. In all surveys, a concluding section had a VAS for current health on the patient’s natural scale (“Thinking about the past week, how would you rate your quality of life using the feeling thermometer?”), FACT-LUI items for patients’ own health (1 week recall), two numeracy and three literacy items as in Table 1,40,41 one item on years of education, and two items on racial/ethnic background. Overall MAUT-based assessments are summarized in Figure 2 and below.
Demographics of FACT-LUI Development Sample

FACT-LUI, Functional Assessment of Cancer Therapy Lung Utility Index; IQR, interquartile range.
Patients viewing “Pits” (worse possible FACT-LUI health state) as worse than Dead.
Patients viewing “Pits” as equal or better than Dead.
1 in 100, 1 in 1000, 1 in 10, or “don’t know.”
1%, 10%, 5%, or “don’t know.”
“Always” or “often.”
See text for details.

Steps for the Functional Assessment of Cancer Therapy–Lung Utility Index (FACT-LUI) model multiattribute value function (MAVF) and multiattribute utility function (MAUF). Each survey group is subdivided by patient natural scale with respect to the FACT-LUI health classification (all attributes at worst levels being valued as worse than dead - Group A, as opposed to equal or better than dead - Group B). Dead-FH, Dead to Full Health scale; Pits-FH, Pits to Full Health scale; PLT, positive linear transformation; SG, standard gamble; VAS, visual analog scale.
Group 1 Survey: Levels of Morbidity in Each Attribute/Domain
Each patient provided the VAS integer value of the three internal levels out of five in each FACT item, the top and bottom defaulting to 100 and 0 defined by one’s natural scale.2,42 When each level was valued, other domains were assumed normal. No ties were allowed between levels and all mean levels entered the model as disutilities.
Group 2 Survey: Domain Weights and Derivation of Pits Value
Each patient gave his/her least important domain (item) 10 points, the other domains point values relative to 10 in importance (Equations 4 and 5), and valued one VAS corner state (fatigue). Ties were allowed for domain points. The upper scale anchor was at 1.0, assuming our domains likely cover overall HrQoL “within the skin.” In Group A, a VAS value for Dead was also obtained from patients where 0 was Pits. Subsequently, each Group A Pits value was linearly transformed to a negative value with dead at zero after Patrick and the HUI group.43,44 In Group B, a VAS value for Pits on a Dead to Full Health scale was obtained. Weighted means were used to derive the final Pits value. Pits values were weighted by the proportion of all patients in Groups A and B, once Group A data (Worst Possible Health State to Full Health scale) were transformed to Group B (Dead to Full Health scale). 44 The final Pits mean was used for rescaling Group A levels and domain weights to Group B, again followed by weighted means. Most patients selected Group B (Table 1).
Group 3 Survey: Marker State Valuations for Transformation of VAS to SG
We obtained three marker values with VAS and SG for regression through the origin as used by others to predict SG and transform the model.2,13 The markers progressed in severity with levels (L) indicated from the FACT response set: 1, not at all; 2, a little bit; 3, somewhat; 4, quite a bit; and 5, very much. Health state 1: fatigue, cough, dyspnea, anxiety, and pain at L2; nausea and/or appetite loss at L3; and depression at L1. Health state 2: fatigue, cough, dyspnea, nausea, and/or appetite loss, depression, and pain at L3; and anxiety at L2. Health state 3: fatigue, cough, dyspnea, and pain at L4; depression at L3; and anxiety, nausea, and/or appetite loss and pain at L5. The three health states were presented as multiattribute states valued first by VAS and then by SG, the latter using a self-completable titration SG method implemented by Brazier and colleagues. 45 Values for Dead and Pits with SG were obtained by Groups 3A (Worst possible to Full Health) and 3B (Dead to Full Health), respectively, with a weighted average value for Pits obtained on the Dead to Full Health scale. The VAS-SG transformation was modeled with two variants: a patients’ markers excluded if any two or more VAS markers or SG markers were valued equally and with no data excluded. We assessed whether the three VAS markers were significantly different from one another with the Friedman test, and assessed SG markers similarly.
We applied linear, power utility (SG = VASα) and power disutility (SG = 1 − (1 − VAS)α) models2,13 to the marker data. The choice of optimal model for linear regression through the origin was based on Eisenhauer, 46 where the square of the sample correlation between observed and predicted values as well as the standard errors of the regression models were compared, instead of inflated R2 values. For modeling, marker data from Group 3B were included as is, while Group 3A data were linearly transformed to the Group 3B scale, using the values for Pits and Dead from Group 3. A Group 4 Survey began late in the study as a potential subproject; however, few patients were enrolled (Table 1). These patients’ data for their own health (VAS and FACT-LUI items) were merged with the other groups.
Modeling a Utility Index With a Normalized Unweighted Scale
We created a summated, unweighted index version of the FACT-LUI to compare to direct utilities in two steps. First, a normalization method modified from Tomlinson et al. 2 (Equation 6) was used. Li is the response on a five-level response set per item. “4” reflects the number of possible responses per item minus 1. The value 7 in the equation refers to the number of FACT-LUI items. Second, a simple linear transformation provided the final index result relative to the Pits state on a Dead to Full Health scale.

As an example, using the normalization equation, if all items are “normal” or “1,” all summated terms are zero, so that 100/7 is multiplied by zero, and so zero is subtracted from 100, equaling 100, which is converted to 1.0 by multiplying by 0.01. Carrying through the Pits state where all items are 5, gives the opposite scale anchor, 0.
Our approach for an unweighted model is similar to Lamu et al. and their application of Han et al., as well as Prieto et al.47–49 They found that when a summated version of an index is normalized on a 0 to 1.0 scale and given a similar scale length to the weighted version by linear transformation, this unweighted scale indirectly reflects the tradeoffs between gains in quality and quantity of life of a utility scale. Both Lamu and Prieto had findings suggesting a lack of effect of preference weights in comparing to an unweighted equation (Equation 5). Furthermore, Parkin et al. and others have found that index domain weights can distort statistical properties in HrQoL comparisons between groups.50,51
Analysis of Agreement, Construct Validity, Sample Size, and Other Psychometrics
Agreement was based on patients’ direct VAS and SG utility compared with their MAUT-based or unweighted index values. Measures included Spearman correlations, mean difference (MD), mean absolute difference (MAD), and intraclass correlation (ICC), the latter using a two-way mixed model and absolute agreement. Furthermore, median bias between methods was estimated with mountain plots of the indexes compared to SG. Such plots are a folded cumulative empirical distribution that more easily show the central 95% of the difference data than a Bland-Altman plot, even when data are not normally distributed. 52
Additional psychometrics obtained included internal consistency of the FACT-LUI items (coefficient α) and loadings of the items versus EORTC items covering the same concepts by principal components and factor analysis. Because multiple EORTC domains have more than one item, a summed value of those items was used along with appropriate FACT-L items. The number of factors/components was confirmed with parallel analysis. Varimax rotation was planned with Kaiser normalization, since an index would be expected to have less correlation of components. We also calculated index values by quartile of SG and evaluated the significance of differences between quartiles with the Kruskal-Wallis test and Jonckheere-Terpstra trend test.
Response rate was calculated based on all patients approached to participate in the study. Index ceiling and floor effects were also assessed.
Initial evaluation of known groups validity involved comparison of index results in earlier stage (I and II) and later stage disease (III and IV) patients by tests of means or medians. From the index summary statistics, we suggested preliminary distribution-based Meaningful Important Difference (MID) values from 0.2 to 0.3 standard deviation (SD) values, given literature showing that for preference-based indexes, an MID estimate of 0.3 SD or smaller is reasonable and is an effect size. The value 0.5 SD, another frequently cited measure of effect size, can be thought of as a medium effect.53,54 In all study evaluations, P < 0.05 was significant unless multiple comparisons were relevant, where the Bonferroni correction was used. Analyses were performed with Excel 2016 (Microsoft Corporation, Redmond, Washington), MedCalc version 17.9.2 (MedCalc Software bvba, Ostend, Belgium; https://www.medcalc.org) and SPSS (IBM Corp, IBM SPSS Statistics for Windows, Version 20.0; Armonk, NY).
Our approach to sample size was based mainly on the prior work by the HUI Group and our own prior work.39,55 Such assumptions generally derive from comparisons of means, knowing what we expect in terms of minimal important differences and differences in groups. In our case, this meant (with α and β of 0.05 and 0.2, respectively) that we would assume an important difference in techniques (say in the paired case of direct v. indirect utilities) of 0.1 or less, and a standard deviation of about 0.2 in experienced patients. Thus, for example, if the SD is 0.2, then the 0.5 SD MID is 0.1 and 0.3 SD is 0.07. Needed sample would be about 34 to 66 patients per group (102–198 for total sample).
Results
Surveys were distributed to 343 patients and were completed by 239. After excluding ineligible patients (illness or incorrect diagnosis), 237 patients were included (Table 1). In the agreement statistics below, 236 gave complete data. Sixty-nine percent of patients had advanced-stage disease. Incompletes were minimal, with one Group 2 patient having no usable index data but some factor analytic data, and another with usable index data. There were no significant group differences in Table 1. As Table 1 shows, we had at least 54 per group, and the additional 27 Group 4 patients whose direct utility and FACT item endorsements were merged with the Groups 1 to 3 data gave the total of 237.
VAS to SG Transformation and Pits Utility
The linear model gave the best results for all analyses, based on correlation of real versus predicted SG values, residual standard deviation, and regression standard error. For example, the group with exclusions (n = 141 total SG and VAS markers) had a residual SD of 0.23 (less than half the other models) and correlation of real and predicted values for SG of r = 0.61 (P < 0.0001). The patient data indicated risk-seeking given their comments and that the median in all SG markers as a group was insignificantly less than overall VAS markers (0.64 v. 0.65, respectively, signed rank [Z: 1.56]). This trend is also present when comparing each marker VAS and SG mean/median value, except for the worst health state marker listed last below. The three VAS markers were significantly different from one another, as were SG markers (VAS medians: 0.85, 0.65, 0.25; SG medians: 0.72, 0.62, 0.46; P < 0.0001). The regression equation through the origin with exclusions was SG = 0.9853(VAS) and SG = 0.9302(VAS) with all data.
The weighted mean value for Pits on a Dead to Full Health scale was 0.12 and 0.11 for VAS and SG, respectively. This value was used for transforming VAS and SG versions of the index, Group A VAS/SG data to the Group B scale, and for adjusting the unweighted index scale length for agreement assessment. The directly obtained VAS and SG Pits utilities matched the regression equation from markers without exclusions.
MAUT-Based Model Results
In the survey groups, 79% of patients saw Pits as equal to or better than Dead (Group B). The MAUT model (Table 2) with transformed SG utilities or VAS values was multiplicative, with global constants (K) of −0.969 and −0.964, respectively.
Patient Multiattribute Disvalue and Disutility Functions: FACT-LUI
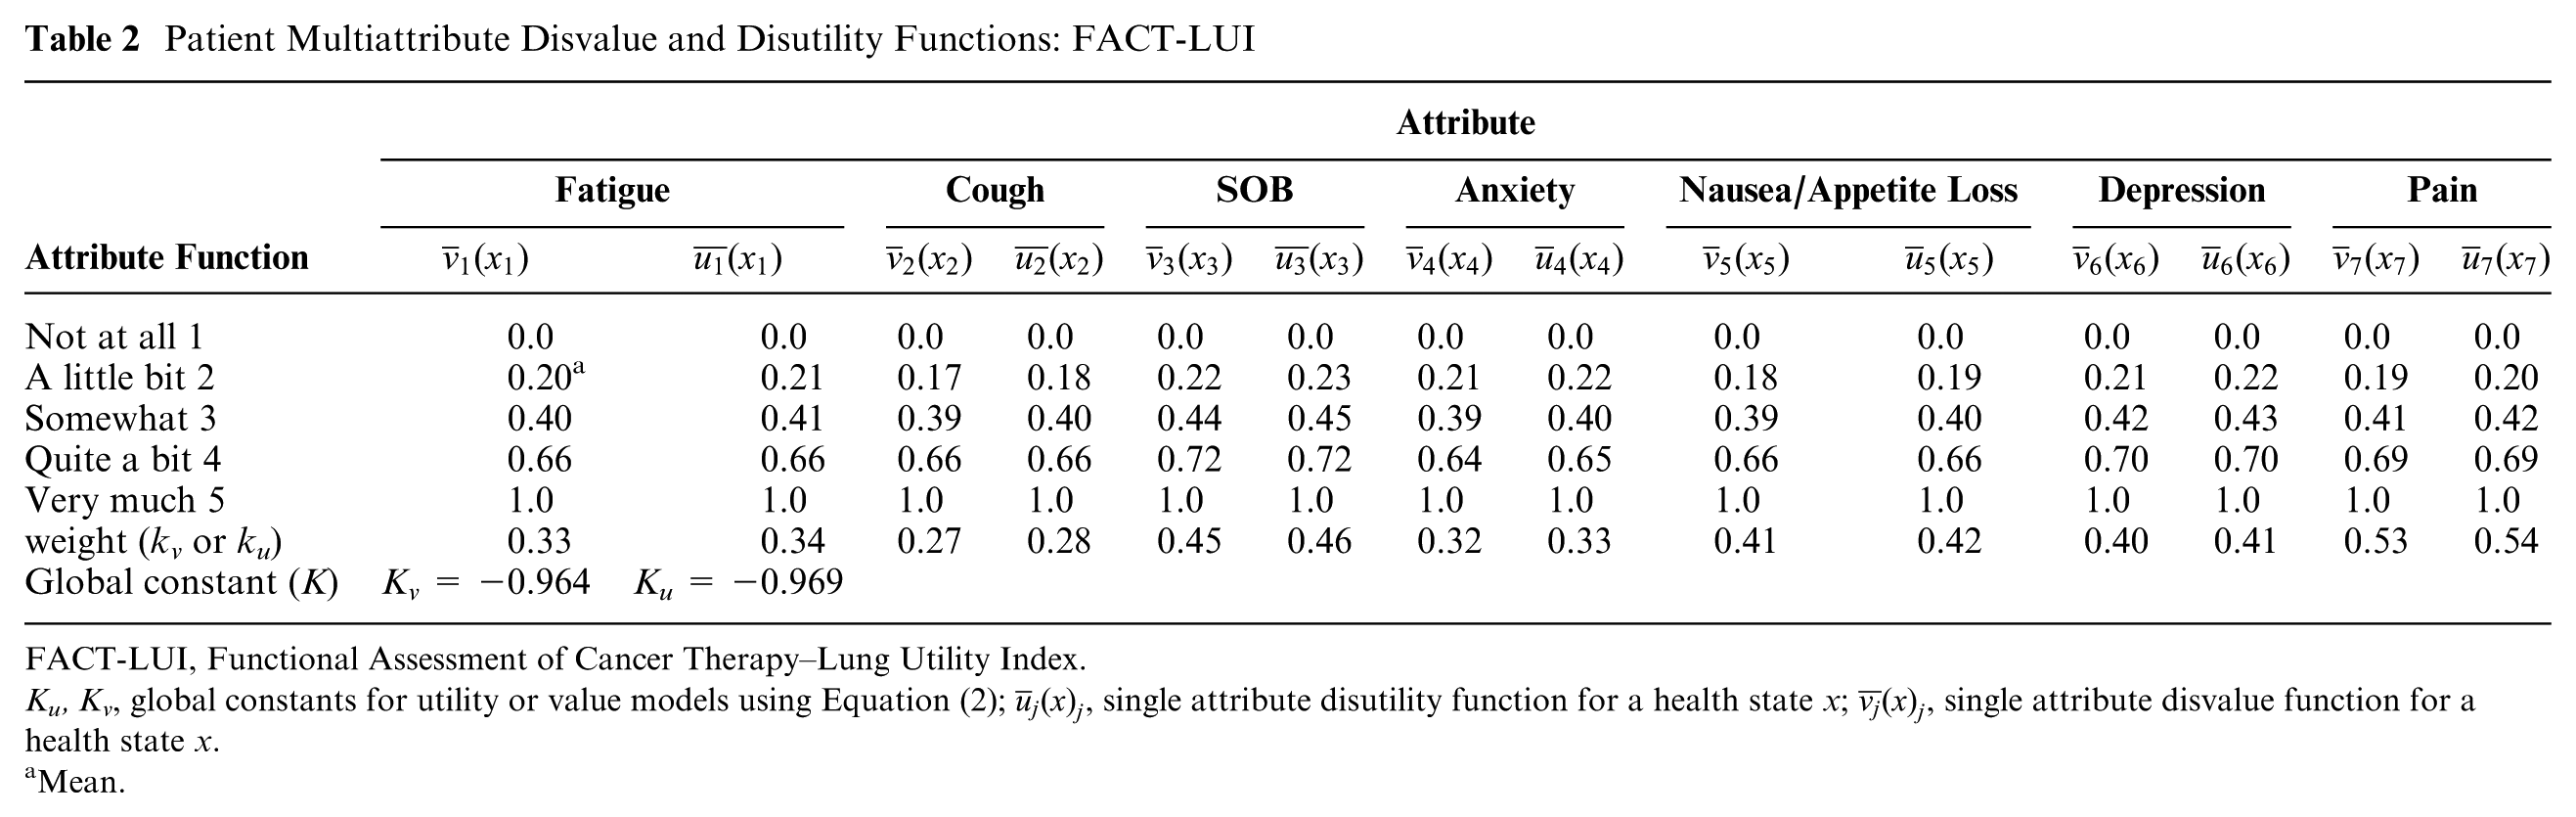
FACT-LUI, Functional Assessment of Cancer Therapy–Lung Utility Index.
Ku, Kv, global constants for utility or value models using Equation (2);
Mean.
Agreement and Construct Validity
Table 3 summarizes agreement between direct VAS and SG versus the usual weighted MAUT-based and unweighted indexes for current health. Relatively strong56,57 similar Spearman correlations were found in all comparisons. However, the MAUT-based weighted indexes using VAS or SG values showed MD, MAD, and ICC that were substantively worse than the unweighted index. Unweighted index agreement was reported where differences in scale length either were or were not adjusted for by a linear transformation of the unweighted version with the utility for Pits. The MAD between SG and the adjusted unweighted index was no different (0.09) whether the VAS to SG transformation of 0.9853 or 0.9302 was used; thus, the transformation was not sensitive to our criteria for data exclusion.
Agreement: Preference Weighted FACT-LUI-VAS and FACT-LUI-SG, Unweighted FACT-LUI-U versus Direct Utility (VAS and SG) Patients With Complete FACT-LUI and Direct Utility Data (n = 236)

CI, confidence interval; D-FH, Dead to Full Health scale; FACT, Functional Assessment of Cancer Therapy; ICC, intraclass correlation coefficient for same raters and absolute agreement; LUI, Lung Utility Index; MAD, mean absolute difference; MAUT, multiattribute utility theory; MAVT, multiattribute value theory; SG, Standard Gamble; VAS, Visual Analog Scale.
MAUT and MAVT models are highly correlated with the unweighted index (r and ρ = 0.97 and 0.99, respectively) and have Pits values (VAS and SG) on a D-FH scale from experiment as above.
Unweighted index value, normalized to 0 to 1.0 scale.
Normalized, unweighted index value with “Pits” at 0.11 for SG and 0.12 for VAS (Full Health at 1.0) from D-FH data by experiment.
P < 0.0001 with 95% CI (multiple comparisons [6] = 0.008).
Standard Gamble transformation by marker data showing SG = 0.9853(VAS).
Given these results, as a check on the adjusted unweighted index (Equation 6), we forced a similar model on our MAUT structure, thus an additive model and domains all having the same weight (by dividing 1.0 by 7), so that the K constant equals 0 (Equation 1). The resulting MAD and ICC values of the additive MAUT model were nearly equal to the adjusted unweighted index, at 0.09 and 0.61, respectively, suggesting the unweighted approach was robust.
Mountain plots showed marked differences when comparing SG to each index, with the adjusted unweighted index median bias near zero (Figure 3). Median bias with the additive MAUT model was negligible (0.004). Values of the weighted MAUT-based index by quartile of SG were significantly different from one another by trend and Kruskal-Wallis tests (P < 0.00001), as were similar assessments with the adjusted unweighted index.

Mountain plot of multiattribute utility theory (MAUT) -based index and unweighted index versus direct Standard Gamble (SG) transformed from the Visual Analog Scale. The unweighted index has a worst health state SG utility of 0.11 as does the MAUT-based index. The median bias for the MAUT-based index is 0.2 and median bias for the unweighted index is 0.02.
Construct validity assessment by comparison of early (n = 73) versus later stage (n = 163) patients showed similar significance comparing the MAUT-based or adjusted unweighted index (Table 4). Using 0.2 to 0.3 SD53,58 with all data as well as the early and late stage data in Table 4, the MID for the MAUT-based model is 0.04 to 0.06, with the adjusted unweighted index at 0.03 to 0.04. The mean difference between the actual early and late stage data with the MAUT and adjusted unweighted model was 0.08 and 0.05, respectively.
Early (I and II, n = 73) versus Advanced (III and IV, n = 163) NSCLC and Overall Utility

FACT, Functional Assessment of Cancer Therapy; NS, not significant; NSCLC, non–small cell lung cancer.
Listed P values are significant if P < 0.005 by Bonferroni correction.
FACT response set: 1-5.
Z-statistic, Mann Whitney U, corrected for ties.
Summated scale result of all FACT-LUI items, standardized to a 0 to 1.0 scale with Pits at 0.11 on a Dead = 0 to 1=Full health scale.
Additional Psychometrics
Coefficient α was 0.73 for the FACT-LUI items (raw and standardized). Alpha decreased with each item dropped. Analysis with principal components analysis (PCA) and principal axis factoring showed a similar four-factor/component solution for FACT-LUI and EORTC items as follows: fatigue and pain; anxiety and depression; cough and dyspnea; nausea/appetite loss. PCA loadings were from 0.5 to 0.9 with most 0.7 or greater, with some cross-loading for dyspnea between components 1 and 3. The four-component solution explained 71% to 77% of the variance depending on use of a Pearson correlation matrix versus a polychoric correlation matrix, respectively. Sixty percent variance explained is generally adequate. 59 There was a 4.7% ceiling effect for the index and no floor effect, in a sample that had a substantial number of later stage patients (163 out of 236).
Discussion
As was noted above, existing generic utility indexes cover pain, physical aspects, and psychological aspects with some instruments not covering social aspects that use MAUT for modeling. For the QALYs generated by a disease-specific index to be valid, these constructs should be covered, and the FACT-LUI would appear to do this as our results suggest, discussed below.
When selecting the modeling approach, best practices are debated,32,60 though multiple regression is the least obscure method. We utilized MAUT, which is applied in the widely used HUI2/3, 13 as well as prostate cancer 2 and diabetes 1 indexes. MAUT has its disadvantages, including a less statistical approach and conceptual or cognitive burden issues with corner states. Given the continued interest in utility index development from nonutility profiles, 4 Mortimer and Segal’s observation seems relevant—the most important factor might not be the modeling approach, but the coverage and sensitivity of the measures and the group being evaluated. 61 In any case, the multiplicity of approaches cannot help but continue bringing together the psychometric and utility approaches, which is likely to the benefit of modelers and patients as long as a desire to simplify as much as possible is kept in mind.
Our results suggest reasonable coverage of NSCLC-related morbidity and quality of life, given correlations of direct patient utilities with the endorsements of the FACT-LUI items and basic psychometrics. The FACT items loaded strongly with conceptually similar EORTC items, and the ceiling effect was well under 15%. 62 Measures of agreement favored an unweighted index, whether constructed with MAUT or not, and mountain plots showed minimal median bias for the adjusted unweighted index as opposed to the multiplicative MAUT function. Stage data showed significant mean differences beyond preliminary MID estimates. We note that the lower end of the range for MID in the adjusted unweighted index (0.03) is quoted as an MID for preference-based indexes.7,53
The direct utilities obtained from NSCLC patients were consistent with this population. There was adaptation reflected in VAS measurements, given the means (Table 4). Therefore, each of the known groups had a substantial number of patients with higher VAS and resulting SG values, such that even though the advanced disease group had more patients with lower utilities reflected in a lower median, there were near equal means between the groups. The other result was that VAS and SG trended in the opposite way to that usually seen 34 due to SG risk seeking, except for the worst marker state.7,63 Thus, there seemed to be a “meeting in the middle” of SG and VAS, with near equivalence by regression. VAS markers were still significantly different from one another as were the SG markers.
In the initial evaluation of an index, it is compared to direct utilities as a standard, even though the designation of which direct technique is the standard has been controversial. 7 In our case, given the population utilized for their preferences, a concern might be which measure is a standard—the direct measures with their adaptation and risk seeking, the MAUT person mean model with weights, or an unweighted index. The index models are all equivalently correlated (Spearman ρ) with direct utilities since all are differently scaled versions of the same data; thus, the focus returns to the direct utilities. The trends of the direct utilities were not surprising for lung cancer, but the stronger agreement between an unweighted index and direct utility is not clearly explained in terms of prior research. Our findings might be most linked with Prieto et al., 48 who, as noted by Parkin et al., 50 concludes the differences of relevance are those between respondents, as reflected in our known groups, and “weights make little difference to that.” We suspect the thought process is different for our patients than community members. Our results, at this early point, might suggest that patients do not think of a health state in a complex multiplicative or weighted manner, but more simply. Furthermore, the thought process of eliciting parts of the MAUT model by survey groups may bias patients toward choosing weights. Another contributor to agreement may be that the mean difference between direct utilities and the unweighted index compares largely individual data, while MAUT variables all derive from weighted means. An equivalent test of MAUT in this latter case would be comparing individual MAUT-based functions to direct utilities, but such an approach would require substantial patient burden for obtaining the variables. Finally, the adjusted unweighted index agreement may be related to shared aspects between summated scales and VAS in terms of their interval scale behavior. 64
The only variables based on weighted sample means in the otherwise unweighted approach (Equation 6) were the utilities for Pits and Dead. This calculation seems unavoidable from a measurement perspective; the value for Pits helps anchor the scale and reflects both the influence of those who viewed it as being equal or better than Dead as well as those finding it worse.
The demographic representativeness in the FACT-LUI values can be criticized in having mostly white patients, as such representativeness can be questioned in the original HUI or the SF-6D.13,65 Nevertheless, we had reasonable diversity in educational status, with 25% of our sample having high school education or less. Our numeracy results were likely consistent with the work of Lipkus et al., 40 who found when applying the same two items we used that 16% and 22% had incorrect answers in a more educated sample (6.4% to 15.6% high school or less).
Since an unweighted function could be obtained with group means for deriving the Pits value only, concerns about other diversity might be less problematic. Though we suspect this is a minor weakness, further work where the utility of Pits is evaluated in other patient groups would be informative if it varied substantively from our NSCLC utilities. We suspect that the index could probably be applied in SCLC, since the majority of our HrQoL domain sources did not differentiate between cell type, and our source that did focus on NSCLC 25 did not identify different domains than the others.
The tradeoffs in deciding which domains to include in an index are many. We attempted coverage of what is most important for NSCLC. Two domains of potential concern are swallowing difficulties and insomnia. Swallowing certainly affects some patients, but is less commonly mentioned as we found, and is not included in the FACT-L. For insomnia, we were concerned about severe overlap with fatigue. We are also interested in the inclusion of additional important domains, such as financial stress of treatment and others. At this point, however, we emphasized creating a version that used original items as much as possible.
There is an acknowledged issue with assessment of value for resources spent in cancer care. 8 Still, patient and public preferences may favor trying some treatment over no treatment, even if additional life expectancy is unlikely. The value aspect is particularly relevant in metastatic disease in the most common neoplasms such as lung and colorectal cancer.9,66 Cost-effectiveness methodology needs to be streamlined as well, with studies of lung cancer treatments currently often of only fair quality. 9 Such concerns might be partially addressed by consistent index measurement of HrQoL, as opposed to utilities measured in multiple ways and at times of unclear origin. 10 Disease-specific data may be particularly helpful where treatments are being compared, which we anticipate as a use for the FACT-LUI. An important step will also be delineation of the incremental benefits of the FACT-LUI versus generic indexes.
Footnotes
The author(s) declared no potential conflicts of interest with respect to the research, authorship, and/or publication of this article.
Financial support for this study was provided entirely by a grant from the American Cancer Society (#126904-PEP-14-206-01-PCSM). The funding agreement ensured the authors’ independence in designing the study, interpreting the data, writing, and publishing the report.