
Abstract
Complications of health care have become a major cause of death and disability worldwide. 1 Confronted with this problem, the World Health Assembly adopted a resolution urging countries to strengthen the safety of health care and monitoring systems in 2002. In the United States, the Centers for Medicare and Medicaid Services (CMS) have a congressional mandate to evaluate hospital performance using risk-adjusted mortality rates. The CMS began publicly reporting hospital 30-day mortality rates for patients with acute myocardial infarction and heart failure in June 2007 and for pneumonia in 2008. In Canada, the Canadian Institute for Health Information provides information on Canada’s health system under the mandate to accelerate improvements in health system performance. One of their goals is to expand their analytical tools to support measurement of health systems. 2 Clearly, statistical methods for assessing patient outcomes following hospital treatment and care is an issue of substantial public importance.
The patient outcome following hospital treatment and care is an important indicator of quality at the hospital where the patient is treated. Patient outcomes vary across hospitals due to individual patient health at admission (risk factors) as well as the quality of the treatment process and subsequent care. A performance measure at a particular hospital must adjust for the risk factors of the patients it has treated but not adjust for differences related to the quality of its processes and care. With an appropriate performance measure, a regulator or stakeholder may want to
Compare performance to target
Screen performance to decide which hospitals to inspect
Monitor performance for arising problems 3
Of particular importance is the ability of these functions to inform stakeholders who can accelerate improvements in patient outcomes. Uncertainty in the performance measure is also important to consider and is affected by the number of patients treated (cases) and patient mix at the various hospitals.
The New York State Department of Health (NYSDOH) has studied the effects of patient and treatment characteristics on outcomes for patients with heart disease for over 20 years. A common procedure performed on patients with coronary artery disease is percutaneous coronary intervention (PCI). The NYSDOH publishes an annual report based on information collected on PCI cases (patients who undergo the PCI procedure) over a 3-year period in New York State hospitals. 4 Their hospital-specific performance measure adjusts for its patients’ health at admission. The current practice to estimate the measure for a particular hospital involves estimates of its observed mortality rate, expected mortality rate for its observed patient mix, and the observed statewide mortality rate. The estimate of the observed mortality rate is a naïve estimate based on the observed outcomes of PCI cases for a particular hospital. As such, there is a high degree of instability and uncertainty in the NYSDOH estimate of performance for a low-volume hospital in particular, which limit its usefulness in decision making. The NYSDOH pools data over a 3-year time window to increase the number of cases observed by hospitals. We point out that though pooling data reduces uncertainty, this approach increases bias in an estimate of the present time performance when performance changes over time. Furthermore, this approach reduces the sensitivity to identify arising problems over time which is one important function of the metric.
The CMS uses an approach recommended by the COPPS-CMS White Paper Committee that similarly pools data over a 3-year time period to estimate risk-adjusted mortality rate for a particular hospital. 5 The key difference to the NYSDOH approach is that the CMS approach stabilizes the estimate of the observed mortality rate through a hierarchical, mixed effects model. These hospital-specific estimates are closer to the overall mortality rate across all hospitals and have lower standard error than the naïve observed mortality rate estimates. 5 Thus, this model is referred to as a shrinkage model. On average, the mortality rate estimates by the shrinkage model are closer to the overall mortality rate and have lower mean squared error (MSE) than estimates based on a fully fixed effects model. Kalbfleisch and Wolfe point out that the MSE advantage of the shrinkage model is achieved by smaller error among the large number of hospitals near the center of the distribution at the expense of larger error among hospitals with exceptional outcomes. 6 They state that if the goal is to have high power for identifying hospitals with exceptional outcomes and to estimate the difference from the expected outcome for such exceptional hospitals, then fixed effects methods are better than random effects methods. Another criticism of this approach is that shrinkage has the effect of producing estimates for low-volume hospitals that are close to the overall mean. Some stakeholders argue in favor of different shrinkage models depending on the volume of the hospital and others argue for no shrinkage at all. 5 Furthermore, the shrinkage model may be hard for hospital performance stakeholders to understand.
There is an opportunity to improve the bias and uncertainty in estimates of present performance beyond the current practices. The weighted estimating equations (WEE) approach borrows information from the past in order to manage a bias/variance tradeoff in an estimate of present performance. 7 Because processes and people that influence the quality of hospital procedures and follow-up care change over time, performance may drift slowly over time in an unpredictable way. Furthermore, some hospitals may treat a small number of cases relative to other hospitals. The WEE approach increases the statistical information for estimation by involving all relevant past data through the WEE. Estimates of present performance have less bias than pooled data without weights and less uncertainty than using present data only. Similar to the CMS approach, the WEE approach borrows strength across hospitals for estimates of covariate effects. The WEE approach has intuitive properties that can be understood by hospital performance stakeholders.
This article compares the WEE approach with the NYSDOH and CMS current practices to estimate a present performance measure from a stream of outcome data on PCI cases across hospitals with various process and follow-up care quality and patient risk factors. The objective is to reduce uncertainty in the estimates when some hospitals have relatively few PCI cases and manage the added bias caused by a possible slow change in performance over time. A realistic example dataset that has similar properties to the outcomes of PCI cases in New York State over the period from 2004 to 2012 and the mathematical formulations of the three approaches are given in the second section. In the third section, the estimates of performance across hospitals by the various approaches are given. In the fourth section, the results are summarized and considerations for implementing the WEE approach are discussed.
Methods
Data setup
Consider covariate and outcome data of coronary artery disease patients following PCI) over time. The patient population includes nonemergency cases among patients who undergo PCI for the first time and where suitable data are available on the patient following discharge. Certain patients are excluded from the study, including those with preprocedure cariogenic shock, hypoxic brain injury, and patients from hospitals where the data validation process was incomplete. Full details on the selection of the patient population is found in each of the annual NYSDOH reports. 4 Based on the reports over the 9-year period from 2004 to 2012, there are 467,401 PCI cases among 60 hospitals in New York State that meet the criteria for inclusion.
This analysis considers two possible patient outcomes: death or survival during the same hospital stay in which the patient underwent PCI or after hospital discharge but within 30 days of the procedure. Data on deaths occurring after discharge from the hospital are made available by various health organizations in New York State. Patients residing outside New York State were excluded from the analysis because there is no reliable way to track out-of-state deaths. The observations of death or survival are recorded by case (patient), by hospital, and by year. We consider eight covariates to describe the risk of death for the patient at time of admission:
Patient age
Hemodynamic state
Ventricular ejection fraction
Preprocedural myocardial infarction
Congestive heart failure
Chronic lung disease
Renal failure creatinine level
Malignant ventricular arrhythmia
These case-level risk factors and their levels are described in more detail in the NYSDOH reports. 4 As a referee correctly pointed out, in practice there may be related test data, such as Euroscores, and possibly many other covariates, such as the number or location of vessels revascularized and stent placement, that explain variation in the particular outcome. We use these eight risk factors to demonstrate the various methodologies for the problem at hand. In application of the methodology to real data, usual procedures to select the optimal set of risk factors for explaining the observed variation in the outcome should be followed. 8
We apply the following notation. Let
The general problem is to model
We define a vector of unknown parameters at time
Percutaneous Coronary Intervention Outcomes in New York State Dataset
Previously we described the setup of a dataset arising from percutaneous coronary intervention cases at New York State hospitals. The actual dataset is inaccessible to the public and so a realistic dataset is constructed with similar properties. In particular, the number of cases, mix of case-level covariate values, observed mortality rates, and logistic regression estimates of the covariate effects match closely to the NYSDOH reports. 4 Further details of the construction of this dataset are given in Supplementary Appendix A. Figure 1 gives the number of PCI cases by year, the observed mortality rate over time, and the linear trendline (using a least squares fit) in mortality rate.
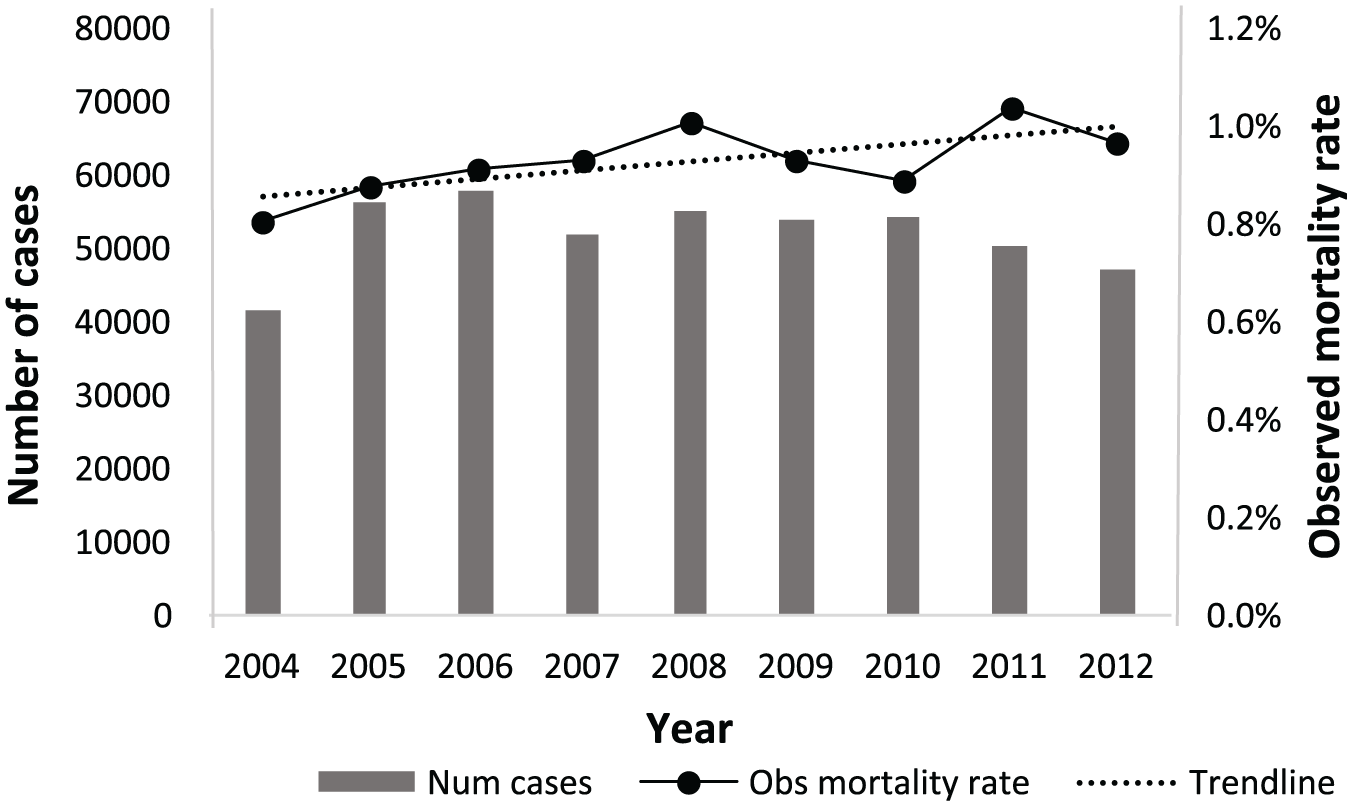
New York State: Number of PCI cases over time and observed mortality rates.
Figure 1 shows that mortality rate increases slowly over time. This naïve analysis based on proportions in individual time periods is not a useful indicator of performance over time since the risk factors for the PCI cases and the number of cases by hospital also change over time. An increase in the observed mortality rate over time could result from new PCI cases that have higher risk of mortality at admission, even in the case where overall performance is improving or stays the same. An increase in the number of cases at poorer performing hospitals has the same effect. Note that the number of PCI cases varies over time. The observed mortality rate by hospital for cases in the latest year (2012) is given in Figure 2.

New York State: Number of PCI cases in 2012 by hospital and observed mortality rates.
Figure 2 shows that there are large differences among the numbers of PCI cases across the various hospitals. Hospitals 4 and 25 treated 58 and 80 patients, respectively, whereas other hospitals treated as many as 4708 patients. Note that five hospitals reported no deaths among their cases.
Weighted Estimating Equations Approach
The WEE approach offers a tradeoff between estimation of a performance measure using present time data only or historical data over time weighted equally. 7 This tradeoff is especially important in the hospital performance problem since there may be a small number of cases at some hospitals at some time periods and the mortality rates by hospital may drift slowly in an unpredictable way over time due to the effects of unobserved factors.
Denote the observed data at time

A weighted estimating equation combines score functions across
Consider the likelihood function

The linear predictor is

as an estimate for expected information matrix,
The performance measure must adjust for differences in the risk of cases (patients) across hospitals but not adjust away differences related to the quality of the hospital processes or follow-up care. We define a standard population, which is a set of covariate values representing cases in a population of importance. The performance estimate is made at each hospital for cases in the same standard population so that comparisons across hospitals remove the effect of varying patient mix. A reasonable standard population for this application is the 47,045 PCI cases in 2012 across New York State hospitals. We represent each the covariate vector of each case in the standard population as

by the multivariate delta method.
9
Note that


under the assumption that the random variables
The WEE estimates can be calculated through most regression software that allows for weights. In SAS, the weighted estimating equations can be solved using PROC GENMOD.
10
Consider a dataset called SAMPLE_DATA with one row for each case. The dataset contains fields for an index (“case”), covariate values (“
New York State Department of Health Approach
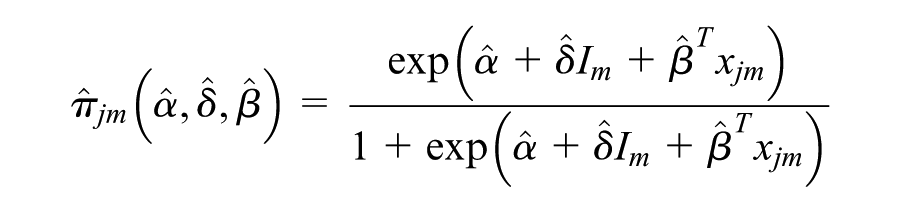
The risk-adjusted mortality rate approach in use by the NYSDOH estimates the hospital’s mortality rate adjusted for the characteristics (risks) of its cases. Each particular NYSDOH mortality rate involves a hospital-specific ratio of its observed mortality rate divided by its expected mortality rate. The hospital-specific expected mortality rate is based on estimates of baseline and covariate effects

where

The expected mortality rate for each hospital is estimated by adding the estimates of probability of death for each of its cases and dividing by the number of cases,

is larger (smaller) than one, the hospital has a higher (lower) mortality rate than expected on the basis of its case mix. The hospital-specific ratio is converted to a mortality rate by multiplying the ratio by the observed mortality rate across all New York State PCI cases. The NYSDOH risk-adjusted, hospital-specific mortality rate estimate is
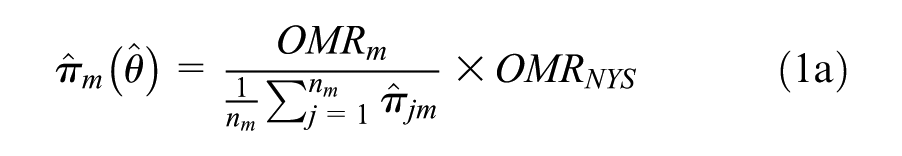
where

is the observed mortality rate across all New York State hospitals.
The annual reports do not specify the methodology for estimating the uncertainty of

Centers for Medicare and Medicaid Services Approach
The current practice used by the CMS to address the challenge of estimation with a small number of cases is a hierarchical mixed effects model that accounts for case-level risk factors and hospital-level variation.
5
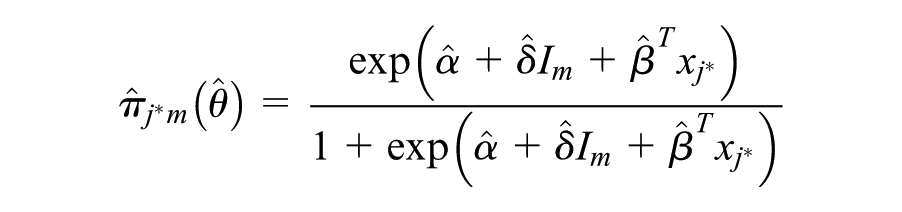
The estimation of the hospital-specific mortality rate through this model takes the place of the observed mortality rate in the NYSDOH approach. The likelihood function for the problem under consideration is based on a generalized linear mixed model with linear predictor
for
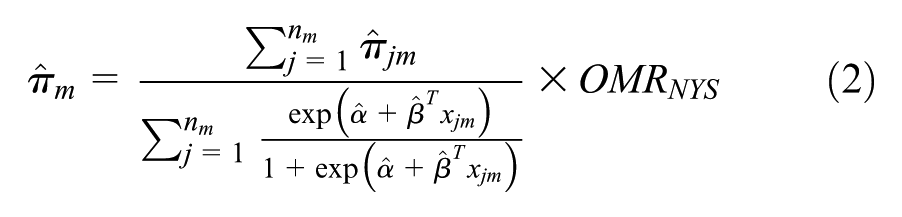
where

is the observed mortality rate across all New York State hospitals. Like the NYSDOH performance measure, the CMS mortality rate estimate in (2) adjusts for the risk among cases at each particular hospital. The numerator of the performance measure is the estimated total number of events for the particular hospital and is determined through estimates of the risk coefficients, the hospital-specific intercept, and the hospital-specific case covariate values. The denominator of the performance measure reflects the expected total number of events for the particular hospital given its actual patient mix as in the numerator but without any hospital-specific intercept. The hospital-specific ratio

represents the performance of the particular hospital relative to the performance of the state as a whole and is interpreted in the same fashion as the ratio

in (1). Through the prediction of the hospital-specific random effect, the hospital-specific ratio in (2) is closer to one and has lower standard error than the hospital-specific ratio in (1) for each hospital
Kalbfleisch and Wolfe suggest a modification to the CMS approach whereby the standardized mortality rate is based on the estimate of the hospital-specific fixed effect rather than the random effect. 6 To date, this work has been done for linear models only and is not applicable to the problem at hand.
Results
The objective is to estimate the present time mortality rate by hospital for a standard population with a bias/variance tradeoff so that stakeholders can compare and monitor performance across hospitals and across time. Figures 3, 4, and 5 give estimates of mortality rate by hospital and 95% confidence intervals of these estimates based on the WEE approach assuming normality and the two current practices discussed previously. All of the estimates are risk-adjusted for the 2012 population of PCI patients in New York State. Note that the estimates in Figure 3 are based on dataset

Weighted estimating equations estimates of 2012 risk-adjusted mortality rates by hospital (λ = 0.5).

New York State Department of Health estimates of 2012 risk-adjusted mortality rates by hospital.

The Centers for Medicare and Medicaid Services estimates of 2012 risk-adjusted mortality rates by hospital.
A discussion of these results is given in the next section. Next, we consider the estimates by the various approaches to monitor performance across time. Figure 6 gives the estimates and 95% confidence intervals of mortality rate made by the three approaches for a particular hospital (Ref. 3) as at the various years. The WEE estimates over time are mean mortality rate estimates for the same standard population which is the population of 2012 cases. The linear trendlines in the estimates by the three approaches are shown.

Risk-adjusted estimates of mortality rate for hospital 3 by various approaches over time. CMS, Centers for Medicare and Medicaid Services; NYSDOH, New York State Department of Health; WEE, Weighted estimating equations.
A discussion of this figure is given in the next section. Furthermore, we demonstrate the relationship between the time intervals of the data and weight parameter

New York State: Number of PCI cases over latest 15 months and observed mortality rates.
Comparing Figures 7 and 1, we see that the average rate of change in observed mortality rate month to month is slower than that based on data in yearly intervals. A smaller value of

Weighted estimating equations estimates of 2012 mortality rate by hospital based on monthly data (λ = 0.06)
Discussion
Estimation of a medical performance measure is important for health care monitoring and regulation. Current practices pool outcome data of PCI cases over 3 years to reduce uncertainty since the number of cases treated in the current year may be small. They adjust for observed incoming patient health characteristics since various hospitals treat cases with different risks. The estimates involve a generalized linear binomial model with fixed or random covariate and hospital effects. In this article, we propose the WEE approach as an alternative that also incorporates past data, adjusts for case risk, and involves a binomial model. The key advantage of the WEE approach is that similar data from time periods further in the past are used to improve precision in mortality rate estimates while managing the added bias when mortality rate changes slowly over time. This tradeoff is especially important when there may be a small number of cases at some time periods and the outcome of interest changes slowly over time. When the precision and bias in the estimates are improved, we can compare performance to target, screen performance to decide which hospitals to inspect, and monitor performance for arising problems with more sensitivity and reliability.
Figures 3, 4, and 5 show some important differences between the estimates by the various approaches. We are unable to quantify bias in the various estimates since we do not know the true values of the mortality rates. We compare precision of the estimates through the widths of the confidence intervals (uncertainty) by hospital. The uncertainty based on the WEE approach is smaller than that based on the NYSDOH approach for 32 of the 60 hospitals and smaller than that based on the CMS approach for 54 of the 60 hospitals. In particular, note the differences in uncertainty for those hospitals with exceptional performance. For each hospital with no deaths in 2012 (Ref. 7, 9, 12, 21, 25), the uncertainty of the estimate by the NYSDOH or CMS approaches is around 38% larger than that by the WEE approach. For the three hospitals with the highest mortality rates based on the WEE approach (Ref. 1, 18, 56), the intervals support the Kalbfleisch and Wolfe claim that CMS estimates of exceptional performance have poor precision. 6 The effect of borrowing strength from the historical data through the WEE approach when there is little statistical information in the present time period data results in more precise estimates of present performance. The CMS approach is the least sensitive approach for identifying outlying hospitals because of the shrunken hospital effect predictions. We see that the WEE approach identifies four hospitals with significantly worse performance than the overall mean that are not identified by the CMS approach (Ref. 3, 15, 28, 36).
Figure 6 shows that there is an increasing trend in mortality rate estimates over the period 2005 to 2012 at hospital 3. Around this trend, the estimates by the WEE approach fluctuate the least and have the smallest uncertainty. The WEE trendline is steeper than the other two. In this example, the WEE is the most sensitive approach at detecting changes over time. Considering precision of the estimates, the ability to identify hospitals with exceptional performance, and sensitivity to changes over time, the WEE approach has advantages over the CMS and NYSDOH approaches for the realistic PCI in New York State dataset. The adoption of the WEE approach could have an important impact on the decisions made by hospital performance stakeholders.
A selection of weights
The appropriate selection of weight parameter
The application under consideration is a real problem but the real data are inaccessible. The observations are based on a realistic dataset created to have properties similar to percutaneous coronary intervention cases in New York State during the period 2004 to 2012. The goal of this work is to demonstrate the advantages of the methodology rather than draw conclusions pertaining to this application. With real data, other covariates and outcome measures may be pertinent. Furthermore, any missing data or changes in the reporting of data over time need to be handled. Usual practices are recommended. 11
The limitation of this work is that the methodologies are compared based solely on one dataset. Further work is recommended to apply the WEE approach to other hospital performance datasets and compare the estimates and their uncertainties to those of competing approaches. However, there are intuitive properties of the WEE approach that substantiate this alternative relative to current practices. Including historical data but down-weighting their contribution to the estimating functions is a sensible approach to overcome the challenge of a small number of cases in the present time period. Estimation of covariate effects borrow strength across hospitals and estimation of covariate and hospital effects both borrow strength across time. The potential to add bias by performance that changes over time is controlled by appropriate choices of the time interval and weight parameter. These are intuitive advantages relative to the current practices which pool data into three-year time intervals.
Based on the quantitative results from the realistic analysis of percutaneous coronary intervention cases in New York State and the qualitative understanding of the methodology, we expect the advantages of the WEE approach to extend to analysis of data from hospital procedures and surgeries more broadly. The methodology is recommended for comparing the performance of medical practitioners, especially when the number of procedures performed by various practitioners varies significantly. The WEE approach to support decisions affecting health care performance deserves further attention.
Supplemental Material
DS_10.1177_2381468318761027 – Supplemental material for Comparing and Monitoring Risk-Adjusted Hospital Performance Measures: A Weighted Estimating Equations Approach
Supplemental material, DS_10.1177_2381468318761027 for Comparing and Monitoring Risk-Adjusted Hospital Performance Measures: A Weighted Estimating Equations Approach by Patricia Cooper Barfoot, R. Jock MacKay and Stefan H. Steiner in MDM Policy & Practice
Footnotes
Financial support for this study was provided in part by research grant 105240 from the Natural Sciences and Engineering Research Council of Canada. The funding agreement ensured the authors’ independence in designing the study, interpreting the data, writing, and publishing the report.
References
Supplementary Material
Please find the following supplemental material available below.
For Open Access articles published under a Creative Commons License, all supplemental material carries the same license as the article it is associated with.
For non-Open Access articles published, all supplemental material carries a non-exclusive license, and permission requests for re-use of supplemental material or any part of supplemental material shall be sent directly to the copyright owner as specified in the copyright notice associated with the article.