
Abstract
The estimation of input costs in Markov models remains a challenge. This is due to the fact that costs are primarily attributable to health care interventions and not to health states, as required in Markov models.1,2 Relating costs to health states is particularly problematic for mental illnesses, as specific interventions are not clearly associated to specific health states. For instance, the costs incurred by moderately to severely depressed patients after response to treatment or after remission are virtually nonidentifiable in statutory health insurance (SHI) claims data, since these health states are not coded accordingly.
In the majority of health economic evaluations of antidepressants, resource use in the different health states is therefore estimated on the basis of expert opinion 3 or in some cases derived directly from clinical studies.4–6 However, the limitations of these methods have been extensively discussed.7–9 For instance, data obtained from the aforementioned sources might be highly context-dependent and not readily transferable to the real-life treatment setting. Moreover, even if health state–specific costs are specified, authors of health economic studies on depression often do not describe how costs were attributed to the different health states and/or provide information on the calculation approach applied.4–6,10–13
This article presents a hybrid approach to health state–specific cost estimation. Our aim was to combine information from the (rather normative) evidence-based guideline recommendations and the (experience-based) expert surveys in order to complement patient-specific SHI claims data, thus enabling the transparent allocation of costs to different health states. We chose this approach to reflect the true costs incurred over a specified time period as accurately as possible.
The illustrated costing approach was applied within a health economic evaluation of antidepressants by the German Institute for Quality and Efficiency in Health Care (IQWiG) using the efficiency frontier approach. The evaluation was conducted to derive recommendations on reimbursement prices for newer antidepressants. It used effectiveness data from two previously conducted IQWiG benefit assessments.14,15 Costs and effectiveness were combined in a Markov cohort simulation model with eight health states. Two time horizons were considered: first a short-term time horizon of 2 months and additionally a 1-year time horizon. The model included four newer antidepressants (venlafaxine, duloxetine, bupropion, and mirtazapine) whose cost-effectiveness was compared to a range of comparator drugs: tricyclic antidepressants (TCAs) including the tetracyclic maprotiline, selective serotonin reuptake inhibitors (SSRIs), agomelatine, and trazodone. If drug classes were investigated, only one main agent per drug class was considered, as specified in the prior benefit assessments.14,15
Publishing the estimation of input costs of a health economic model in a stand-alone paper and not together with modelling results allows the presentation in more detail of the methods applied and the corresponding results. The objective of this article is to transparently describe our approach for generating input costs for the health states of a Markov model comparing antidepressant treatment alternatives. This includes the presentation of individual calculations, which might provide useful support or even input for future models. The generation of effect estimates, the development of the decision-analytic model, the results of the health economic evaluation using the efficiency frontier approach, and the management of uncertainty have been described in the respective IQWiG report. 16
Methods
Framework
All costs were determined from the perspective of the community of persons insured by the SHI funds (SHI insuree perspective for short), as stipulated by German law. This perspective includes all costs reimbursed by the SHI, as well as co-payments. 17 Costs were estimated for the following four main cost categories: outpatient care (general practitioners [GPs], specialists, and laboratory tests), drugs, psychotherapy, and inpatient care. As an additional perspective, we also included two cost components of the societal perspective, namely, costs incurred by rehabilitation and productivity losses.
Costs were derived for the input parameters of a decision-analytic Markov model. The model simulated the disease and its treatment, taking into account the different health states representing the specific disease stages and possible treatment outcomes. Figure 1 shows a simplified outline of the health states and possible transitions between health states.
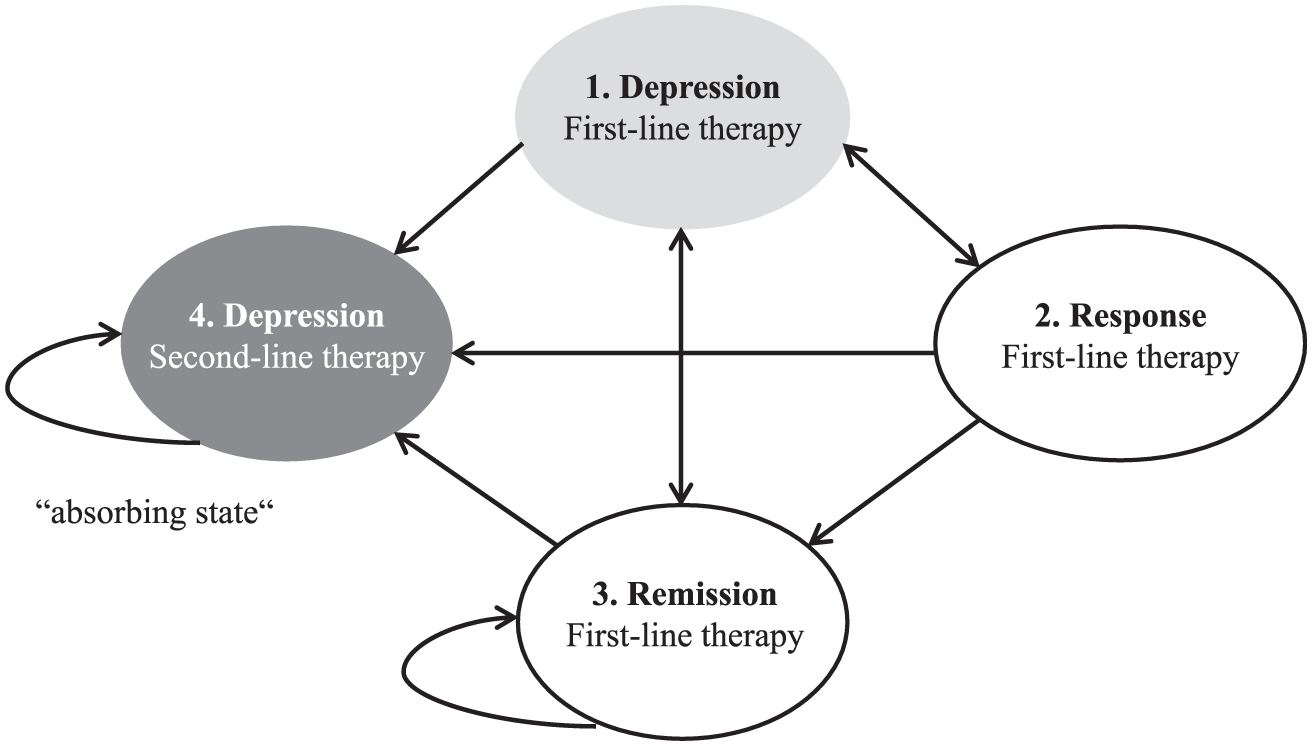
State-transition diagram (simplified version)
The following health states were considered for first-line treatment (FT) of depression:
Acute treatment = “FT acute”
Continued treatment after achievement of response = “FT response”
Continued treatment after achievement of remission = “FT remission”
Continued treatment after relapse = “FT relapse”
The following health states were considered for second-line treatment (ST) of depression:
Continued treatment after treatment discontinuation due to adverse events = “ST after disc. due to AEs”
Continued treatment after no response = “ST no response”
Continued treatment after response/remission achieved in ST after discontinuation of FT = “ST response/remission after FT disc”
Continued treatment after relapse = “ST relapse”
Costs were calculated per 8-week period, the cycle length in the Markov model. We computed all costs in a two-step process. First, we identified the resource use and related costs for each cost category. Second, we transferred the information for each cost category to the single health states (“health state costing”). We preferably measured resource quantities on basis of individual patients (bottom-up approach) but used average values (top-down approach) if individual data were not available. We estimated the costs for the resource use either with the micro-costing approach (identifying every single cost component) or the macro-costing approach (identifying costs at an aggregated level), depending on which approach was reasonable in the respective context. 18
Data Sources
Costs were extracted from SHI claims data where available. Claims data provided by the second largest German SHI fund, the Barmer GEK, were analyzed for the year 2010. The data set included data on 3,888,548 Barmer GEK members from all regions in Germany. The data used for costing were matched to the clinical study populations of the IQWiG benefit assessments.14,15 The following inclusion criteria applied: 1) age between 18 and 65 years; 2) continuously insured in 2010; 3) current treatment with one of the study or comparator drugs investigated, but no treatment with any antidepressant for at least 6 months prior to the start of treatment with the study or comparator drug; 4) diagnosis of an acute (moderate to severe) episode of major depression (according to the International Classification of Diseases, German Modification 10, ICD-10-GM codes F32.1, F32.2, F33.1, F33.2); and 5) no psychiatric comorbidities that could influence treatment (e.g., addiction, schizophrenia, suicidal tendency). A total of 88,437 patients were included in the analysis. Cost data for rehabilitation were provided by the German Pension Insurance Office for the year 2009. 19 As the claims data provided information on interventions in the different cost categories, they were used to calculate the average resource use and costs per patient in the respective cost category.
In addition, the German clinical practice guideline on depression 20 was used to identify and calculate treatment-related and health state–specific resource use for outpatient care, psychotherapy, and drugs. It was not used for estimating inpatient-related resource use, as hospital costs were based on a daily charge (also including drug costs). The market proportions of the prescriptions for the various antidepressants were obtained from the German Pharmaceutical Prescriptions Report. 21 Estimations for remaining issues, such as the proportion of patients receiving first- or second-line treatment, were obtained from an expert survey (13 GPs and specialists in outpatient and inpatient care). Details of the SHI claims data and the patient sample, as well as of the selection of experts, the structure of the questionnaire, and the survey results, are described elsewhere. 16
The following German pricing sources were used: The Uniform Value Scale 22 with the point value of 2011 23 for outpatient and psychotherapy services, the Pharmacy Price Schedule (Lauer Taxe) 24 for drug costs, as well as the National Accounts 2010 of the Federal Statistical Office 25 for productivity loss. The index year for costs was 2011. If prices were not available for 2011, they were adapted to 2011 by means of the Consumer Price Index. 26 See Table 1 for an overview of the data sources used to estimate and valuate resource use per cost category and health state.
Data Sources Used in the Stepwise Hybrid Approach to Estimate and Valuate Resource Use per Cost Category, or Health State
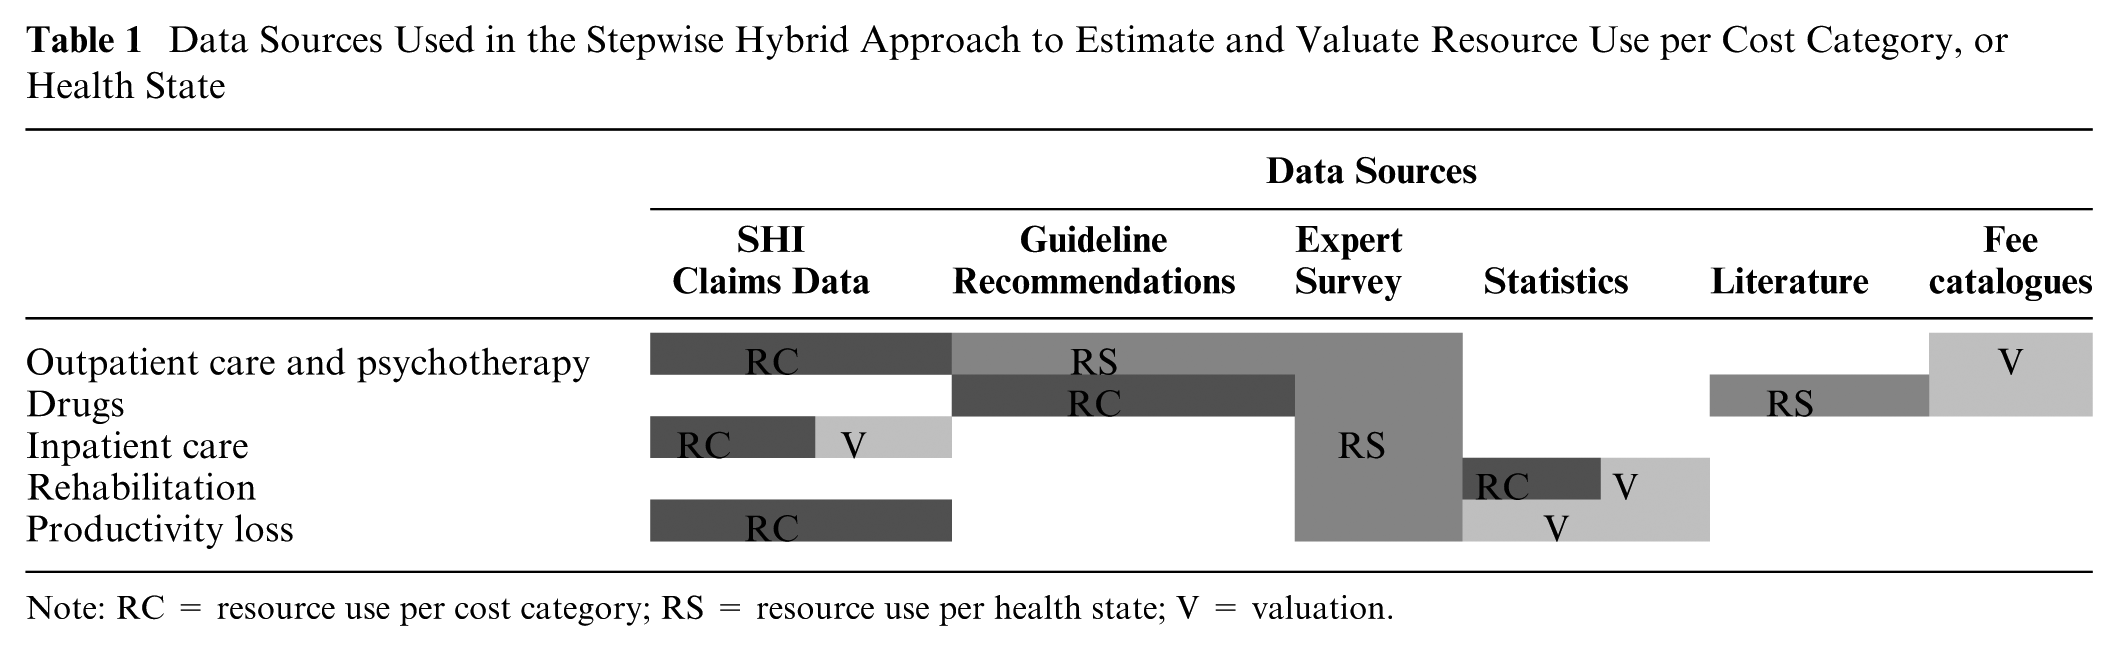
Note: RC = resource use per cost category; RS = resource use per health state; V = valuation.
Determination of Resource Use and Costs per Category
A bottom-up approach was used to determine the costs for outpatient care, psychotherapy, drugs, inpatient care, and co-payments. Cost data on productivity losses and rehabilitation were only available in an aggregated form, requiring a top-down calculation. 18
For outpatient care, psychotherapy, and drugs, the costs are the product of the amount of resources used per patient and the corresponding unit costs. 22 In cases where SHI claims data showed that only a proportion of patients received interventions in these three categories, the costs were attributed to the specific proportion. For drugs, the average resource use per patient was measured in defined daily doses. 20 For dose intervals, the dose was averaged. For different package sizes and administration regimens, the least costly options were chosen. Rebates from drug manufacturers and pharmacies to the SHI were subtracted. In respect of second-line treatment, we calculated costs for three different treatment options: switching of drugs, combination of drugs, and augmentation with lithium. 20 Adherence to treatment was not considered in our analysis, as the study population in the model was matched to the study population from the benefit assessment, which did not consider this outcome.14,15 For hospitalization and rehabilitation, the costs were calculated as the number of days in hospital multiplied by a per-diem charge, including drug costs. 16 For the estimation of productivity losses, the average number of annual sick days per patient was multiplied by the average value of a lost working day,16,25 using the human capital approach. Co-payments were calculated for the categories outpatient care, drugs, inpatient care, and rehabilitation using the German co-payment regulations of 2011. 27
Health State Costing
The costing approaches and the variables for health state costing varied depending on how costs were incurred over the time horizon of the Markov model. Costs incurred intermittently over the time horizon (“intermittent costs”), such as costs for hospitalization, rehabilitation, and productivity losses, were transformed top-down to constant costs per period. The only health state–specific variable was the proportion of patients incurring these costs. We assumed that patients were hospitalized and/or in rehabilitation only once per year. In addition, we assumed that sick days were equally distributed over a year.
For costs incurred almost continuously throughout the time horizon of the model (“continuous costs”), such as costs for outpatient care and drugs (including related co-payments), the health state–specific costs were determined in a bottom-up approach. This means that we jointly considered different resource uses per cost category in each health state and the different proportions of patients in the cost categories according to the health state. The variables for resource use in outpatient care were the following: 1) proportion of patients visiting a GP or specialist; 2) number of visits to a physician (either a GP or specialist); 3) type of laboratory or physician service used; and 4) the proportion of patients receiving outpatient care. The variables for drug costs were the following: 1) treatment options (continuation of first-line treatment, switching of drugs, combination of drugs, or augmentation with lithium) and 2) proportions of patients receiving the respective treatment options.
For psychotherapy, a mixed approach was used: analogous to the calculation of the costs for inpatient care and rehabilitation, an average costs per 8 week Markov cycle was multiplied with the proportions of patients receiving psychotherapy in the different health states, but we assumed higher costs at the beginning of therapy (e.g., for medical history taking). This information was based on the patient-specific SHI claims data. Transition costs were calculated once when entering second-line treatment health states, as we assumed higher treatment costs for these health states in the first few weeks than in the following weeks (one-off costs). Figure 2 summarizes the approaches used for the calculation of costs per category and per health state.

Calculation steps taken to estimate the input costs per cost category and health state
Results
Results per Cost Category
A detailed listing of resource use (based on the relevant items of the German Uniform Value Scale), 22 as well as cost ranges per 8-week period for outpatient care and psychotherapy, are provided in Online Appendix 1. The average daily dose for all drugs considered and the costs per day and per 8-week period are provided in Online Appendix 2. To determine the resource use for psychotherapy, we assumed that, according to the SHI claims data, 25% of the patients with psychotherapy had received behavioral therapy, 50% in-depth psychological therapy, and 25% other forms of therapy. In addition, 50% of the patients incurred additional costs for psychological testing and consultations and 25% incurred additional costs for the detailed documentation of medical history, which we defined as one-off costs per average patient in this model. A total of 6.5% of patients were hospitalized for about 56 days on average per year, at an average daily fee of €174. 16 A total of 2.1% underwent rehabilitation in 2009 with an average length of 40 days; the average daily cost was €101. 19 An average of 14% of patients were on sick leave in the year 2010. 16 The average number of sick days per patient on sick leave was 88 for the year 2010, with an average lost working day costing €96.16,25 The total costs incurred per 8-week period are shown in Table 2.
Constant Components of Intermittent Costs per 8-Week Period

Note: For patients concerned with these cost sectors.
Sources (all German): SHI claims data, point value 2011 23 ; Statistics of the German Pension Insurance 2009 19 ; National Accounts 2010 of the Federal Statistical Office 25 ; Uniform Value Scale 2011. 22
One-off costs, see Online Appendix 1.
Variables for Health State Costing
Differences in costs for all health states resulted from different proportions of patients incurring costs. For outpatient care, drugs, and related co-payments, the proportion of patients incurring costs in these categories varied from 98% for different health states to 100% (health state “FT remission”). In all of the other cost categories (inpatient care, psychotherapy, rehabilitation, and productivity loss), no patients incurred costs in the health state of “FT remission.” With regard to all other health states up to 35% of patients underwent psychotherapy in addition to drug therapy, up to 2% were hospitalized, up to 0.4% were in rehabilitation, and up to 2.3% were on sick leave, per eight-week period. For detailed results see Online Appendix 3. Health state–specific variables determining resource use in the categories “outpatient care” and “drugs” are shown in Table 3.
Variables for Resource Use per Health State (Continuous Costs)

Note: FT = first-line treatment; ST = second-line treatment; TCAs = tricyclic antidepressants.
Per 8-week period.
See Online Appendix 2 for daily drug dose.
Assumption based on expert survey: 75% of the patients were treated by a GP and 25% by a specialist. 16
Assumption based on expert survey: 25% of the patients were treated by a GP and 75% by a specialist. 16
Results per Health State and Cost Category
The average input costs per patient per 8-week period varied, depending on the drug strategy and health state. However, differences in cost parameters depending on the drug strategy mainly arose from the different drug costs themselves (Table 4). In first-line treatment, changes in costs per health state were therefore caused only by the respective proportion of patients incurring costs in the different cost categories. Cost differences in second-line treatment were mainly caused by drug combinations and treatment switching. Cost-intensive drug strategies in first-line treatment therefore became less costly in second-line treatment, whereas low-cost strategies in first-line treatment became more costly in second-line treatment.
Average per Patient Input Costs for the Markov Model: Drug Costs (Including Co-Payments for Drugs)

Note: FT = first-line treatment; SSRIs = selective serotonin reuptake inhibitors; ST = second-line treatment; TCAs = tricyclic antidepressants.
For SSRIs and TCAs, in each case the least expensive drug was defined as the main agent from the drug class.
In outpatient care, few drug strategy–specific differences in costs could be reliably determined for the various cost categories for the 1-year time horizon. Differences were shown for monitoring costs, which were higher for TCAs, due to the costs for electrocardiograms, and lower for placebo. No drug strategy specific costs could be verified for the other cost categories. Onetime costs for entering different health states lay between €33 and €76. There were no onetime costs for the transition into the health states “FT acute,”“remission,” and “response.” From the SHI insuree perspective, hospitalizations caused the highest costs of all cost categories (except for the health states “FT remission,”“FT response,” and “ST response/remission after FT disc.”), namely, up to 51% of the total costs (Table 5 and Figure 3). Drug costs were ranked second with up to 36% (except for the health state “FT remission,” where these costs were 71%, as no costs for inpatient care, rehabilitation, and psychotherapy are incurred here) followed by outpatient care (up to 30%) and psychotherapy costs (up to 22%). From the societal perspective, loss of productivity accounted for the largest share of the total costs (up to 41%).
Costs in Individual Cost Categories as a Proportion of Total Costs (Ranges a Depending on Health States).
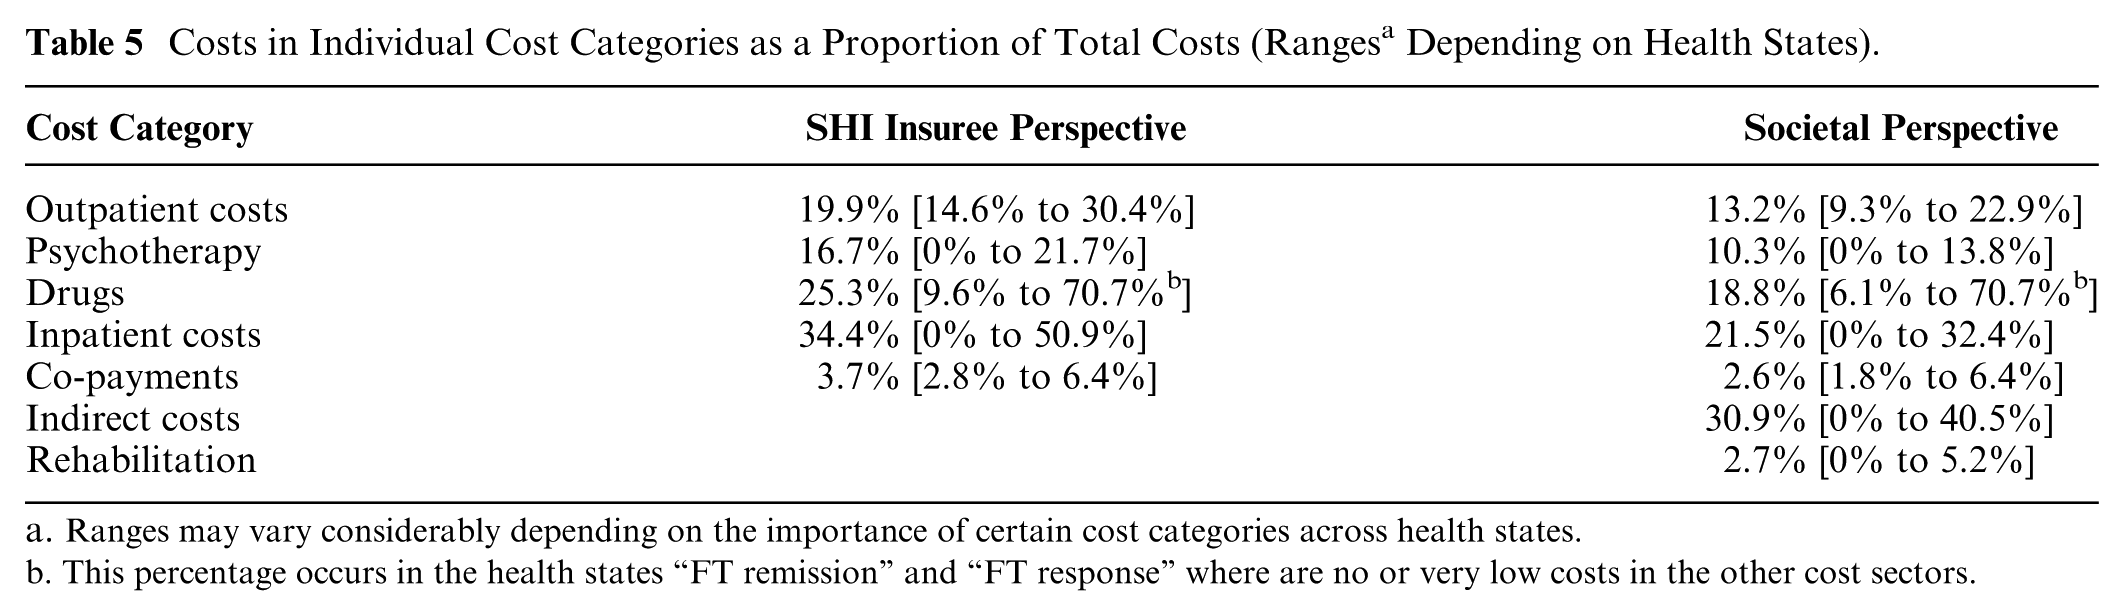
Ranges may vary considerably depending on the importance of certain cost categories across health states.
This percentage occurs in the health states “FT remission” and “FT response” where are no or very low costs in the other cost sectors.

Average per patient input costs in € for the Markov model per cost category per 8-week period (societal perspective)
From the SHI insuree perspective, the average total input costs per patient per 8-week period varied from €55 for SSRIs (respectively €32 for placebo) in the health state “FT remission” to €506 for agomelatine in “FT relapse.” From the societal perspective, the lowest costs were equal to those of the SHI insuree perspective, as zero costs for productivity loss and rehabilitation were assumed for patients in “FT remission.” The highest costs from the societal perspective were €724 for agomelatine in “FT relapse.” The total input costs per strategy for each health state are represented in Online Appendixes 4 and 5.
Discussion
We presented a hybrid approach for estimating costs as input data for a Markov model in depression, using claims data from the German SHI system. Health state–specific variables were determined by means of expert surveys and guideline recommendations. Depending on the type of data and the time-related aspects of costs (continuous vs. intermittent costs), we combined two different approaches (bottom-up and top-down) for assigning costs at the level of each drug strategy and health state. The lowest costs (excluding placebo) were incurred under SSRIs in the health state “FT remission” and the highest costs under agomelatine in “FT relapse” from both perspectives. While input costs differed considerably across health states, they only showed minor differences across drug strategies. From the SHI insuree perspective, the most relevant cost factor was hospitalization. From the societal perspective, it was productivity loss.
Although the objective of our study was to derive input cost parameters for a Markov model, our estimates could feed into any multistate model in major depression using assumptions and health states similar to those we used. Nevertheless, our estimates cannot be meaningfully used for models attributing costs to health care interventions, nor in international contexts, without the necessary adjustments. More generally, however, our methods could be used for international contexts supplying claims data, clinical practice guidelines, and expert surveys, as well as for other illnesses whose complexity requires the attribution of costs to health states instead of health care interventions.
Even though treatment pathways differ between countries, it would be useful to conduct health economic evaluations with more detailed approaches for health state costing. The complete and reproducible presentation of cost data would not only be a valuable basis for financial decisions, it could generally accelerate the conduct of future evaluations and increase the comparability of results.
Comparison With Previous Research
Our study extends previous research not only by presenting a stepwise hierarchical approach using different data sources for costing but also by presenting important health-specific variables and results in a transparent manner. In contrast, in previous models, the estimation of resource use was largely based on expert surveys. 3 From seven health economic evaluations4–6,10–13 investigating similar study populations, interventions, and health states, or choosing a comparable time horizon or cost categories, only one evaluation 13 described the data sources and health state–specific variables and results. Some named data sources and summarized final input costs6,10 or addressed certain health state–specific variables, 12 but did not describe how costs were attributed to different health states. Another described data sources and provided some information on costing, without describing how costing was performed with respect to health states. 11 A further evaluation did not mention health state–specific costing at all, even though a Markov model was chosen. 4 None reported the costing approach (bottom-up vs. top-down) used or explained the choice of data sources.
As we identified no other German health economic evaluation reporting health state–specific input costs, no context-specific comparison with previous research in Germany was possible. However, we were able to compare single cost parameters with results from German cost studies.12,28–31 Minor deviations in psychotherapy and inpatient costs could be explained by differences in the study population, for example, with regard to age, 30 definition of therapeutic indication, or cost classification.28,29 We calculated costs of €9,730 per hospitalization period; higher costs of €11,813 12 and €10,679 31 have been reported in the literature. This is because daily costs were lower in our calculation, as we also considered day-time clinics, which charge lower daily fees than inpatient clinics. The average length of stay varied between 49 and 63 days,12,31 compared with 56 days in our calculation. As no other study calculated costs for outpatient care and drugs in a bottom-up approach for each health state, we could not compare our findings in these cost sectors with other studies. However, the cost structure was comparable to structures reported previously,12,29–31 with inpatient costs representing the greatest cost factor from the SHI insuree perspective. In addition, we compared the annual total costs predicted in the model with the published annual total costs reported in German cost studies and health economic evaluations.12,29,30 Deviations from the results of our analysis could be explained by differences in patient characteristics (e.g., age) in three studies.28–30 However, our results also deviated from those of an analysis with similar patient characteristics. This might be explained by different assumptions on the number of outpatient visits and the proportion of hospitalized patients. 12
Limitations
In our costing approach, we used three different types of data sources to measure resource use: claims data, clinical practice guidelines, and expert surveys. All of these sources have advantages and limitations. Claims data reflect the “as-is” situation and allow the determination of the entire resource use, as well as the real net prices. In addition, they more or less precisely describe treatment periods. Disadvantages include potential biases due to variations in 1) patient groups, 2) regional characteristics, 3) prescribing practices of physicians (e.g., noncompliance with guideline recommendations), and 4) reimbursement contracts between SHI funds and service providers. Assumptions based on guideline recommendations are not affected by these potential problems to the same extent. However, guidelines reflect a normative situation, not necessarily the actual resource use. Assumptions based on expert surveys offer the advantage of obtaining very detailed and specific information not always available from other sources. Expert surveys are, however, considered to be the information source with the lowest internal validity 9 and should therefore be used only in cases where data cannot be obtained from other sources or to supplement data from more valid sources. In addition, the selection and number of experts cannot be considered representative and therefore might have produced biased assumptions.
In addition, further limitations may apply:
Due to the requirements of the Markov model we could not use a bottom-up approach for cost estimation in all cost categories. For intermittent costs, the distribution of the average yearly costs to 8-week periods and health states is imprecise compared with bottom-up health state costing of continuous costs.
We used a micro-costing approach only for the estimation of drug costs. In the outpatient sector, reimbursement in Germany is based on so-called “complex fees” (payment of a lump sum for different components of treatment) according to the German Uniform Value Scale. Reimbursement of the inpatient sector is based on daily rates. A macro-costing approach is therefore a reasonable approach to represent real costs for the SHI in these sectors. 18 However, from the societal perspective, the SHI administrative costs do not necessarily represent the true costs to society, especially due to the increasing proportion of complex fees.
We assumed that patients were hospitalized only once per year. In the case of severe depression it is possible that patients are hospitalized several times a year. According to the SHI claims data, patients were hospitalized for about 56 days on average per year. The calculation for inpatient care is made on the basis of average daily rates. Therefore, the inpatient costs are independent of the number of hospitalizations per year, as long as the total number of inpatient days per year remains the same. However, according to our sensitivity analyses, the costs for outpatient care, drugs, and psychotherapy could slightly increase. The reason for this is that, with higher hospitalization rates, the average length of stay is reduced, and it therefore becomes possible that patients induce costs in both outpatient and inpatient care during one cycle. This is in contrast to our assumption, where patients can be in either inpatient or outpatient care in the same cycle (since 56 days correlate with the length of one Markov cycle).
We identified only minor cost differences in the monitoring of patients taking antidepressants, which is consistent with the information provided in the German guideline on depression. 20 We took these differences into account. Cost differences between drug strategies arose mainly from the different drug costs themselves.
All limitations can cause uncertainties that may not be fully examined and adjusted for in deterministic and probabilistic sensitivity analyses.
Conclusion
Our findings indicate that, in order to estimate costs in health economic evaluations of treatments for mental illnesses such as depression, it can be necessary to link different data sources and costing approaches using a systematic hybrid approach to meet the requirements of the decision-analytic model. This would enable the determination of health state–specific costs, even if interventions are not directly related to health states in depression. As the systematic hybrid approach can increase complexity, the corresponding calculations should be presented transparently. Our findings could provide useful input for future models.
Footnotes
Acknowledgements
The authors thank Natalie McGauran and Vanessa Voelskow for their comments on the manuscript and for editorial support.
Financial support for this study commissioned by the Federal Joint Committee (G-BA) was provided entirely by a tender from the Institute for Quality and Efficiency in Health Care (IQWiG), Cologne, Germany. The IQWiG is an independent scientific institution financed through contributions from the insured of the statutory health insurance funds in Germany. Assessment reports conducted by IQWiG are commissioned either by the Federal Joint Committee (G-BA) or by the Ministry of Health (BMG). The funding agreement ensured the authors’ independence in designing the study, interpreting the data, writing, and publishing the report. The following authors are or were employed by the IQWiG: A. Seidl, M. Danner, C. J. Wagner, F. G. Sandmann, A. Schwalm, S. K. Lhachimi and A. Gerber-Grote. G. Sroczynski and U. Siebert are employed by UMIT—University for Health Sciences, Medical Informatics and Technology, Hall i.T., Austria. H. Stürzlinger and J. Zsifkovits are employees of GÖG— Gesundheit Österreich GmbH, Vienna, Austria.
The authors declare no potential conflicts of interest.
References
Supplementary Material
Please find the following supplemental material available below.
For Open Access articles published under a Creative Commons License, all supplemental material carries the same license as the article it is associated with.
For non-Open Access articles published, all supplemental material carries a non-exclusive license, and permission requests for re-use of supplemental material or any part of supplemental material shall be sent directly to the copyright owner as specified in the copyright notice associated with the article.