
Abstract
Some patients hate taking medicines, some do not mind, and others value the sense of safety medicine provides.1,2 Drug benefits and side effects can vary between people in rate and severity. Side effects can be discovered after years of use. 3 Ideally, clinicians would encourage preventive medicines in patients who are particularly likely to benefit from them and discourage them in low-benefit patients. But it is possible that each individual patient’s values and concerns about medication burden could make the difference between encouraging or discouraging the net benefit of a given drug.4,5 While there is research on ways to incorporate patient preference into care, it has not consistently entered regular practice or clinical policy. Clinical practice guidelines and quality measures, in particular, often include phrases like “patient preferences should be considered,” but we know of no major guidelines that explicitly addresses how knowledge of individual variation in these treatment burdens (also called disutilities, here used to represent all costs, predictable side effects, and unpredictable adverse events) should alter how medications are prescribed.
One circumstance where treatment burden could alter prescribing is in blood pressure (BP) control. BP control is one of the best ways to reduce cardiovascular disease (CVD), the leading cause of morbidity and mortality in high-income countries. 1 In spite of this, many patients average well over 300 years of use before one CVD event is prevented, making even small treatment burdens potentially important.6,7 BP medications also vary substantially in their side effects, causing an additional heterogeneity in treatment disutility.
We examined how much true variation in patient treatment burden should influence use of antihypertensive medicines and how much clinicians’ misunderstanding their patients’ values could lead to decisions that are not right for that individual patient. We used a Markov Decision Process to determine optimal hypertensive medication use and to examine different possible outcomes.
Methods
We used a nationally representative distribution of CVD risk factors derived from NHANES III (National Health and Nutrition Examination Survey III), which is a large probability sample of the US population sample with detailed clinical information. 8 We used this data set (conducted from 1988 to 1994) because BP treatment was much less common in that era, which created a more accurate sample population for comparing BP treatment strategies. We created a sample population of 10,000 people randomly selected from the US population using the method of imputation of chained equations. We then parameterized a Markov chain model that could estimate the clinical effects of different amounts of BP treatment in terms of BP, events averted, or QALY (quality-adjusted life-year) change based on randomized trials and preexisting data. 4 We established different possible amounts of treatment burden and defined both true treatment burden (what the patient experiences) and perceived treatment burden (what the clinician believes the patient’s burden to be). For BP medications, severe side effects tend to lead to stopping the medication and starting a different class. Therefore, we primarily estimated more mild side effects and burdens, such as peripheral edema, frequent urination, out-of-pocket costs, or the very common dislike of the inconvenience of taking medications. 2 Estimates of variation in treatment disutility were derived from Hutchins and others, 2 which found a mean disutility of 0.006 QALYs per year. These values were tested in sensitivity analyses, since they are both not definitive data and somewhat inherently subjective.
A Markov Decision Process (MDP) model was used to estimate the net QALY benefit from BP treatment if the clinician used the true patient burden to guide care and the net benefit if the clinician’s perceived patient burden diverges from the true patient burden. The MDP model recommends decisions that maximize expected QALYs for each patient using the clinician’s perceived treatment burden, thus estimating the best care that the clinicians could provide if the only limitation is their uncertainty about the patients’ (true) treatment burden. We then compared the estimated QALYs when decisions were made on perceived treatment burden compared to the QALYs obtained using the patient’s true treatment burden. The details of the population model and the references for the source data are included in the Supplementary Appendix.
Untreated event rates were estimated using the Framingham score. The probability of a CVD event being fatal was estimated using published data and varied based on age and gender; details are included in the Supplementary Appendix. Reduction in CVD events with treatment was based on a large meta-analysis of clinical trials. Addition model details are described in depth in the Supplementary Appendix.
Sensitivity Analyses
In sensitivity analyses, we examined a series of subjective or uncertain parameters, including the following: 1) the definition of mistreatment, 2) the discount factor, 3) the mortality scaling factor (the amount that a first CVD event increases the likelihood of future CVD events, which is uncertain in the literature), 4) a Gaussian distribution of both perceived and true burden, and 5) the clinical implications of what happens if underestimating a patient’s true burden makes that patient less likely to take the medication, with a maximum adherence loss of 30%.
Results
We present quality of life weights in Table 1 and key attributes of the simulated study population in Table 2, which mirrors the age 40 to 85 American primary CVD prevention population in the absence of BP treatment.
Quality of Life Weights a
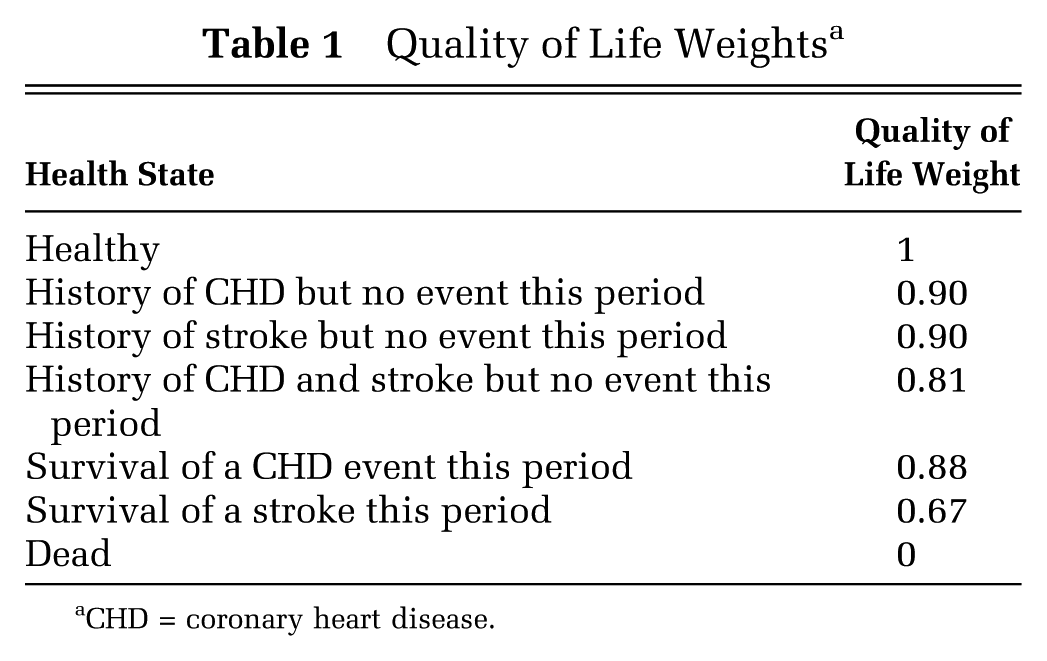
CHD = coronary heart disease.
Basic Demographic Profile a

SBP = systolic blood pressure; HDL = high-density lipoprotein; TC = total cholesterol.
BP medications reduce more CVD events in older and higher CVD risk patients (Table 3). As provider-perceived treatment burden increases, the number of patients for whom a clinician would recommend treatment would decrease and therefore the number of CVD events and QALYs prevented would also decrease.
Implications of True and Clinician-Perceived Treatment Burden on Prescribing and Outcomes a

BP = blood pressure; CV = cardiovascular; N/A = not applicable; QALY = quality-adjusted life year.
Treated requires at least 5 medication/years over 10 years.
Compared to no treatment.
Incorrect treatment requires a difference of at least an average of 0.5 medications per year. Lightly shaded boxes represent overtreatment (below the diagonal) and unshaded boxes represent undertreatment. Total QALYs saved by correct treatment (clinician’s perceived treatment burden = patient’s true burden) ranged from 304 when treatment burden was zero to 192 when treatment burden was 0.01.
However, if the clinician misestimates the patient’s treatment burden, the harm on QALYs saved by treatment can also be large. Error in a clinician’s estimates of treatment burden leads to substantial losses of total QALYs across the population, with both over- and undertreatment reducing net patient benefit. The potential QALYs saved if a provider thinks a patient has a treatment-related disutility of 0.01, but actually they have none at all, is 279 per 1,000 people (compared to no treatment). However, if the provider makes decisions knowing the patient has no disutility, treatment could save 304 QALYs per 1,000 people. Similarly, if the provider makes decisions assuming the patient has no disutility, but the disutility is actually 0.01 QALYs per year, their decisions could save 172 QALYs per 1,000 people instead of 192 QALYs per 1,000 people if care were ideal (Table 3).
Overall, up to 29% of all patients are subject to potential mistreatment based on misunderstanding a patient’s disutility (Figure 1). Those with the greatest probability of mistreatment are those at intermediate to high risk, defined as 10-year CVD risk between 10% and 30%.
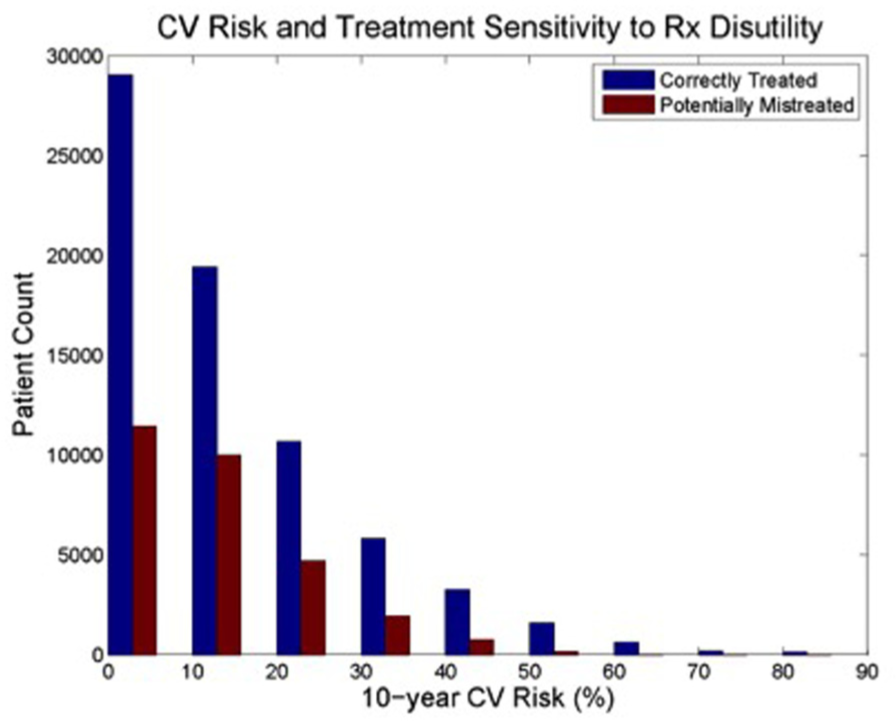
Cardiovascular (CV) risk and treatment sensitivity to treatment disutility.
The trends are the same in the sensitivity analyses (Table 4). Changing the amount of deviation from correct treatment for labeling the patient as mistreated alters the number of people mistreated, but has no effect on QALYs. Increasing the discount rate dramatically alters the overall possible benefit of treatment, but does not substantially change the impact of a clinician misestimating a patient’s disutility. Altering the estimate of how much a first, nonfatal CVD event increases the likelihood of a future, fatal one did not substantially change the impact of misestimation. Assuming there is a normal distribution of perceived and true treatment burden substantially increased the importance of correctly understanding a patient’s treatment burden.
Sensitivity Analyses a

QALY = quality-adjusted life year; CV = cardiovascular. All values are QALYs lost due to misestimation of treatment (QALYs per 1,000 people). Values on the diagonal are always zero since true and perceived burdens are equal.
Most dramatically, if a clinician underestimating a patient’s true burden makes that patient less likely to take a medication, this would dramatically alter the true benefit and outcomes of treatment. If, for example, a provider prescribing as though a patient has no treatment burden (when their true burden is 0.01 QALYs) causes a patient to take their medicine less reliably (because they do not agree with the prescription), then 85.3 QALYs per 1,000 people could be lost (Table 4).
Discussion
We found that either ignoring or substantially misestimating patient-perceived treatment burden will result in misuse of antihypertensive medications for up to 30% of American adults. We also found that clinicians’ ability to accurately gauge that patient treatment burden can be a major cause of patients receiving treatments that are or are not, on net, beneficial.
Strengths of our study include the novel examination of how treatment-related harm varies between individuals and the advanced Markov model with high-quality underlying data.
This study is limited by the conceptual and practical problems difficulties estimating patient-perceived treatment burden. Patient-perceived treatment burden is inherently subjective, like all measures of quality of life, and there are no practical tools to quantify treatment burden for clinical practice. For now, clinicians should consider treatment burden qualitatively using informed shared decision making.
In spite of these difficulties, health care systems could make progress on this issue right now. Guidelines and clinical practice should stop using dichotomous recommendations, which leave no room for shared decision making. Instead, they should include “gray zones” in care.9,10 For some people, like those with very high BP or a recent heart attack, intensive treatment should be strongly encouraged. For those with low chance of benefit, it should not be offered. For the large group in the middle, care should be especially patient driven.
In addition, the next generation of clinical decision support tools should help patients and clinicians with these complex decisions. These could involve personalized risk-benefit equations, like those that went into this model, and survey instruments that help recognize and clarify a patient’s specific treatment burden and values. 11
Our findings show that good care depends on understanding a patient’s values and subjective experience with a treatment. We showed that clinical decisions that fail to account for patient treatment burden will mistreat a large number of patients and that prescribing success is closely dependent on a clinicians’ ability to accurately gauge a patient’s treatment burden. Currently we do neither.
Footnotes
Financial support was provided via grants from the Department of Veterans Affairs HSR&D (IIR 06-253 and CDA 13-021), the Michigan Center for Diabetes Translational Research (NIDDK of the National Institutes of Health [P60 DK-20572]), and the National Science Foundation (CMMI-1552545). The funding agencies were not involved in the design and conduct of the study; the interpretation of the data; in preparation, review, or approval of the manuscript; or in the decision to submit the manuscript for publication. All data used in this article are from the National Health and Nutrition Surveys, which is publicly available or directly included in the article. All analyses are available on request.
References
Supplementary Material
Please find the following supplemental material available below.
For Open Access articles published under a Creative Commons License, all supplemental material carries the same license as the article it is associated with.
For non-Open Access articles published, all supplemental material carries a non-exclusive license, and permission requests for re-use of supplemental material or any part of supplemental material shall be sent directly to the copyright owner as specified in the copyright notice associated with the article.