
Abstract
Modern chemotherapy agents transformed standard care for metastatic colorectal cancer (mCRC) but raised concerns about the financial burden of the disease. We studied comparative effectiveness of treatment plans that involve up to three lines of therapies and impact of treatment sequencing on health and cost outcomes. We employed a Markov model to represent the dynamically changing health status of mCRC patients and used Monte-Carlo simulation to evaluate various treatment plans consistent with existing guidelines. We calibrated our model by a meta-analysis of published data from an extensive list of clinical trials and measured the effectiveness of each plan in terms of cost per quality-adjusted life year. We examined the sensitivity of our model and results with respect to key parameters in two scenarios serving as base case and worst case for patients’ overall and progression-free survivals. The derived efficient frontiers included seven and five treatment plans in base case and worst case, respectively. The incremental cost-effectiveness ratio (ICER) ranged between $26,260 and $152,530 when the treatment plans on the efficient frontiers were compared against the least costly efficient plan in the base case, and between $21,256 and $60,040 in the worst case. All efficient plans were expected to lead to fewer than 2.5 adverse effects and on average successive adverse effects were spaced more than 9 weeks apart from each other in the base case. Based on ICER, all efficient treatment plans exhibit at least 87% chance of being efficient. Sensitivity analyses show that the ICERs were most dependent on drug acquisition cost, distributions of progression-free and overall survivals, and health utilities. We conclude that improvements in health outcomes may come at high incremental costs and are highly dependent in the order treatments are administered.
Colorectal cancer (CRC) is the third most commonly diagnosed cancer and the third leading cause of cancer-related deaths in the United States. 1 About 20% of the new cases are diagnosed after the disease metastasizes to distant organs, and metastatic CRC (mCRC) has significantly lower survival rates than localized CRC.1,2
Chemotherapy is the most prevalent treatment option for mCRC patients. Chemotherapy is a systemic treatment, that is, it works throughout the whole body of the patient, capable of killing metastasized cancer cells, and is administered either alone or combined with other forms of treatment such as targeted therapy that block the growth and spread of cancer by interfering with specific molecules. The main distinction between chemotherapy and targeted therapy is that chemotherapy kills all cells that proliferate faster—incapable of distinguishing between cancer cells and normal cells—whereas targeted therapy kills predominantly cancer cells that express a specific target.
Development of new cytotoxic drugs and monoclonal antibodies has drastically changed the standard care for mCRC patients in the past two decades. Prior to the approval of irinotecan and oxaliplatin, 5-fluorouracil (5-FU)—an antimetabolite drug developed in the 1950s—was the only Food and Drug Administration (FDA)–approved drug for mCRC patients. 3 Median overall survival (OS) was around a year for mCRC patients when 5-FU was used in combination with leucovorin—a form of folic acid—forming the combination regimen LV5FU.3,4 In fact, invention of LV5FU was shortly after followed by the discovery of more effective regimens. Large randomized clinical trials showed that FOLFIRI (formed by the addition of irinotecan to LV5FU) and FOLFOX (formed by the addition of oxaliplatin to LV5FU) may significantly improve OS for mCRC patients.4,5 On the other hand, capecitabine, an oral fluoropyrimidine, was shown to be comparable with LV5FU in terms of OS and progression-free survival (PFS) with superior response rates. 6 Recent clinical trials also report that the combination of FOLFOX and FOLFIRI with targeted therapies, such as the monoclonal antibody bevacizumab, which we will refer to as “bev.” in short hereafter, further prolongs survival for mCRC patients.7–9 These advances in mCRC treatment not only extended the median postdiagnosis life span for mCRC patients to roughly 2 years but also implied improvements in their quality of lives.10–12 As a natural consequence of recent advancements and discovery of a wide array of regimens, the impact of drug sequencing on patient response and efficiency of treatment plans are subjects of recent debates among the expert panels but are studied only to a limited extent. 13
Increasing costs of modern systemic therapies, often referred to as the “financial toxicity,” along with the improvement in long-term survival of mCRC patients, have also raised concerns regarding the financial performance and the cost-effectiveness of available treatment regimens.14–17 Chemotherapy agents and targeted therapies are listed among the most expensive medical interventions contributing to a projection of more than $17 billion annual cost of CRC treatment in 2020. 18 Therefore, there is a growing interest in the medical community to analyze the cost-effectiveness of existing and emerging chemotherapy regimens for mCRC19–29 and to identify those patients that survive with reasonable cost and higher quality of life. Majority of these analyses focus on the cost-effectiveness of single regimen when administered at a particular line of treatment. Recent findings empirically demonstrate that patients’ survival outcomes are amplified when they are exposed to as many chemotherapy agents as possible rather than just a single agent.12,13,30 Therefore, given the abundance of chemotherapies, comparative effectiveness analysis of entire treatment plans involving multiple lines of treatments calls for further research.
The objectives of this study are twofold. First, consistent with guidelines, we study the efficiency of treatment plans that administer mCRC patients up to three lines of treatment. From a hypothetical central planner’s perspective, we compare the overall cost of treatment plans versus their aggregate health outcomes rather than focusing on the performance of two particular therapies given for a fixed line of treatment. Our second goal is to evaluate the effect of drug sequencing on the economic value of treatment plans. In particular, we test how treatment plans are affected when the constituent regimens of the same treatment plans are administered in different orders, that is, how permutations of same regimens impact the efficiency of a treatment plan.
Methods
We developed a Markov model the state of which represents a patient’s treatment history in terms of prior regimens used, his/her health status in terms of disease progression, and the number of adverse events (AEs) he/she experienced under the current regimen. We compared the cost and health outcomes of all treatment plans consisting of FDA-approved regimens. We calibrated the model using 2014 Medicare & Medicaid cost estimates in US dollars and the reported OS, PFS, and AE data from published clinical trials. All costs and health outcomes were discounted at a 3% annual rate. We simulated the Markov model in MATLAB and performed statistical analyses such as fitting distributions to the survival meta-data in R.
Markov Model
We compared the health outcomes in quality-adjusted life year (QALY) and costs of all treatment plans that are consistent with guidelines that involve three or fewer lines of therapy, over a 10-year-long time horizon, a period long enough to accurately capture the tail of the survival distribution of mCRC patients, using a Markov model as depicted in Figure 1. We permanently discontinued a regimen when it led to disease progression, or two severe AEs (i.e., Grade 3+ event, according to the Common Terminology Criteria for Adverse Events 31 ). Discontinued treatments were not reintroduced into the treatment plan. Following any AE, the regimen in use was temporarily paused and a 2-week chemotherapy break was enforced to wash out the toxic effects from the AE. The patient was not assumed to take optional chemotherapy breaks between successive lines of treatments; however, upon discontinuation of the third line of therapy he/she was assumed to remain off treatment in palliative care subject to no relevant cancer therapies until death. We also assumed the patient did not experience any AEs when he/she was off treatment, that is, either during the mandatory chemotherapy breaks after experiencing an AE or in palliative care after the third line treatment.
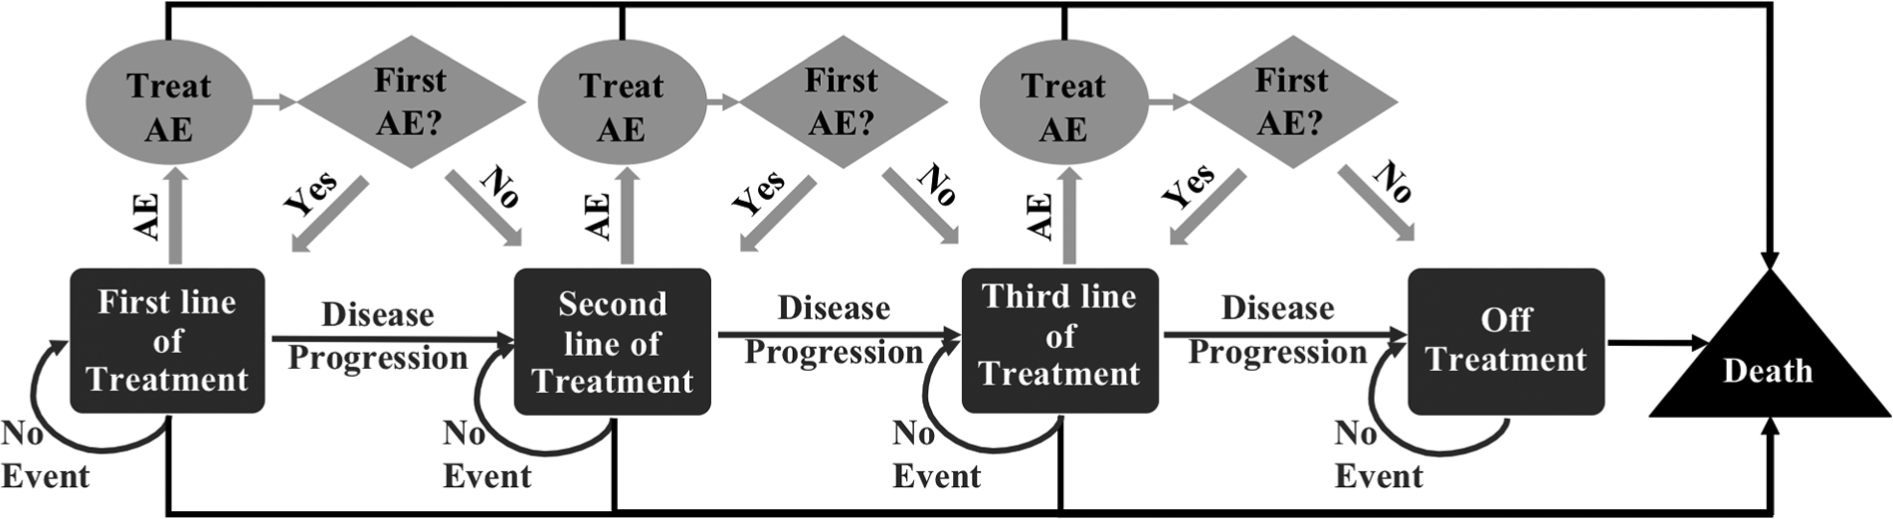
Markov model and evolution of the treatment process. AE = Grade 3+ adverse event; mCRC = metastatic colorectal cancer.
Data Sources and Calibration
We utilized published clinical trials that report various effectiveness metrics of several chemotherapy drugs and targeted therapies on multiple cohorts to build a comprehensive patient-, disease-, and treatment-specific database.
Since clinical trials test a variety of treatment methods with different outcome measures, we identified a set of filtering rules to construct the database. We list the four main criteria that all had to be satisfied for inclusion of a report or publication into our database:
Primary tumor was in either the colon or rectum
Cancer was staged as advanced or metastatic
The trial was of Phase II, III, or IV
Chemotherapy alone or combined with targeted therapy were the only administered treatments
We excluded all trials from consideration if they satisfied any of the following criteria:
Administered other forms of treatment in combination with chemotherapy (e.g., radiotherapy)
Published prior to year 2000
Written in a non-English language
Searching for the keywords “colorectal cancer” OR “colon cancer” OR “rectal cancer” in the condition field at the online ClinicalTrials.gov registry and selecting only phase II, phase III, and phase IV trials, as of January 1, 2014, we identified 1,009 clinical studies that formed the primary source of data for the calibration of our model. As only 80 of these trials reported their findings in ClinicalTrials.gov, we also searched other literature to identify publications reporting the findings of others. We used search engines of Google Scholar and PubMed to find out the publications that match with the official title, primary investigator, the assigned ClinicalTrials.gov identifier of the trial, and the names of the regimens tested in the trial. After reviewing the resulting pool of identified publications, we determined whether a publication indeed reported the results of the trial it was associated with. For each trial, we considered only the most recent relevant publication reporting its outcomes.
To further expand our database, we also searched and analyzed the publications that have been cited by the recorded clinical trials and satisfied the aforementioned inclusion criteria. A complete list of the publications used to construct our database can be found at the website of Iakovos Toumazis. 32 A descriptive summary of the characteristics of the subject populations studied by the publications in our database is presented in Table 1.
Descriptive Summary Statistics of the Database Constructed From the Clinical Trials and Publications Reporting Their Outcomes

Patients and Treatment Regimens
We simulated the dynamically evolving health condition of a mCRC patient according to our Markov model where all events, that is, disease progression, AEs, and death, were assumed to occur at weekly spaced time points. To conduct comparative effectiveness and probabilistic sensitivity analyses (SAs) we collected 10,000 simulated replications of the treatment process under each treatment plan.
We utilized our database to estimate the distributions of the efficacy end-points of eight individual FDA-approved chemotherapy regimens each of which is also clinically acceptable according to National Comprehensive Cancer Network’s (NCCN) guidelines (Table S1).33,34 All of the regimens we considered are combination therapies and administered with or without targeted therapies. For each regimen included in our database, there were at least 10 clinical trials reporting PFS, OS, or AE outcomes. To estimate the necessary effectiveness parameters of each regimen, we used the outcome metrics that were associated with the arm of the clinical trials administering that particular regimen. Moreover, we assumed the PFS and OS under each regimen depend only on the current line of use but did not distinguish the lines for previously treated patients; that is, for each regimen the PFS and OS distributions are assumed to show no variation beyond the first line of treatment independent from the history of previously administered treatments (Table 2).
OS, PFS, and Time to AE Distributions (in Months) for Base- and Worst-Case Scenarios.

Note: OS = overall survival; PFS = progression-free survival; AE = adverse event; Ln(µ, σ 2 ) = lognormal distribution with location parameter µ and scale parameter σ; W(λ, κ) = Weibull distribution with scale parameter λ and shape parameter κ; Γ(α, β) = gamma distribution with shape parameter α and scale parameter β; Geo(p) = geometric distribution with incidence rate p.
Our analyses consider only treatment plans that are consistent with the NCCN guidelines such that if drug resistance develops on a chemotherapy agent, then our model disallows the administration of all regimens including that particular agent in all subsequent lines. For instance, if the patient experiences disease progression under FOLFOX, which includes oxaliplatin, then he/she cannot utilize CAPOX as it involves oxaliplatin, too. In addition, we do not restrict regimens to specific line of therapies, that is, all regimens are eligible in all lines of treatment. Note that CapeIRI is included in our analyses owing to the fact that it is approved by the European Medicines Agency in Europe. 35
Assumptions
In reality, during the course of treatment, patients endure different grades of AEs, which indeed require alterations in the treatment plan. These modifications may include reductions in the drug dosage, lessening the frequency of administration, and/or temporary or permanent discontinuation of treatment. We modeled chemotherapy-related toxicity by means of the occurrence of a severe (Grade 3+) AE. We assumed that all incidences of AEs are followed by a prespecified length of mandatory breaks from chemotherapy to treat the symptoms of the occurring AE, and treatments were permanently discontinued if they lead to two severe AEs. We assumed that the impact of less severe AEs on health outcomes were captured by means of patients’ health utilities in the model but have not considered their economic impacts on the results.
In our model at the end of each treatment cycle, conditional on surviving from death, the patient is assumed to experience either an AE, or a disease progression, or neither; that is, simultaneous occurrences of AEs and disease progression are assumed to be negligible.
Although different chemotherapy regimens have different toxicity profiles and tolerance limits against AEs depend on the individual patient physiology, treatment- and line-specific utility estimates are not available in the literature. Therefore, we utilized the average health utilities under chemotherapy before and after disease progression that are reported by Ramsey and others36,37 and assumed that such utilities apply to all regimens we considered across all possible three lines.
Estimating OS and PFS Distributions
We used our database to dress the available median OS and median PFS data of each regimen by a probability distribution. We considered Gamma, Weibull, and Lognormal distributions as candidate parametric representations for PFS and OS, and chose the one with the highest Anderson-Darling goodness-of-fit test statistic. 38 We estimated the parameters of the distributions using the maximum likelihood estimation method. Table 2 presents the OS and PFS distributions along with their respective parameters for each regimen and for patients who need to stay off-treatment after utilizing all possible lines of therapy.
For any regimen
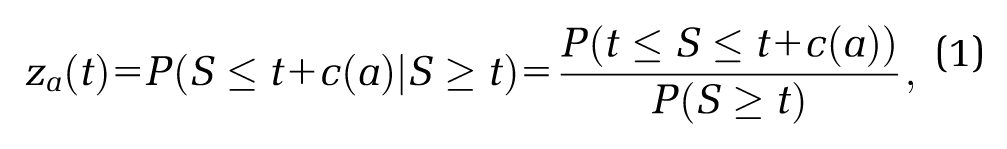

In Equations (1) and (2), random variables
Estimating the AE Incidences
The incidence rate of AEs differs between the first-line and subsequent lines of treatment (Table 2) with consistently higher rates in pretreated patients. In line with the reports indicating low toxic accumulation in the FDA-approved drugs for mCRC, 39 we assumed that the line-specific AE incidence rate does not change by time (i.e., time to AE follows a geometric distribution). Therefore, for each regimen, we first calculated the line-specific occurrence rate of severe AEs as the reciprocal of the sample mean number of severe AEs per patient per month and adjusted the resulting incidence rates proportionally with the length of the treatment cycle of each regimen. To calculate the unconditional occurrence probabilities of commonly reported AEs—namely, diarrhea, nausea and vomiting, neuropathy, hand-foot syndrome, neutropenia, febrile neutropenia, hemorrhage, hypertension, and gastrointestinal perforation—per cycle, we employed Bayes’ rule given the occurrence probability of any AE we considered and the conditional incidence rates of each type of AE under each regimen. Based on this adjustment, for instance, under a particular regimen a the likelihood of incurring a diarrhea event per cycle is calculated as

The list of particular AEs as well as probability distributions indicating the incidence rates of each specific AE conditional on the occurrence of an AE, that is, the second component in the expression above, was derived based on the findings from four clinical trials (Table S2).3,40–42
Health Utilities
We used the literature to adjust for patients’ health utilities in all states of the process based on their status of disease progression and being in palliative care. In particular, the patient’s preprogression health-related quality of life was adjusted by a utility factor of 0.85, and postprogression quality of life was adjusted by a utility factor of 0.65 until the initiation of palliative care.36,37 The lifetime spent in palliative care was adjusted by a health utility of 0.25. 43 Besides the utilities that vary with patient’s disease progression status and treatment history, health utilities that adjust the patient’s quality of life during the mandatory chemotherapy breaks that wash out the toxic effects of AEs are derived from the literature and presented in Table S2.43–46
Cost Estimates
Our analyses consider only direct medical costs associated with treatments: drug acquisition cost (in short drug cost in the rest of the article), drug administration cost (shortly administration cost in the rest of the article), and AE treatment cost. We used the average sales price of each drug from the 2014 Centers for Medicare and Medicaid Services (see Table S3) 47 and the dosage levels proposed by current guidelines to determine the drug costs. 33 We assumed the doses for a prototype patient profile with 1.86 m2 body-surface area and 82 kg weight. 19
Administration cost refers to the cost incurred due to intake of treatments in therapy sessions and was calculated using the 2014 Medicare physician fee schedule for each regimen 48 (Table S3). We obtained the administration duration of each regimen according to the recommendations of NCCN guidelines. 33
We employed the Grade 3+ AE treatment costs from existing studies particular to CRC patients, 49 except for the case of neutropenia. For neutropenia, we utilized the literature on non–small cell lung cancer assuming that treating a single incidence of neutropenia costs same for mCRC patients and non–small cell lung cancer patients. 50 All costs were assumed to be nonfluctuating throughout the 10-year time horizon.
Sensitivity Analyses
To address how potential unilateral variations in model parameters may influence the incremental cost-effectiveness ratios (ICERs) and to evaluate the robustness of outcomes to our model settings, we conducted a series of univariate SAs. First, to create a worst-case setting for OS and PFS, we reestimated their distributions by considering the reported lower bounds of their 95% confidence intervals in our database as input data. We varied the probabilities of experiencing severe AEs within ±5% of their baseline values. We also tested the sensitivity of the results by altering the utilities associated with patient’s disease progression status by 0.1 from their baseline and the utilities associated with each type of AE within ±20% of their baseline values. Sensitivity with respect to cost terms was studied by ranging the drug and administration costs by 20% from their baseline values in both directions and altering the cost of AEs to the end points of the ranges reported for them in the literature (Table S2).49,50
We investigated the impact of time value of health and cost outcomes by running the model under an undiscounted setting and with a 5% annual discount rate. Last but not least, to measure the sensitivity of the results with respect to toxicity tolerance set in the model, we changed the duration of enforced chemotherapy breaks due to AEs to 1 and 3 weeks, as well as the number of AEs causing permanent treatment discontinuation to one and three AEs. In addition to such univariate sensitivity analyses, via Monte-Carlo simulation, we computed the efficiency likelihoods of treatment plans that are efficient based on mean cost per QALY metric. Making use of the results from simulation runs, we also constructed cost-effectiveness acceptability curves (CEAC) to assess the behavior of the cost-effectiveness of efficient treatment plans with respect to varying ICER thresholds when compared to the least costly efficient treatment plan in the base- and worst-case scenarios.
Results
We compared the QALYs and costs of up to three lines of clinically acceptable treatment plans. In total, we compared 178 treatment plans and identified efficient frontiers based on mean cost per QALY for our base-case (Figure 2) and worst-case (Figure 3) scenarios. Recall that base- and worst-case scenarios share the same setting for all parameters but the distributions of OS and PFS. Results and details from the efficient treatment plans will be the focal point of the discussion in the rest of this section.

Efficient frontier of treatment plans based on mean incremental cost per incremental QALY gained per patient compared to LV5FU, and their efficiency likelihoods in the base case. The treatment plans denoted by crosses are subject to weak (extended) dominance of two or more treatment plans but are not dominated by any other single treatment plan. bev. = bevacizumab; CapeIRI = capecitabine and irinotecan; CAPOX = capecitabine and oxaliplatin; FOLFIRI = 5-fluorouracil, leucovorin, and irinotecan; FOLFOX = 5-fluorouracil, leucovorin, and oxaliplatin; LV5FU = 5-fluorouracil and leucovorin; QALY = quality-adjusted life year.

Efficient frontier of treatment plans based on incremental cost per incremental QALY gained per patient compared to LV5FU–CAPOX–CapeIRI and their efficiency likelihoods in the worst case. The treatment plans denoted by crosses are subject to weak (extended) dominance of two or more treatment plans but are not dominated by any other single treatment plan. The two bottom figures display a magnified view of the areas (A) and (B), which are marked with shaded circles in the top figure. bev. = bevacizumab; CapeIRI = capecitabine and irinotecan; CAPOX = capecitabine and oxaliplatin; FOLFIRI = 5-fluorouracil, leucovorin, and irinotecan; FOLFOX = 5-fluorouracil, leucovorin, and oxaliplatin; LV5FU = 5-fluorouracil and leucovorin; QALY = quality-adjusted life year.
The efficient frontier for base-case analysis consisted of seven treatment plans. It can be noticed that, as the regimen with lowest acquisition cost per cycle, LV5FU appeared in differing lines of all but most expensive efficient treatment plans. Among the efficient treatment plans, one administers a single line of therapy and one prescribes two lines of therapies whereas all others administer three lines of therapies. The only efficient single line treatment plan involved LV5FU and yielded QALYs between 0.17 and 1.86 (0.23–5.54 life-years) at a total cost ranging between $1,075 and $21,132. The only efficient treatment plan with two lines of therapies administered LV5FU in the second line preceded by FOLFOX in the first line and yielded 0.20 to 3.02 QALYs (0.23–7.75 life-years) at a total cost between $6,925 and $40,218. The remaining five treatment plans of the efficient frontier, which all consisted of three lines of therapies, are listed below with the ranges of health benefit they generate and the resulting cost.

In our worst-case analysis, the efficient frontier consisted of five treatment plans as shown in Figure 3. The efficient frontier under the worst-case scenario showed substantial differences compared with that of the base case. First, in the worst case, the expected QALYs gained was less than a year under all efficient treatment plans. In addition, the total expected cost for each of the efficient treatment plans was below $55,000. More interestingly, FOLFOX was not only efficient as a single line of treatment itself but also appeared as the first line of therapy in almost all multiple-line treatment plans except the least costly one. While the worst-case scenario has fewer treatment plans with three lines of therapies than the base case, a commonality between the results of base- and worst-case scenarios is that only the most expensive efficient treatment plan administered bevacizumab, and in both cases, it generated low incremental survival outcome when compared with its adjacent treatment plan of the corresponding efficient frontier (0.19 and 0.11, respectively). However, such extensions came at an incremental cost of $87,000 and $35,000 in the base case and worst case, respectively, when compared with the same adjacent treatment plans on their respective frontiers.
Our derivation of efficient frontiers involves treatment plans that are not subject to extended dominance (often referred to as weak dominance), that is, those that are not ruled out even if they are compared with appropriate combinations of other treatment plans. Besides the frontiers based on extended dominance criterion, we also derived efficient treatment plans based on the notion of strong dominance with respect to QALYs and cost. Such treatment plans are often referred to as weakly dominated since they are not ruled out as inefficient based on a head-to-head comparison with any other single treatment plan but are ruled out by appropriate combinations of two or more appropriate treatment plans. We figured that there were 8 and 12 weakly dominated treatment plans in the base- and worst-case scenarios, respectively. The health outcomes and costs associated with the weakly dominated treatment plans in our analyses are available in the supplementary material.
In Table 3, we present the ICERs in the base case. Since LV5FU is the least costly efficient treatment plan in the base case, we also explored the sensitivity of the ICER values when LV5FU was compared against all other efficient treatment plans. Results show majority of the efficient treatment plans are cost-effective under a $100,000 willingness to pay threshold except the treatment plan (FOLFOX + bev.)–(FOLFIRI + bev.)–CAPOX, which had an ICER above $100,000. When we considered a willingness to pay threshold of $50,000, four treatment plans were cost-effective against LV5FU. Table 3 also displays the ICERs between all successive pairs of efficient treatment plans when they are sorted in ascending order of cost/QALY ratios in the base case. Only two treatment plans appeared to be cost-effective under both of the widely acknowledged willingness to pay thresholds in such comparisons. The remaining four comparisons turn out to be cost-ineffective with ICERs above $100,000. More specifically, for the treatment plans that were cost-effective against their predecessors on the efficient frontier, FOLFOX–LV5FU had an ICER of $26,260 against LV5FU, and FOLFOX–LV5FU–FOLFIRI had an ICER of $43,435 when compared with FOLFOX–LV5FU.
Mean Cost and Health Outcomes for Efficient Treatment Plans in the Base Case

Note: ICER = incremental cost-effectiveness ratio; QALY = quality-adjusted life year; NA = not applicable; LV5FU = 5-fluorouracil and leucovorin; FOLFOX = 5-fluorouracil, leucovorin, and oxaliplatin; FOLFIRI = 5-fluorouracil, leucovorin, and irinotecan; CapeIRI = capecitabine and irinotecan; CAPOX = capecitabine and oxaliplatin; bev. = bevacizumab. The cells with an ICER less than $50,000 are light-shaded, and those with an ICER between $50,000 and $100,000 are dark-shaded.
Least costly efficient treatment plan: LV5FU.
Cost <$100.
To assess the influential cost components of the model, we computed the breakdown of the total cost with respect to individual lines of therapy and with respect to different cost elements. In order to gauge the added benefits of subsequent lines of treatments to patients, we also calculated the percent utilization rates of each line of therapy as the proportion of patients that survived until the initiation of that particular line. As illustrated in Table 3, drug and administration costs accounted for most of the total cost, whereas the share of AE treatment cost was insignificant. Expectedly, combinations of chemotherapy regimens with targeted therapy (i.e., bevacizumab) accounted for the largest share of drug cost of their respective treatment plans. In terms of average durations, intuitively, in all efficient treatment plans except CapeIRI–LV5FU–CAPOX, the average first-line treatment duration was substantially longer than the second and third lines of treatments. Due to substantial variation in costs of treatments, it is hard to generalize a correlation or pattern between the duration of a line of treatment and the costs accrued during that particular line of treatment. In addition to the average duration of each line of treatment, we examined the proportion of patients utilizing each particular line of therapy in each one of the efficient treatment plans. In the base case, all efficient treatment plans demonstrated high utilization rates, with 90% of the patients exposed to all lines of treatment. In the worst case, under the efficient treatment plans that are expected to survive the patients longest, the second- and third-line treatment utilization rates dropped significantly to 85% and 67%, respectively (see Table S4).
Table 3 also illustrates the effect of drug sequencing on the effectiveness and cost of treatment plans. When we compared the treatment plan consisting of FOLFOX–CapeIRI–LV5FU against FOLFOX–LV5FU–CapeIRI, the ICER was more than $175,000 per QALY gained. In a more-detailed setting, as demonstrated in Table 4, we examined the performance of treatment plans consisting of three lines of therapies with respect to the order of administration of their respective regimens. Although not always the case, administering the same regimens in a different order significantly altered the effectiveness of a treatment plan. Our results indicate that the differences could be as much as 0.8 QALYs in health outcomes and more than $60,000 in the aggregate cost of treatment plan when the regimens are used in different orders as in cases of FOLFOX–(FOLFIRI + bev.)–LV5FU and (FOLFOX + bev.)–FOLFIRI–LV5FU, respectively.
Range in Expected Cost and Health Outcomes (the Difference Between the Maximums and Minimums of the Corresponding Outcomes) When the Regimens of the Clinically Acceptable Treatment Plans Consisting of Three Different Therapies Are Administered in Different Orders

Note: QALY = quality-adjusted life year; FOLFOX = 5-fluorouracil, leucovorin, and oxaliplatin; FOLFIRI = 5-fluorouracil, leucovorin, and irinotecan; LV5FU = 5-fluorouracil and leucovorin; bev. = bevacizumab; CapeIRI = capecitabine and irinotecan; CAPOX = capecitabine and oxaliplatin.
To characterize the toxicity profiles of each one of the treatment plans that we considered, we also recorded the time of each AE as well as the total count of AEs. In cases where a patient died prior to experiencing an AE, we considered the recorded time of death as the time of the first AE. In our experiments, the average expected number of AEs induced by the efficient treatment plans was less than 2.5. Furthermore, the average time between two consecutively experienced AEs was no less than 9 weeks in any of the efficient treatment plans.
The results from our SAs comparing the ICER between LV5FU (the least costly efficient treatment plan in the base case) and the treatment plan consisting of (FOLFOX + bev.)–(FOLFIRI + bev.)–CAPOX (the most expensive efficient treatment plan in the base case) are presented in the tornado diagram of Figure 4. The base-case ICER value between these two treatment plans was $152,529 and appeared to be most sensitive to the changes in the cost of chemotherapy drugs, PFS distributions, health utility in postprogression stage, OS distributions, and the number of AEs allowed per regimen, in descending order of impact. Finally, disutilities and treatment costs of AEs had the least impact on the ICER. The tornado diagram in Figure 4 also depicts the impact of using the worst-case OS and PFS distributions. Among all tested factors, in terms of the range in ICER caused by the variability of the factor, the shift in OS and PFS distributions to their worst-cases ranked second and fourth, respectively. The SAs conducted on the ICER between LV5FU (the least costly efficient treatment plan in the base case) and FOLFOX–LV5FU (the efficient treatment plan adjacent to LV5FU on the base-case efficient frontier) is available in Figure S1. Our SAs showed that changes in a single parameter do not substantially affect the ICER in that comparison, which consistently sailed below the $50,000. More explicitly, the ICER was most sensitive to changes in drug costs, postprogression health utility, and the OS distribution. Mainly due to negligible number of AEs experienced by the patients in relatively shorter life-spans, similar to the analyses when LV5FU compared to the most expensive treatment plan on the efficient frontier, changes in AE treatment costs could only affect the ICER only to a very limited extent.

Tornado diagram summarizing the sensitivity of the base-case ICER with respect to key parameters of the model when LV5FU (the least costly efficient treatment plan in the base case) is compared to (FOLFOX + bev.)–(FOLFIRI + bev.)–CAPOX (the most expensive efficient treatment in the base case). Base-case ICER: $154.4K/QALY. bev. = bevacizumab; CAPOX = capecitabine and oxaliplatin; FOLFIRI = 5-fluorouracil, leucovorin, and irinotecan; FOLFOX = 5-fluorouracil, leucovorin, and oxaliplatin; ICER = incremental cost-effectiveness ratio; LV5FU = 5-fluorouracil and leucovorin; QALYs = quality-adjusted life years.
Our derivations of efficient frontiers were based on mean incremental cost/incremental QALY ratios. To assess variability of the efficient frontiers themselves, via the sample simulation runs we collected, we also computed the efficiency likelihoods of all treatment plans again with respect to cost and QALYs in both base case and worst case. In particular, 97.75% (i.e., all but 4 out of 178) of all treatment plans were more likely to be efficient than being inefficient (i.e., had a chance of appearing on the frontier with at least 50% chance). When the nondominance chance is raised to a more aggressive threshold of 75%, a substantial percentage, 85.96%, of all treatment plans still appeared to be efficient. At more extreme nondominance chance thresholds, less than half of the treatment plans appeared to be efficient. For instance, when the treatment plans are sought to be efficient with at least 90% chance, 43.82% of them were filtered out to form the frontier that shrank to include only 20.79% of the treatment plans when the threshold efficiency likelihood was raised to 95%.
In Figure 5, we display the CEACs for all treatment plans of the efficient frontier under the base- and worst-case scenarios when they are compared against the least costly treatment plan of the corresponding frontier (LV5FU and LV5FU–CAPOX–CapeIRI, respectively). For instance, from Figure 5, when the willingness to pay threshold per QALY gained was $50,000, the two-line treatment plan FOLFOX–LV5FU was cost-effective over LV5FU with 92% chance. Under the $50,000 threshold of willingness to pay per QALY gained, four of the efficient treatment plans were found more likely to be cost-effective than LV5FU. When the willingness to pay threshold was raised to $100,000 and $150,000 all efficient treatment plans excluding the three-line treatment plan—(FOLFOX + bev.)–(FOLFIRI + bev.)–CAPOX—were more likely to be cost-effective than LV5FU. Interestingly, the only two CEACs crossing each other were corresponding to the treatment plans FOLFOX–LV5FU and FOLFOX–LV5FU–FOLFIRI with the latter being more likely to be cost-effective when the willingness to pay threshold was between $37,000 and $58,000.

Cost-effectiveness acceptability curves for the efficient treatment plans when compared with the least costly efficient treatment plan in the base case (A) and in the worst case (B).
Discussion
We developed a Markov model to assess the tradeoffs between health benefits and costs of a plethora of treatment plans for mCRC patients consistent with recent guidelines. We focused on the cost-effectiveness of treatment plans and the effect of drug sequence on the efficacy of treatment and quality of life. Our results empirically verify the benefit of exposing the patient to all active chemotherapy agents in that when combined with targeted therapies better-designed sequences of chemotherapy regimens may double the mCRC patients’ quality-adjusted survival compared to LV5FU, the former standard care for mCRC patients prior to recent advancements.
However, improvements in survival apparently come with significant costs. The unit costs of newly developed chemotherapy drugs and emerging targeted therapies are significantly higher than the costs of existing drugs. 15 Thus, adding more lines of therapy to the treatment plan substantially increases the total cost of treatment. In general, compared to a single treatment with LV5FU, treatment plans administering two lines of chemotherapy given in combination with targeted therapy (i.e., bevacizumab) appear to be cost-ineffective even with respect to the willingness-to-pay threshold of $100,000. Considering the prohibitive cost often associated with modern drugs along with the evolving field of personalized medicine dictate cautious examination of the potential benefit and costs associated with new interventions to well-defined subpopulations. Hence, findings from studies like ours can provide a reference point to initiate and guide such decisions in the near future.
Intuitively, our results verify the expectation that mCRC patients benefit from adding more lines of therapy. In particular, no treatment plan with fewer than three lines of therapies can extend the patient’s quality-adjusted survival beyond 2 years. Despite the added benefit of the third line on survival, due to mortality before reaching to the third line of treatment, the average third line treatment durations and the average third line treatment utilizations were shorter than the prior lines in majority of the treatment plans.
One of the side findings of our research is that proper sequences of drugs affect the economic value of treatment plans. Although optimizing the sequence and durations of therapies appear to be the subject of recent heated discussions among clinicians and unorthodox compared to the practice of treat-to-progression that relies on clinical trials that test the efficacy of the drugs only in particular lines with no question posed on the influence of sequencing on the efficacy of the drugs, an imminent extension of our research may attempt to investigate how the available treatments can be better utilized.11–13,51
Although the main research goal of our study was to explore the comparative effectiveness of treatment plans that do not necessarily consist of a single line of treatment, the implications of our findings are indirectly aligned with the findings of existing studies that evaluate specific regimens in head-to-head settings. For instance, consistent with published studies revealing that FOLFOX yields superior health outcomes compared to FOLFIRI at an acceptable added cost,52–54 majority of multi-line efficient treatment plans in our base- and worst-case scenarios administer FOLFOX as the first-line therapy, whereas no treatment plan administers FOLFIRI in their first-line settings. Moreover, as only one of the treatment plans administering bev. in the first or second line is found to be efficient in the base case, whereas none of those treatment plans appeared to be efficient in the worst case, our analyses partly provide supporting evidence to the studies that claimed that bev. is unlikely to be cost-effective when administered in early lines of therapy.19,21,26,55
When we compare our findings with the study of Wong and others, which also compared the effectiveness and cost-effectiveness of treatment plans for mCRC patients, we have significantly lower ICER values. 29 However, this can be explained by the differences in drug costs, given that Wong’s study used 2008 cost estimates. Our analysis disagrees with existing studies evaluating the effectiveness of capecitabine against 5-FU.23,56 When we compared the cost-effectiveness of FOLFOX versus CAPOX, we found that despite their comparable health benefit, FOLFOX is less costly than CAPOX. Note that this is attributable to the high relative cost of capecitabine compared with oxaliplatin, which has been significantly reduced in recent years.
The high sensitivity of our findings to the OS and PFS distributions can motivate the development of prognostic tests such as biomarker panels, which could predict the efficacy-based appropriateness of particular treatment plans to individual patients. For instance, it is widely known that patients with specific mutations (i.e., mutated KRAS) do not respond to drugs targeting the epidermal growth factor receptor.44–46 Therefore, studying mCRC patients in appropriately segregated subpopulations sharing demographic and genomic similarities may unmask and boost the economic value of treatment plans.
Our SAs consistently ranked health utilities in pre- and postprogression stages among the parameters that heavily affect the ICERs between the treatment plans considered. Despite the rich and still growing literature, surprisingly, at the time this study was conducted pre- and postprogression utility estimates that represent patients’ quality of life distinctly for each chemotherapy regimen were not available. Availability of such estimates would improve the accuracy of the analyses in this study.
Last but certainly not the least, majority of the differences between the results of base- and worst-case scenarios can be attributed to the fact that patients survive much shorter in the worst-case setting and this renders the utilization of subsequent lines of treatments unlikely beyond the first line.
Limitations
Our study has some limitations primarily arising from data availability. First and foremost, our calibration rests on a wide meta-analysis of published clinical trials and lacks raw patient-level data. In the absence of such desired data, the distributions marking the three main events of the process are all estimated from the reported medians in the literature. More explicitly, taking advantage of the variation in the median outcomes across the reports and publications in our database, we first fit distributions to the collected medians of those end-points, and substitute them with the distributions of the end-points themselves. Since patients enrolled to clinical trials are typically in better health condition than the overall population, the outcomes reported from clinical trials may not well represent the health of the subject cancer population in reality. Therefore, our results should be cautiously generalized to comment on the broader mCRC population.
Another layer of limitation, again related to the estimation of the distribution of end-points, is that clinically the survival, disease progression, and toxicity do all depend on the exact order the regimens are administered in a treatment plan. Due to limited data, we were able to distinguish the end-point distributions only with respect to patients’ pretreatment status, that is, first line or subsequent lines, rather than a more desired line-specific and history-dependent approach. On the other hand, we note that our analyses do not consider the drug monitoring costs, which may involve costs due to nursing and outpatient physician visits, costs due to palliative care, the costs that are incurred during the patients’ travel to the medical sites, and opportunity costs associated with loss of productivity, which in turn may underestimate the total cost of cancer care for all treatment plans considered. The implications of ignoring such costs may translate into varying magnifications for different plans based on the extent they survive the patient. In addition, the set of regimens we considered does not span all FDA-approved chemotherapy and targeted therapies; however, as more data pertinent to emerging therapies become available our model can easily be extended to address how the use of such drugs within the first three lines of treatment may affect their economic value as well as the economic value of the whole treatment plans.
In addition, in the absence of indirect treatment comparisons or network meta-analyses, our estimates based only on single arms of the studies may miss the potential differences between the demographics and physiology of the patients enrolled in different clinical trials. Therefore, lack of direct pairwise comparisons between the treatments may fail to observe the variability in different trial settings and lead to confounding consequences on our estimates.
Our analyses utilized cost estimates from 2014. Although all of the constituent drugs of the regimens considered in this study except bev. have generic equivalents, our analyses are based on branded-prices. In the aftermath of bev. losing patent protection and/or drugs losing their exclusivity marketing rights, the findings of our study may lose their validity if they are attempted to be reproduced with generic prices. A different modeling approach may incorporate the probabilistic changes in cost due to expiring patent protections and the possibility of entrance of new drugs to the market over the lifetime of a cancer patient; however, the accuracy of such an extension would, more or less, rely on hard-to-obtain future survival and price forecasts from private industries. Our study rather takes a snapshot of the present and is concerned with the simpler question of how treatment plans compare to each other in that snapshot.
Last but not least, data availability held our modeling of drugs’ toxic effects to binary outcomes by means of the occurrence of a diverse array of AEs, but in reality, the toxicity is directly associated with longevity of the administration of the drug. Despite this fact, in practice, most trials do not monitor the cumulative toxicity build-ups in patients and report only the number of observed AEs. Likewise, trials typically track the change in tumor size rather than precisely measuring the magnitude of the change. Therefore, we lack any relevant data from the gathered reports that may allow a more rigorous and accurate modeling of tumor growth over time. Our analyses assumed that a treatment would be permanently discontinued if it led to two Grade 3+ AEs. In practice, there is no widely accepted number of AEs permitted per treatment. Hence, our analyses underestimate the total cost of mCRC treatment along with the utilization of each line of therapy administered which may yield better health benefits.
Conclusion
Although recent advancements in cancer treatment improve health outcomes for mCRC patients, these may come at a high incremental cost and are highly dependent on sequencing of treatments. Our results indicate that treatment plans involving multiple targeted therapies are unlikely to be cost-effective when compared with a single-line treatment with LV5FU. Our findings also underline the importance of better drug sequencing on the economic value of the treatment plans.
Footnotes
Acknowledgements
The authors would like to thank Dr. David Alexander Goldstein from Emory University; Yiling Jiang from Merck Sharp & Dohme, United Kingdom; and three anonymous reviewers for their constructive comments on earlier versions of this article.
Part of this work was presented at a poster session at the 37th Society of Medical Decision Making Annual North American Meeting in St. Louis, MO.
References
Supplementary Material
Please find the following supplemental material available below.
For Open Access articles published under a Creative Commons License, all supplemental material carries the same license as the article it is associated with.
For non-Open Access articles published, all supplemental material carries a non-exclusive license, and permission requests for re-use of supplemental material or any part of supplemental material shall be sent directly to the copyright owner as specified in the copyright notice associated with the article.