
Abstract
Cardiovascular disease (CVD) mortality declined in the United States by a striking 60% during the last half of the 20th century, largely from prevention and treatment of CVD risk factors such as tobacco smoking, dyslipidemia, and elevated blood pressure (BP), as well as the medical management of CVD events.1,2 Yet the decline masked profound racial disparities in CVD mortality. 3 By 2010, the black-white disparity in CVD mortality surpassed disparities in other causes of death—including homicides and cancer—to account for the greatest share (>25%) of the 4-year average life expectancy difference between blacks and whites. 4 The persistent disparity appears to be driven by both increased risk of CVD events (including higher rates of key risk factors of high BP and dyslipidemia) and increased mortality after events5–7; hence, primary prevention strategies to reduce the elevated CVD risk among blacks are necessary. Black race likely represents risk pathways not fully measured by conventional risk factors, including unmeasured inflammatory and stress pathways that have been poorly measured or remain under investigation, but likely relate to social and economic determinants of health and health disparities.7–9
To reduce black-white CVD disparities, a key question is whether blacks and other high-risk populations are adequately treated by the traditional “treat-to-target” (TTT) approach, which is chiefly based on treating elevated BP and low-density lipoprotein (LDL) levels. 10 Statin guidelines have shifted from a TTT to a “benefit-based, tailored” treatment (BTT) approach, in which treatment is guided by personalized CVD risk and treatment benefit estimates using composite CVD risk calculators, often incorporating elevated risk among blacks7,11; a similar paradigm shift for BP treatment decisions has been proposed.12,13
Here, using simulations of a nationally representative population of black and white adults aged 40 to 75 years, we sought to identify how the TTT and BTT approaches for lipid and BP treatment could affect national black-white CVD disparities.
Methods
Our microsimulation model simulated individual people and their risk of CVD events and mortality, and it was previously published.13,14 Here, we detail the key model assumptions and how we varied these assumptions to simulate both TTT and BTT approaches, as well as testing the robustness of our results under a wide range of alternative assumptions. Full input parameters are provided in the Supplementary Appendix, and model code for replication is available concurrent with publication at the Stanford Digital Repository (sdr.stanford.edu). Briefly, the model simulates one million individuals in a civilian US population by providing them with CVD risk factors (age, sex, race/ethnicity, systolic and diastolic BP, type 2 diabetes, chronic kidney disease, tobacco use, and total, low-density, and high-density lipoprotein cholesterol) based on the National Health and Nutrition Examination Survey (NHANES). The model then calculates the annual risk of CVD events (myocardial infarction and stroke) and mortality from those events or alternative factors (competing risks) over their lifetime, calculating the impact of treatment under TTT versus BTT approaches per meta-analytic estimates of treatment effect, as detailed below.
Study Population
Data from the NHANES (2011–2012) were used to estimate the distribution of CVD risk factors among a nationally representative sample of black and white adults aged 40 to 75 years without a prior history of myocardial infarction or stroke (N = 2,427). 15 For those reporting they were taking BP or lipid treatment agents, we used previously published meta-analytic estimates of the effect of each medication on BP and lipid levels to estimate pretreatment BP and lipid values (see Supplementary Appendix).16,17 We used Monte Carlo sampling with copulas, 18 which takes into account the covariance among demographics (age, sex, race/ethnicity) and risk factor values (systolic and diastolic BP, type 2 diabetes, chronic kidney disease, tobacco use, and total, low-density, and high-density lipoprotein cholesterol), to produce a simulated population of one million individuals. The sampling method ensures that the means, distributions, and correlations among all demographic and risk factor values match those of black and white men and women by age in NHANES (Supplemental Table 1 in the Supplementary Appendix), incorporating survey sample weights to render the simulated population nationally representative.
CVD Risk
Each simulated individual’s untreated risks of nonfatal and fatal myocardial infarction and stroke were estimated using equations derived from the Framingham Cohort Study, 19 with a race-specific adjustment. The Framingham equations were used for four reasons: 1) they were previously found to have reasonable accuracy for predicting CVD event risk among black and white men and women in external datasets, even as compared to newer alternative equations, when adjusted for higher overall black risk20–22; 2) alternative equations have inconsistent race effects (i.e., estimates for black persons were found recently to produce extreme values inconsistent with prior studies, likely due to overfitting limited data for blacks)23–26; 3) in our own validation exercise using observed mortality among participants sampled in the NHANES 1999–2000 who had subsequent CVD deaths recorded in the National Death Index through 2011, we observed highest performance for the Framingham score (Supplemental Table 2); and 4) the equations are common in prior research, facilitating comparisons between our model and other assessments. In sensitivity analyses, however, we also examined the impact of having equations of greater or lesser predictive accuracy, to assess robustness of our results. The race-specific adjustment factor incorporated into our base case analysis was a relative risk of 1.3 for blacks multiplied by their Framingham risk estimate; the value is the median of epidemiological estimates, consistent with the most recent American College of Cardiology (ACC)/American Heart Association (AHA) review, and slightly lower than the estimate of 1.4 from the recent ACC/AHA pooled cohort equations. 6 We varied the adjustment in sensitivity analyses from 1.0 (no additional risk beyond traditional risk factors) to 2.0. The adjustment captures unmeasured aspects of risk beyond standard biomarkers included in traditional risk equations (e.g., whatever social and environmental factors disproportionately increase black risk, such as unmeasured stressors).27,28
Treat-to-Target and Benefit-Based Tailored Treatment Strategies
We based our TTT strategies directly on recent clinical practice guidelines. Our proposed BTT strategies were informed by both the existing ACC/AHA statin guidelines and by recent studies of risk-based treatment thresholds. 13
Lipid Treatment
Our base case TTT lipid treatment strategy was the intensive ATP III approach, 29 as previous research found this strategy superior to less intensive ATP approaches in terms of quality-adjusted life years (QALYs) gained. 30 The statin dose was increased until LDL was <160 mg/dL (<4.1 mmol/L) for persons with zero to one CVD risk factors, <130 mg/dL (<3.4 mmol/L) for those with at least two risk factors and 10-year CVD risk ≤20%, and <100 mg/dL (<2.6 mmol/L) for those with at least two risk factors and a 10-year CVD risk >20% or with a CVD equivalent (e.g., diabetes). The minimum dose of statins needed to achieve each individual’s target was estimated using published meta-analytic estimates (Supplemental Table 3),31,32 with stepped increases from atorvastatin 10 mg daily to 20 mg, 40 mg, and finally 80 mg. The BTT statin strategy prescribed atorvastatin 20 mg if an individual’s 10-year CVD risk was 10% to 20%, and atorvastatin 40 mg if an individual’s 10-year CVD risk was >20%. Although the ACC/AHA guidelines set a cut-point of 7.5%, this was only the point at which recommendation with shared decision making should begin. The recently proposed US Preventive Services Task Force guidelines made this even more explicit, with 7.5% to 10% being a “shared decision making” zone, and recommending statins began once a patient’s risk reached 10%. 33 For fair comparison, we present our results in terms of events and deaths prevented in the overall population, not just events and deaths prevented among the treated population (to avoid inflating benefit estimates by presenting only benefits among the higher-risk group treated).
BP Treatment
Our base case TTT strategy was JNC-7 (the most recent consensus-based guideline). 34 In this approach, BP medications were intensified to a target BP of <130/80 mmHg for people with diabetes or chronic kidney disease (estimated glomerular filtration rate by the CKD-EPI equation of <60 mL/min per 1.73 m2 or albuminuria of >300 mg/day or 200 mg albumin per gram of creatinine), 35 or <140/90 mmHg otherwise. 34 The number of BP agents recommended was estimated using a meta-analysis of BP effects of each agent 16 (see Figure 1 for agent choices; Supplemental Table 3 for dose titration table). The BTT antihypertensive strategy prescribed BP treatment until estimated 10-year CVD event risk fell to <10%, if BP remained ≥120/65 mmHg for safety.
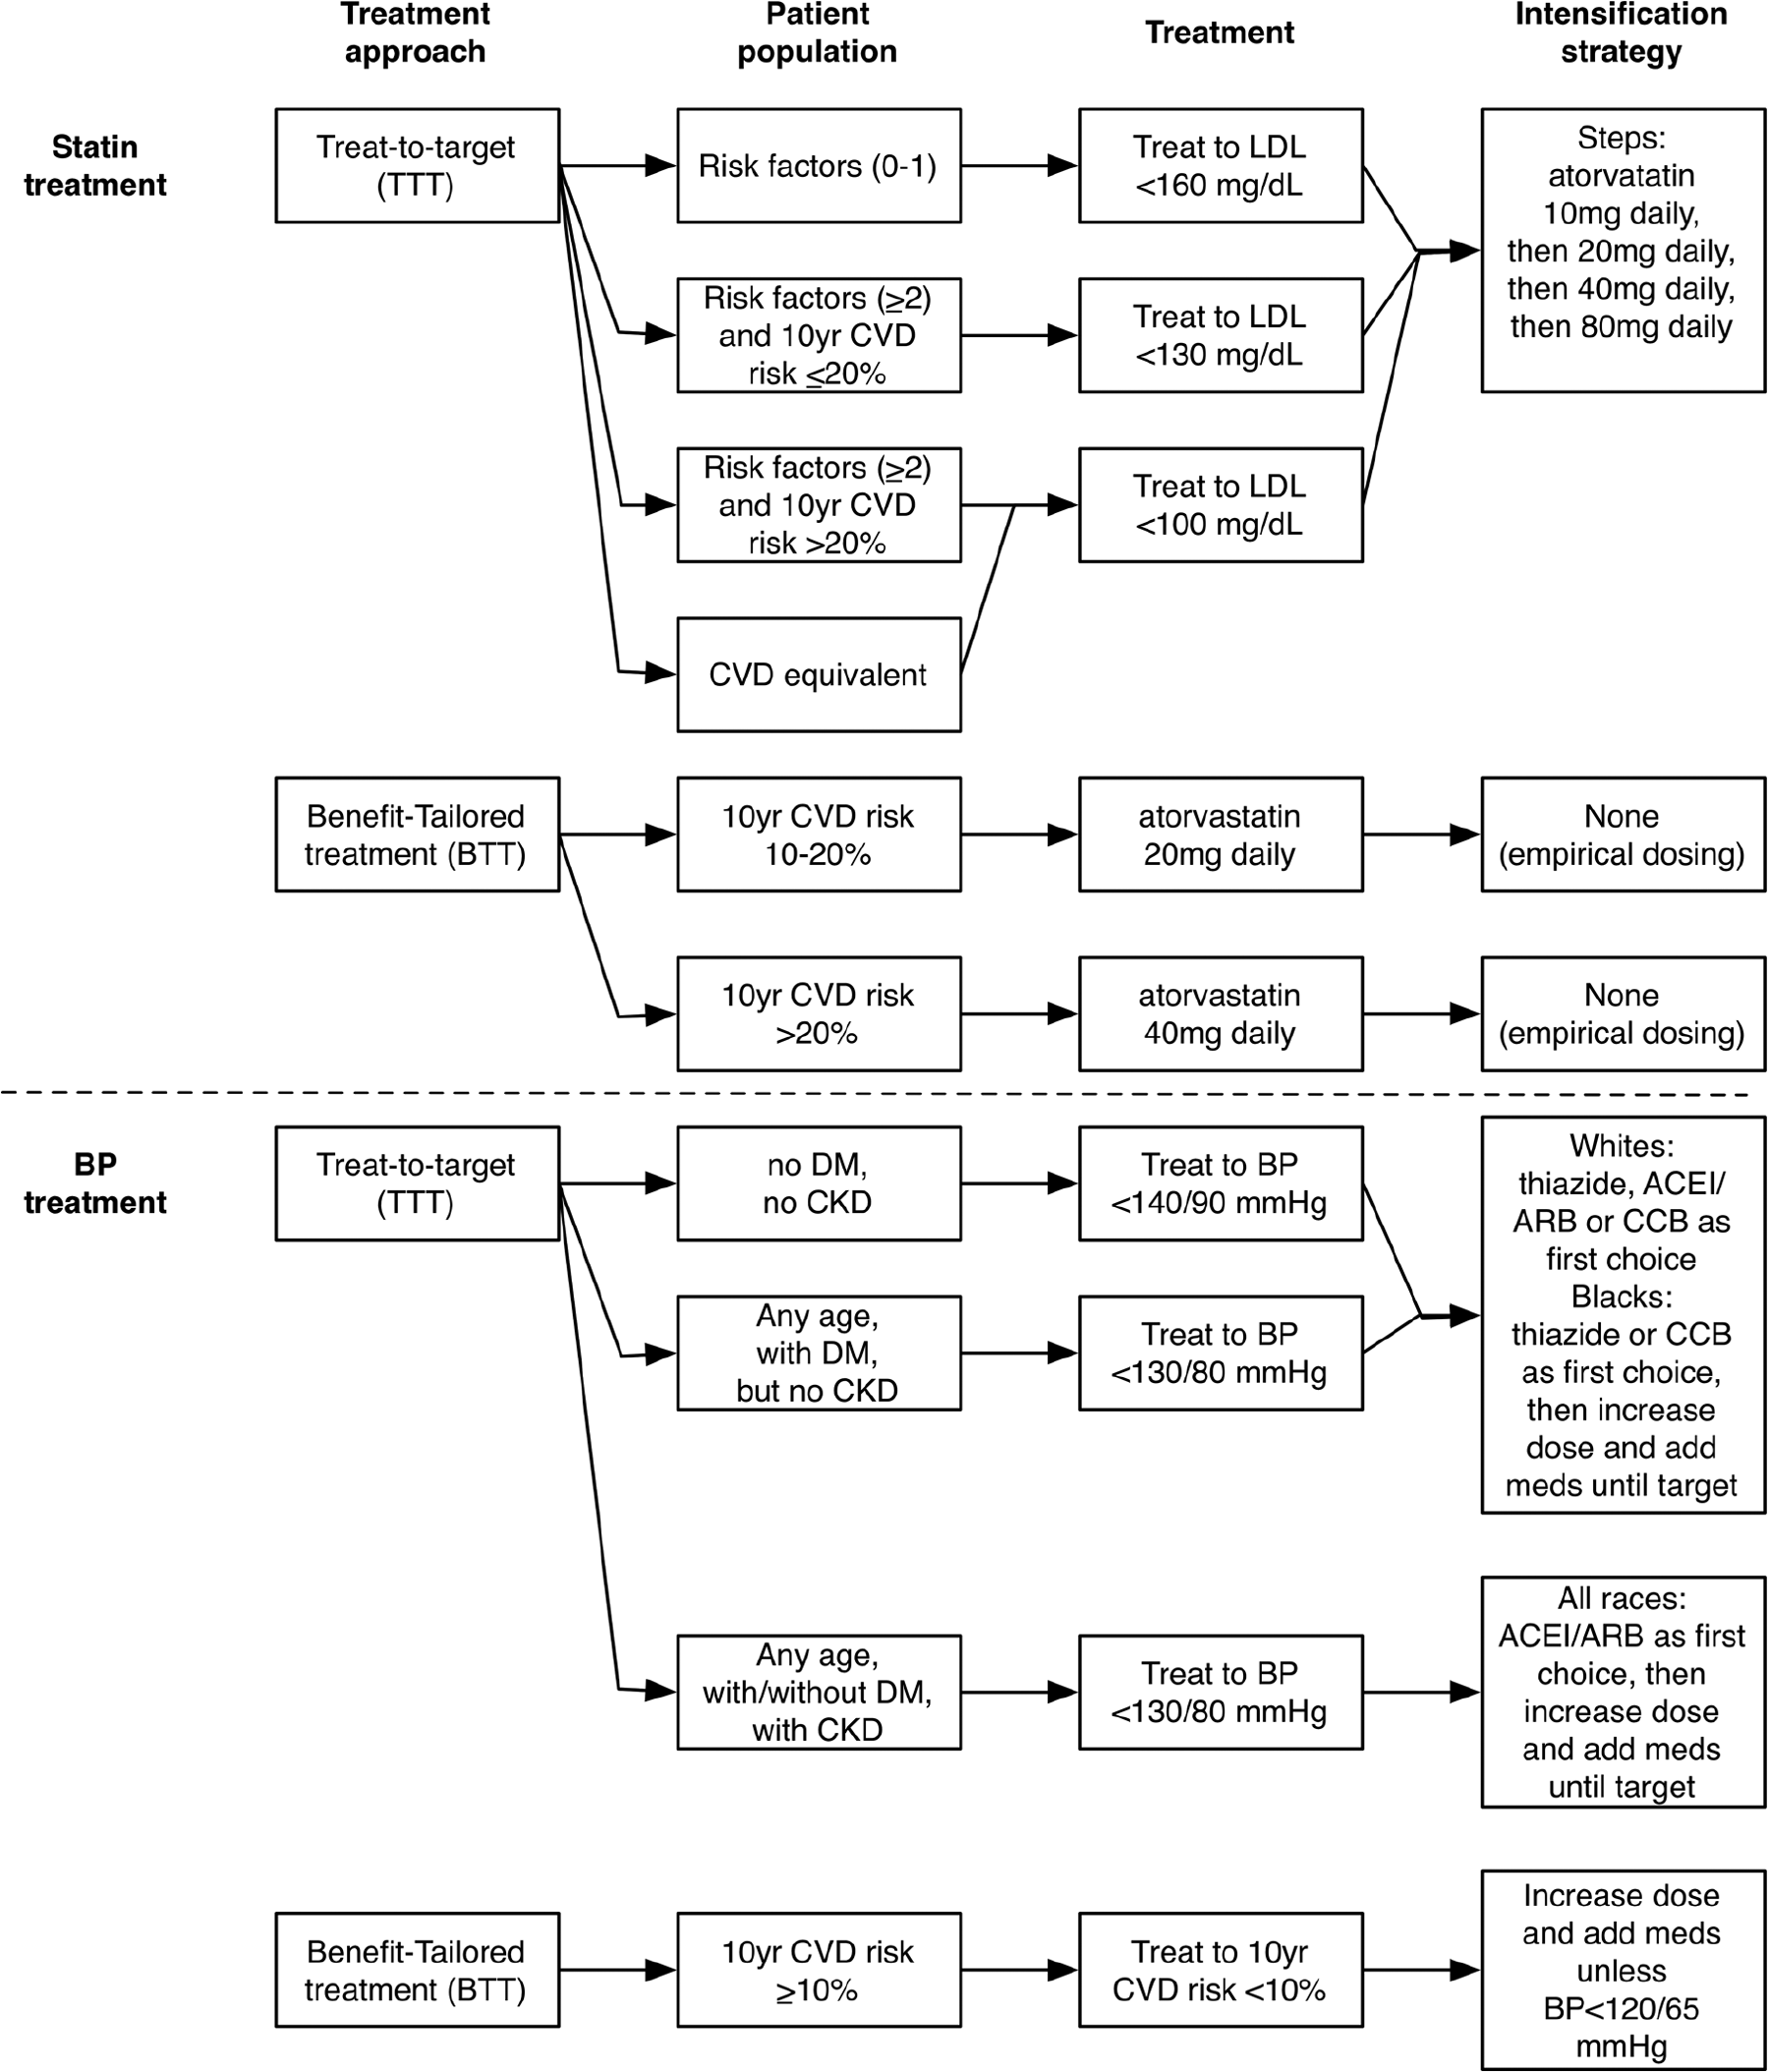
Treat-to-target (TTT) versus benefit-based tailored treatment (BTT) approaches to dyslipidemia and blood pressure treatment. Whites without chronic kidney disease were initiated with a thiazide diuretic, angiotensin-converting enzyme (ACE) inhibitor, angiotensin II receptor blocker (ARB), or calcium channel blocker (CCB) with random selection of the first choice, and blacks without chronic kidney disease were initiated on either a thiazide or CCB as the first choice; persons with chronic kidney disease were first initiated on an ACE inhibitor or ARB. 39 We started with standard doses and titrated to maximum doses before adding additional agents as needed to reach the individual’s target blood pressure (Supplemental Table 3). ACEI = angiotensin converting enzyme inhibitor; CKD = chronic kidney disease; CVD = cardiovascular disease; DM = diabetes mellitus.
To compare TTT and BTT treatment strategies, we estimated differences in lifetime impact on QALYs from CVD events prevented during a 5-year treatment period. A 5-year window was chosen since current practice guidelines suggest reevaluating medical treatment at least every 3 to 5 years. 11 Persons with diabetes were excluded from the base case analyses given very different ACC/AHA guidelines for CVD risk reduction for this group; they were included in sensitivity analyses (below). 11
Treatment Effects
The effects of lipid and BP therapy on each individual’s CVD risk were estimated from individual patient data pooled across randomized clinical trials (Supplemental Table 3).31,32,36 We specifically repeatedly sampled from the range of observed effects to account for individual variability of treatment response, as detailed in the Supplementary Appendix. The effects of BP therapy and of statin therapy were calculated separately and also together by maximizing statin therapy and then applying the BP treatments, and also testing the reverse order. We separated out the results of BP therapy from statin therapy rather than combining them in all analyses, given the results of the HOPE-3 trial suggesting that for populations with moderate CVD risk, BP therapy may not have additional benefits to statin therapy 37 (hence, we could evaluate the robustness of our results under a wide range of possibilities, from no additional benefit to BP therapy added to statin therapy, to the full extent of additive benefit suggested by the pooled randomized controlled trial data). We did not simulate racial differences in statin or BP treatment response, given inconsistent evidence per a recent review. 38 The TTT and BTT approaches were compared across three CVD outcomes: black-white disparities in the rate of CVD events, the rate of CVD deaths, and the loss of QALYs (see Supplemental Table 4 for input QALY weights; the full range of QALY values was repeatedly sampled from, to capture variability in QALY losses across CVD events of varying severity). 30
Sensitivity Analyses
In sensitivity analyses, we 1) varied the relative risk of CVD events for blacks from 1.3 to the range of 1.0 to 2.0 6 ; 2i) increased the duration of simulated treatment prior to reevaluation from 5 to 10 years; 3) included persons with diabetes (by prior diagnosis, hemoglobin A1c ≥6.5%, or fasting glucose ≥126 mg/dL in NHANES), treated to BP <130/80 mmHg per JNC7 and LDL <100 mg/dL per intensive ATP-III guidelines29,34; 4) altered BP guidelines from JNC-7 to the less-stringent JNC-8 (target BP <140/90 mmHg for persons with chronic kidney disease or diabetes, or persons <60 years old, and BP <150/90 mmHg for persons ≥60 years old) 39 ; 5) estimated the BTT 10-year CVD risk threshold at which the proportion of the overall population (both blacks and whites) recommended treatment matched that under TTT; and 6) estimated the implications if the risk calculator underpredicts or overpredicts CVD risk by 30%.
Analyses were performed in Stata (v. MP-14.1, StataCorp, College Station, Texas) and R (v. 3.2, R Foundation for Statistical Computing, Vienna, Austria). The funders had no role in the study. The analyses were approved by the Stanford University Institutional Review Board eProtocol #37135.
Results
Lipid Treatment
Among adults 40 to 75 years old without a prior history of CVD, the TTT lipid treatment approach based on ATP III would recommend statins to 88.3 million whites (44.9% of whites) and 12.7 million blacks (44.1% of blacks); a high-potency statin would be recommended to 17.7 million whites (9.0% of whites) and 2.6 million blacks (9.1% of blacks; Table 1). Compared with no treatment, the TTT statin treatment approach would be expected to save 19.9 QALYs per 1,000 white persons and 29.0 QALYs per 1,000 black persons from 5 years of treatment, resulting in ~4.8 million total QALYs saved in the United States.
Potential Effects of Treat-to-Target (TTT) Versus Benefit-Based Tailored Treatment (BTT) Approaches, Simulating Statin Treatment and BP Treatment Separately a

Note: BP = blood pressure; CVD = cardiovascular disease; QALY = quality-adjusted life year.
Overall, TTT treats an estimated 45% of this population with a statin compared to 61% treated with a statin by BTT. Note that column 2 (any statin) does not necessarily round to the sum of columns 3 and 4 (low-/medium- and high-potency statin) because of rounding differences.
The BTT lipid treatment approach would recommend statins to 117.2 million whites (59.5% of whites, vs. 44.9% under TTT) and 20.4 million blacks (71.3% of blacks, vs. 44.1% under TTT; Table 1). Compared with no treatment, the BTT approach would be expected to save 32.0 QALYs per 1,000 white persons (12.1 more than TTT) and 48.6 QALYs per 1,000 black persons (19.6 more than TTT) from 5 years of treatment, for ~7.7 million QALYs saved (2.9 million more than TTT).
BP Treatment
Among the same population, TTT would recommend BP treatment to 52.3 million whites (26.5% of whites) and 6.6 million blacks (22.9% of blacks); three or more BP agents would be recommended to 11.3 million whites (5.7% of whites) and 1.4 million blacks (4.7% of blacks; Table 1). Compared with no treatment, the TTT BP treatment approach would be expected to save 11.7 QALYs per 1,000 white persons and 13.4 QALYs per 1,000 black persons from 5 years of treatment, for ~2.7 million QALYs saved in the United States.
BTT would recommend BP treatment to 52.1 million whites (26.4% of whites, vs. 26.5% under TTT) and 10.2 million blacks (35.5% of blacks, vs. 22.9% under TTT), with fewer whites treated by three or more agents (3.3% vs. 5.7%), but more blacks treated by three or more agents (8.4% vs. 4.7%; Table 1). Compared with no treatment, BTT would save 18.7 QALYs per 1,000 white persons (7.0 more than TTT) and 38.9 QALYs per 1,000 black persons (25.5 more than TTT) from 5 years of treatment, for ~4.8 million total QALYs saved (2.1 million more than TTT).
Both Statin and BP Treatment
If lipid treatment was applied first and then BP treatment, the BTT approach would have even greater effectiveness than the TTT approach (Table 2), saving 14.6 more QALYs per 1,000 white persons and 37.7 more QALYs per 1,000 black persons than TTT (~4.0 million more QALYs saved through BTT than TTT in the United States). The results were similar when BP treatment was initiated first, followed by lipid treatment (Supplemental Table 5).
Potential Effects of Treat-to-Target (TTT) Versus Benefit-Based Tailored Treatment (BTT) Approaches, When Statin Treatment Is Followed by BP Treatment a

Note: BP = blood pressure; CVD = cardiovascular disease; QALY = quality-adjusted life year.
See Supplemental Table 5 for the reverse order (BP treatment, then statin treatment).
Differences Between Approaches
We compared the incremental gains or losses among persons who would be recommended different treatments under the two approaches.
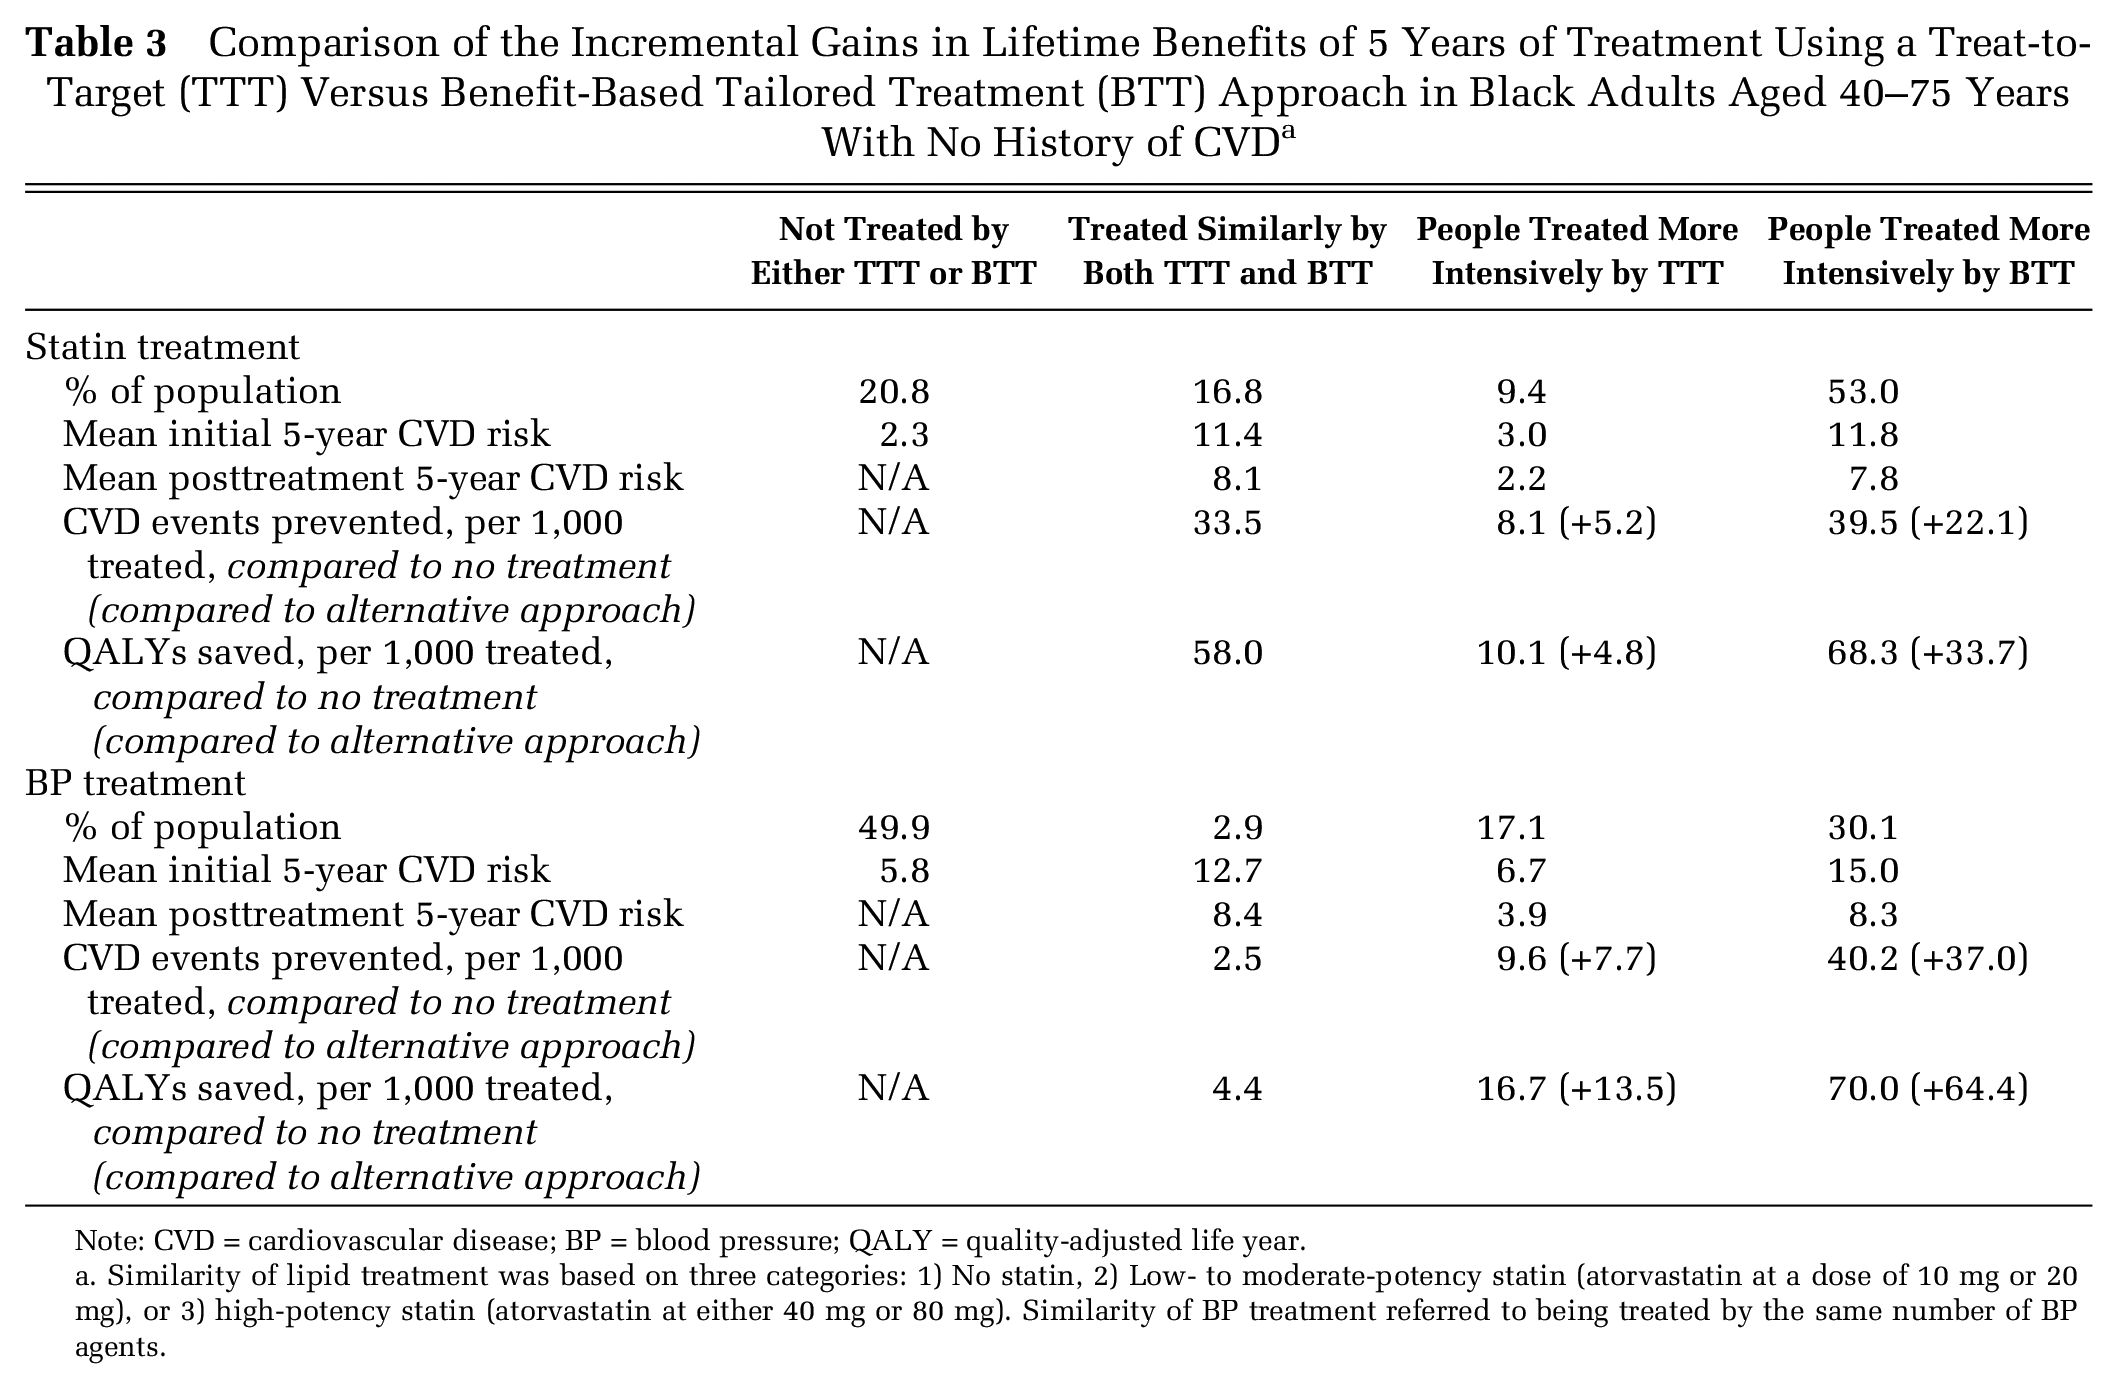
For lipid treatment, 20.8% of blacks would not be treated by either approach, 16.8% would receive a similar statin dose in both approaches, 9.4% would be recommended more intensive statin treatment by TTT, and 52.9% would be recommended more intensive statin treatment by BTT (Table 3). Despite treating more people with statins, BTT was more efficient than TTT—saving 33.7 more QALYs per 1,000 blacks treated more intensively (compared with 4.8 more QALYs per 1,000 blacks treated more intensively by TTT; Table 3).
Comparison of the Incremental Gains in Lifetime Benefits of 5 Years of Treatment Using a Treat-to-Target (TTT) Versus Benefit-Based Tailored Treatment (BTT) Approach in Black Adults Aged 40–75 Years With No History of CVD a
Note: CVD = cardiovascular disease; BP = blood pressure; QALY = quality-adjusted life year.
Similarity of lipid treatment was based on three categories: 1) No statin, 2) Low- to moderate-potency statin (atorvastatin at a dose of 10 mg or 20 mg), or 3) high-potency statin (atorvastatin at either 40 mg or 80 mg). Similarity of BP treatment referred to being treated by the same number of BP agents.
For BP treatment, 49.9% of blacks would not be treated by either approach, 2.9% would receive the same BP treatment dose in both approaches, 17.1% of blacks would be recommended a more intensive treatment by TTT, and 30.1% would be recommended a more intensive treatment by BTT (Table 3). An estimated 64.4 more QALYs would be saved per 1,000 blacks treated more intensively by BTT, compared to 13.5 more QALYs saved per 1,000 blacks treated more intensively by TTT.
Differential treatment outcomes for whites were similar to those for blacks (Supplemental Table 6).
Health Disparities
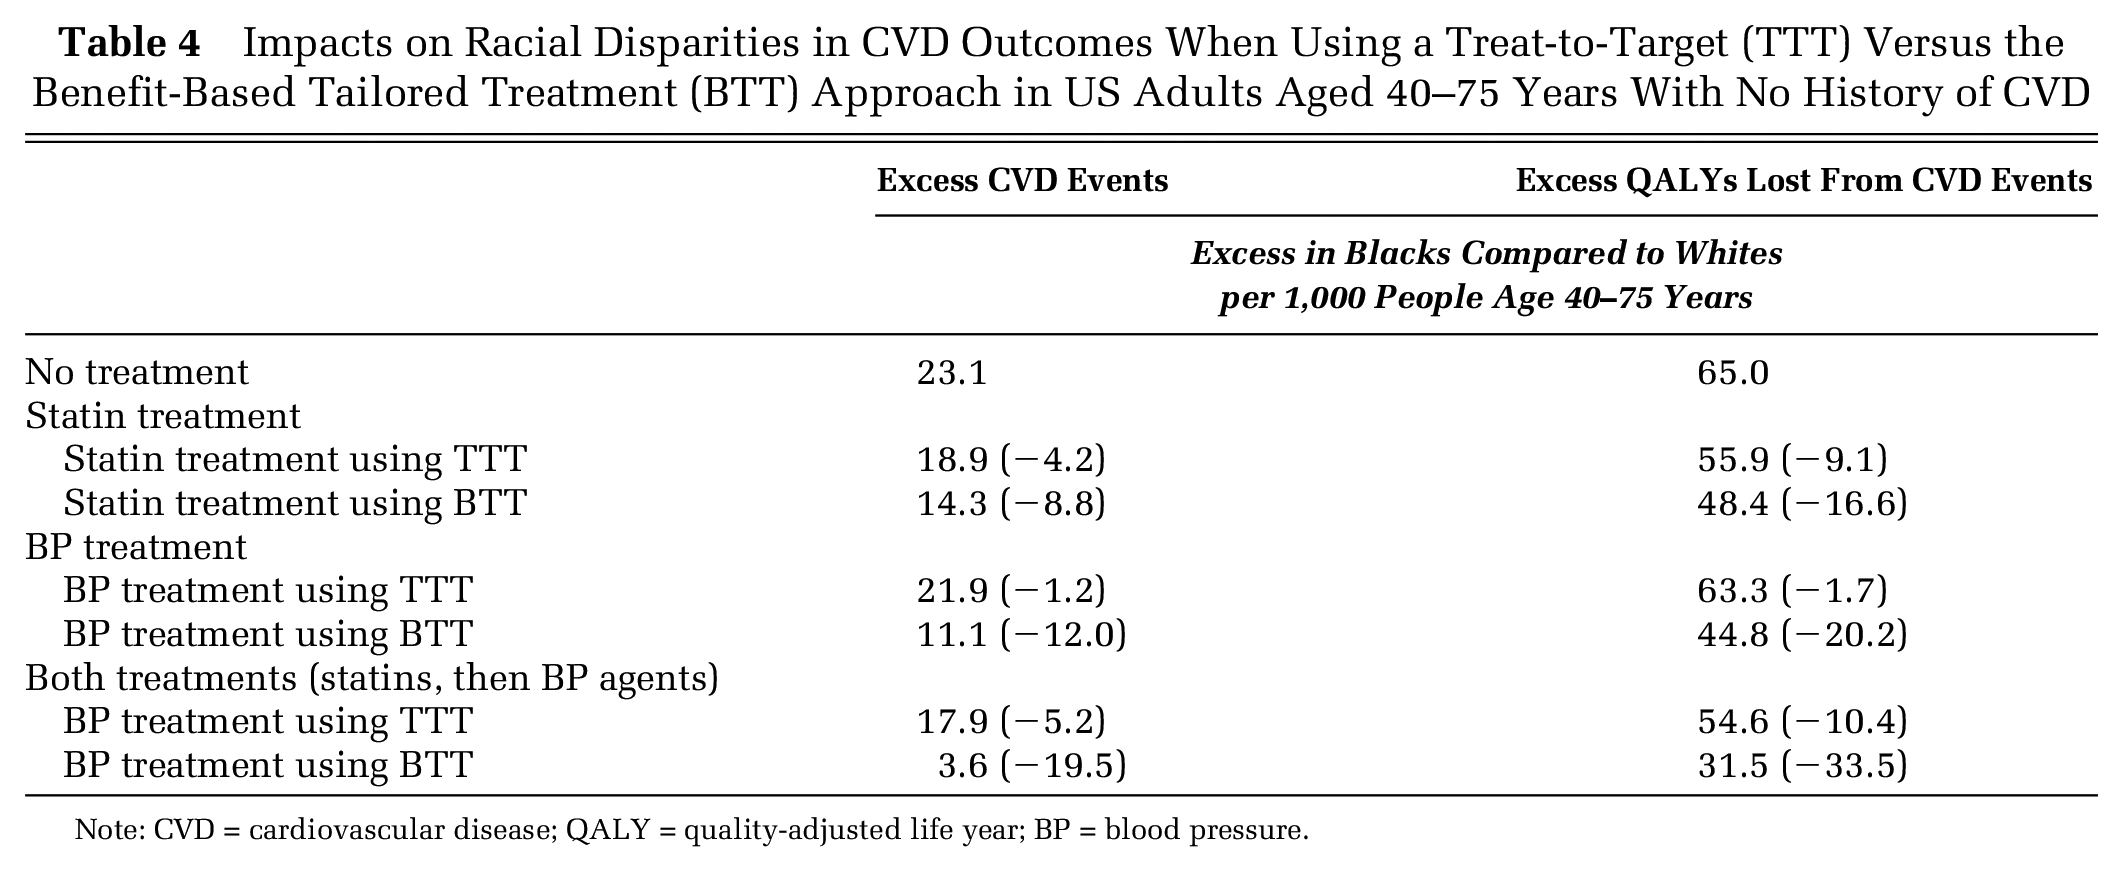
If no lipid or BP treatment were administered, our base-case model estimated that an excess of 23.1 CVD events and 65.0 QALYs would be lost per 1,000 blacks than per 1,000 whites from nontreatment over a 5-year period. Five years of TTT statin treatment could reduce the black-white disparity by an estimated 9.1 QALYs per 1,000, while BTT statin treatment could reduce the black-white disparity by 16.6 QALYs per 1,000, if both blacks and whites had complete treatment access. TTT BP treatment could reduce the black-white disparity by 1.7 QALYs per 1,000 and BTT by 20.2 QALYs per 1,000, under complete treatment access (Table 4). Together, combined statin and BP treatment using a TTT approach could reduce the black-white disparity from 65.0 excess black QALYs lost per 1,000 to 54.6 (a 10.4 per 1,000 reduction), compared to the combined statin and BP treatment BTT approach, which could reduce the black-white disparity from 65.0 excess black QALYs lost per 1,000 to 31.5 (a 33.5 per 1,000 reduction; Table 4). We found no differential treatment effect of either strategy between men and women once overall CVD risk was accounted for, and we therefore present the results for both men and women together.
Impacts on Racial Disparities in CVD Outcomes When Using a Treat-to-Target (TTT) Versus the Benefit-Based Tailored Treatment (BTT) Approach in US Adults Aged 40–75 Years With No History of CVD
Note: CVD = cardiovascular disease; QALY = quality-adjusted life year; BP = blood pressure.
Sensitivity Analyses
The comparative benefits of TTT relative to BTT remained consistent across sensitivity analyses (Table 5 summary, and detailed Supplemental Tables 7–14). Even if traditional risk factors fully captured the elevated risk of blacks as compared to whites (black relative risk = 1.0), BTT would remain superior to TTT overall and in disparities reduction, saving over 60% more QALYs per 1,000 blacks than TTT (Supplemental Table 7). The relative benefit of BTT persisted or even increased in scenarios where blacks had a relative risk of 2.0 versus whites (Supplemental Table 8), if we simulated 10 years of treatment rather than 5 years (Supplemental Table 9), or if we included persons with diabetes (Supplemental Table 10). Adopting JNC-8 rather than JNC-7 BP treatment targets reduced the TTT strategy’s effectiveness, reducing the QALYs saved by 37% per 1,000 blacks (Supplemental Table 11). After increasing the BTT CVD risk thresholds (to >14% 10-year risk) to equalize the proportion of the population treated by each approach, the BTT approach saved over 40% more QALYs than TTT (Supplemental Table 12). The relative benefit of BTT over TTT also persisted if the risk calculator used to estimate composite CVD risk underpredicted (Supplemental Table 13) or overpredicted (Supplemental Table 14) risk by 30%.
Sensitivity Analysis for the Reduction in Racial Disparities in CVD Outcomes When Using a Treat-to-Target (TTT) Versus the Benefit-Based Tailored Treatment (BTT) Approach in US Adults Aged 40–75 Years With No History of CVD

Note: CVD = cardiovascular disease; QALY = quality-adjusted life year; BP = blood pressure.
A negative sign indicates that disparities are increased in this scenario.
Note that these are relative reductions in the initial disparity and that the absolute magnitude of the initial disparity is much less in scenario 1a and much greater in scenario 1b (see Supplemental Tables 7 and 8).
Discussion
An important ongoing debate is whether shifting from universal population-wide risk factor treatment targets to personalized approaches based on CVD risk and anticipated treatment benefit would worsen or improve racial disparities in health outcomes.40,41 As lipid treatment guidelines have shifted from a TTT to a BTT approach, similar proposals have been made to shift BP treatment.12,13
Here, using microsimulation modeling methods, we observed that a BTT approach recommending lipid and BP treatment based on CVD risk would be expected to prevent more CVD events, deaths, and associated QALY losses than previously used TTT approaches aiming to achieve targeted LDL or BP target levels. The BTT approach treated a higher percentage of the population, but was still more efficient than the TTT approach, achieving greater CVD risk reduction per person treated, among both blacks and whites. BTT provides a better approach than TTT even when treating the same portion of the population, as those people who are treated are treated more assertively if they are likely to have a greater absolute risk reduction, and those not treated are less likely to experience a cardiovascular event. Hence, the BTT approach provides a more efficient distribution of the same resources. BTT was also much more effective in reducing CVD disparities between blacks and whites. The superiority of BTT to TTT was consistently found, even if Blacks had no race-specific elevated risk as compared to Whites. Although we modeled reductions in racial disparities specifically, our results show more generally how disparities can be better reduced by a risk-based or full BTT approach. Furthermore, our results demonstrate that the better risk tools capture increased risks due to social determinants—whether by variables for race, income, education, community attributes, or phenomics—the greater such disparities can be reduced by BTT. Simply changing guidelines, however, would not be expected to sufficiently reduce disparities unless providers adequately use those guidelines and patients have meaningful and equitable access to care.
Our findings were robust, but unsurprising. We found that society could limit disparities and limit CVD events more effectively if the focus was on higher risk patients, which includes African Americans. The higher number of CVD events prevented under the BTT approach was in part due to recommending more intensive treatment; yet BTT remained superior to TTT even when the same percentage of the population were treated by both approaches. The TTT approach privileged one risk factor (LDL or BP level), whereas BTT considered many and therefore concentrated therapy more effectively among those at higher risk. Because racial disparities are sustained by many simultaneously acting risk factors that are worse among blacks than whites in the United States, BTT better identified and targeted treatment to high-risk blacks. The comparative superiority of the BTT approach to the TTT approach in reducing population-wide events and black-white disparities was robust to whether black race was included as a coefficient in the risk model with a wide range of risk, or whether the CVD risk calculator being used systematically over- or under-predicted CVD risk.
Our findings support recent changes to lipid guidelines for statin therapy, which incorporate a BTT approach, 42 as well as provide further evidence suggesting that BP guidelines should follow suit to some degree.12,13 The recent SPRINT trial, in particular, showed benefit for treating high-risk individuals with “normal” BP, 43 while the subsequent HOPE-3 trial found no substantial benefit for treating lower-risk persons with systolic BP>160 mmHg. 44 These results, and a meta-analysis of individual patient data from BP treatment trials, suggest that a person’s pretreatment composite CVD risk is a key predictor of absolute BP treatment benefit and that a person’s BP level in isolation is a poor guide for estimating treatment benefit, at least once systolic BP is below 150 mmHg. 45
The BTT models that we developed are not the only possible method. We chose these cut-points because they were simple and treated a relatively similar number of patients as the comparison TTT guidelines. Using a cut-point of 7.5% instead of 10% would have dramatically increased statin and BP use under BTT, making comparisons difficult to interpret and potentially biasing our assessment toward BTT. However, all of our results were presented in terms of the total population of whites and of blacks, such that treating more or less people would still be comparable in terms of the metrics of QALYs and events prevented in the general population, not just the population treated.
Our study has limitations. It is well known that disparities in CVD events and deaths are due to many factors, from inadequate access to care, poor quality of care that does not follow guidelines, and numerous social and economic barriers to appropriate receipt of treatment such as differential insurance rates. We sought to evaluate the narrow question of whether changes in guidelines—if such guidelines were followed—could assist in the reduction of black-white CVD disparities. We simulated the case of perfect adherence to treatment on the part of both practitioners and patients, with lower adherence levels linearly scaling down the absolute but not comparative impact of the simulated strategies. We also sought to evaluate the potential impact of BTT versus TTT approaches on black-white CVD disparities regardless of which of many alternative strategies were adopted for risk calculation; hence, we did not attempt to determine the best risk calculator for CVD events. We found that the better the accuracy of risk prediction, the better the BTT approach concentrates therapy in those most likely to benefit, but BTT remains superior to TTT even given suboptimal risk prediction. However, the inclusion of race as a risk factor is particularly important for maximal reductions in racial disparities. Our analysis did not include cost-effectiveness analyses because prior cost-effectiveness studies of BP and generic statin treatments revealed that the low costs of medications make treatment decisions insensitive to costs. In contrast, treatment in lower CVD risk individuals is highly sensitive to individual patient preferences, especially the disutilities patients attach to treatment inconvenience and side effects.46–49
Our results emphasize the importance of continued work directed at developing better risk calculation approaches, particularly for blacks and other minorities. Our work does not address, however, what the best BTT treatment threshold should be when trading-off potential patient benefits with potential treatment harms. Prior analyses have estimated that BTT thresholds for statin treatment as low as a 3% 10-year risk may be cost-effective from a societal perspective if one assumes that statin’s treatment-related harms, including side effects, are very low 47 ; improving our understanding of treatment-related harm is an important subject for further research as aggressive treatment for high-risk patients will not fit all patients’ personal priorities despite potential CVD benefits.
Our study suggests that a benefit-tailored approach to lipid and blood pressure treatment could potentially reduce national black-white CVD disparities much more than conventional treat-to-target approaches. Benefit-tailored treatment strategies account for the fact that single biomarkers can be poor estimators of the benefit of key CVD preventive therapies. Using global CVD risk assessments as the primary guide to treatment intensification better targets treatment to those who benefit most and, in turn, substantially reduces persistent black-white CVD disparities.
Footnotes
Financial support for this study was provided in part by grants from the National Institute On Minority Health and Health Disparities of the National Institutes of Health under Award Numbers DP2MD010478 and U54MD010724; the National Heart, Lung, and Blood Institute of the National Institutes of Health under Award Number K08HL121056; the Methods Core of the Michigan Center for Diabetes Translational Research (National Institute of Diabetes, Digestive and Kidney Diseases of the National Institutes of Health [P60DK20572]); and the Department of Veterans Affairs HSR&D Service (IIR02-225). The funding agreement ensured the authors’ independence in designing the study, interpreting the data, writing, and publishing the report. The content is solely the responsibility of the authors and does not necessarily represent the official views of the National Institutes of Health or the Department of Veterans Affairs.
References
Supplementary Material
Please find the following supplemental material available below.
For Open Access articles published under a Creative Commons License, all supplemental material carries the same license as the article it is associated with.
For non-Open Access articles published, all supplemental material carries a non-exclusive license, and permission requests for re-use of supplemental material or any part of supplemental material shall be sent directly to the copyright owner as specified in the copyright notice associated with the article.