
Abstract
Wild polioviruses (WPVs) cause severe and permanent paralysis (i.e., paralytic poliomyelitis, or polio), which can result in death following breathing muscle involvement, in a fraction of infected susceptible individuals (i.e., approximately 1/200, 1/2,000, and 1/1,000 for serotypes 1, 2, and 3, respectively).1,2 The injectable inactivated poliovirus vaccine (IPV) 3 and the live, attenuated oral poliovirus vaccine (OPV) 4 both provide full and likely permanent protection from polio, but differ in costs (higher for IPV), 5 serological response (higher for IPV),6,7 ability to induce intestinal immunity that limits participation in fecal-oral transmission (higher for OPV),8,9 ability to secondarily immunize contacts of vaccine recipients (none for IPV), 8 and risks (insignificant for IPV, important for OPV).10–12 Due to the advantages of OPV, the Global Polio Eradication Initiative relied primarily on OPV to globally eradicate serotype 2 WPV (WPV2), 13 apparently eradicate serotype 3 WPV (WPV3), 14 and interrupt serotype 1 WPV (WPV1) transmission in all countries except Pakistan, Afghanistan, and Nigeria. 15 However, OPV can cause 1) vaccine-associated paralysis in vaccine recipients or close contacts,11,16 2) continued transmission and evolution of OPV-related viruses in settings of low population immunity to poliovirus transmission that results in paralytic outbreaks of circulating vaccine-derived poliovirus with properties similar to WPV,17,18 and 3) long-term infections with immunodeficiency-associated vaccine-derived poliovirus in rare individuals with B-cell related immunodeficiencies.19,20 The risks associated with OPV use motivate globally coordinated cessation of the three OPV serotypes. 21
During April and May 2016, the world stopped the use of all OPV containing serotype 2 strains (OPV2) by switching from trivalent OPV (tOPV), which contains all three poliovirus serotypes, to bivalent OPV (bOPV), which contains only serotypes 1 and 3. 22 Despite the introduction of at least one IPV dose in routine immunization schedules, 21 population immunity to fecal-oral serotype 2 transmission will decrease to unprecedented low levels in the absence of the superior intestinal immunity provided by OPV2 vaccination,8,23 exposure to OPV2-related viruses,24,25 or exposure to WPV2. This means that populations with conditions conducive to fecal-oral poliovirus transmission will become increasingly vulnerable to outbreaks following any serotype 2 poliovirus transmission after OPV2 cessation, regardless of IPV use.26–28 Such transmission may occur due to OPV2-related strains introduced before OPV2 cessation that evolve to serotype 2 circulating vaccine-derived polioviruses (cVDPV2s),17,29 introductions from any populations that failed to completely stop OPV2 use,27,28 serotype 2 immunodeficiency-associated vaccine-derived poliovirus (iVDPV2) from long-term excretors, 20 or releases from laboratories or polio vaccine manufacturing sites.10,30
Recognizing the risk of serotype 2 outbreaks following OPV2 cessation, the Global Polio Eradication Initiative developed an aggressive outbreak response protocol for the first year after OPV2 cessation, 31 with revisions expected based on experience during the year following OPV2 cessation. The protocol emphasizes the use of serotype 2 monovalent OPV (mOPV2) due to the proven ability of monovalent OPV supplemental immunization activities (SIAs) to rapidly interrupt transmission in outbreak settings. 31 For confirmed serotype 2 outbreaks in high-risk settings, the protocol recommends five outbreak response SIAs (oSIAs) using mOPV2 and targeting at least 500,000 children under 5 years of age (first oSIA, starting 15 days after outbreak confirmation) or at least 2 million children under 5 years of age (subsequent oSIAs following at 2- to 3-week intervals). The protocol further recommends use of IPV during the second oSIA, co-administered with mOPV2 and/or administered alone in areas around a high-risk population. The addition of IPV will effectively protect from poliomyelitis disease (polio) the fraction of vaccine recipients who fail to respond to mOPV2 but respond to IPV, and it will boost the intestinal immunity of individuals previously infected with a serotype 2 live poliovirus (LPV; i.e., WPV, OPV, OPV-related virus, or vaccine-derived poliovirus) who take to the serotype 2 IPV.32,33 Using IPV in areas outside the mOPV2 oSIA target population may also reduce the probability of exportations of mOPV2-related viruses used in the oSIAs to these areas that become increasingly likely to support continued transmission and evolution of OPV2-related viruses as population immunity to serotype 2 transmission declines. 31 Due to IPV supply limitations, the Global Polio Eradication Initiative currently plans to use intradermally delivered one-fifth fractional IPV doses for the IPV oSIAs, which may result in some loss of immune response compared to full IPV,34–39 but allows reaching many more children with the same amount of IPV antigen.
While addition of IPV to the outbreak response protocol will not reduce the effectiveness of the outbreak response as long as IPV doses do not replace mOPV2 doses, questions remain related to the implications of using IPV for oSIAs in the context of globally insufficient IPV supply, substantial costs, and uncertain benefits. Using a previously developed model of poliovirus transmission and OPV evolution,2,40–44 this study examines the potential costs and benefits of adding IPV to oSIA in response to a hypothetical possible outbreak after OPV2 cessation in northwest Nigeria.
Methods
Analytical Framework
This analysis estimates the expected effectiveness and costs, the incremental cost-effectiveness ratios (ICERs), and the incremental net benefits (INBs) of various options to include IPV in oSIAs compared to reliance on mOPV2 only in the context of a hypothetical outbreak in northwest Nigeria (i.e., the Nigerian states of Jigawa, Kaduna, Kano, Katsina, Kebbi, Sokoto, and Zamfara, totaling an estimated 47 million people in 20152,45,46). To estimate expected polio cases, we adopt an existing deterministic, differential equation-based poliovirus transmission and OPV evolution model (see Online Appendix A1 for a brief description) 2 and modify it to reflect conditions that would lead to a cVDPV2 outbreak following OPV2 cessation in northwest Nigeria (see below). The health economic evaluation (i.e., estimation of ICERs and INBs) follows current guidance of economic evaluations of health interventions, takes a societal perspective, and discounts outcomes to 2017 net present values with a base case discount rate of 3%.47,48 The interventions considered apply to a hypothetical outbreak that plays out entirely in 2017, such that the outbreak response costs and occurrence and polio case numbers do not get discounted, but we include the life-time consequences of polio cases over the analytical time horizon, which considers the life-time sequelae of polio in the calculation of disability-adjusted life-years (DALYs) lost and societal economic costs per polio case. To report consistent monetary units, we express all monetary outcomes in year 2013 US dollars, reflecting the currency year of prior unit costs estimates, which converted estimates from different dollar years to year 2013 dollars using the US Consumer Price Index.49,50
Underlying Model
The poliovirus transmission and OPV evolution model development involved an extensive expert review8,18,51 and model calibration2,40 process to ensure that all model inputs remained consistent with the evidence from OPV challenge and other studies and that the model behavior remained consistent with observations across a diverse set of 9 real-world situations with respect to polio incidence, age distributions of cases, vaccine use and seroconversion, WPV elimination, WPV importation outbreaks, secondary OPV infections, and the emergence or absence of cVDPVs (see Online Appendix A2). To characterize population immunity to poliovirus transmission in one summary measure, the model computes the mixing-adjusted effective immune proportion, which aggregates the potential abilities of individuals to participate in transmission according to the immunity state they reside in and takes into account the mixing pattern between age groups and subpopulations. 42 This analysis does not consider the risks to other populations of failing to stop the outbreak, exporting the outbreak virus or viruses related to mOPV2 used in the oSIAs, or the risk to northwest Nigeria of creating new long-term iVDPV2 infections.
Consistent with epidemiological experience and data from OPV and IPV trials,8,51 the immunity state structure of the model 2 assumes that successful vaccination with IPV-only by individuals without prior LPV infections results in full immunity to polio (disease) and similar protection from participation in oropharyngeal transmission (i.e., oral-to-oral transmission between people via droplets) as immunity induced by LPV infections, but much less protection from participation in fecal-oral transmission. 52 We define a successful IPV vaccination as an IPV dose that stimulates the immune response (i.e., “takes”) to provide permanent protection from polio, including a priming response in the absence of development of detectable serum antibodies that leads to a better and faster response to the next dose. In the model, a successful IPV vaccination corresponds to a transition to the appropriate IPV immunity state. We assume that a successful IPV vaccination occurs at an average per-dose take rate of 63% in northwest Nigeria (varied between 30% and 95% in a sensitivity analysis) such that the cumulative take rate after three doses equals 95%. 53 The model characterization of vaccination of already immune individuals implies that individuals with prior LPV-induced immunity move to the highest state of immunity to polioviruses infection after successful IPV vaccination and remains consistent with subsequently published data from clinical trials that show a stronger intestinal boosting effect of IPV compared to OPV in individuals with immunity from prior LPV infections (see Online Appendix A3).32,33 Moreover, to ensure that co-administration of IPV and OPV cannot result in lower immunity to transmission than administration of OPV alone, we assume that the same fraction of vaccine recipients who would take to OPV if they receive OPV-only would still take to OPV if they instead receive OPV and IPV at the same time, while the fraction that would not take to OPV-only may still take to IPV at the IPV take rate (see Online Appendix A3). 53
Characterization of Northwest Nigeria
We adopted previously developed model inputs specific to northwest Nigeria,2,40–44 and updated the model to reflect the introduction of IPV co-administered with the third non-birth OPV dose in 2015. We further accounted for the actual SIA choices since our last update of the model, 43 including tOPV intensification during 2015 and 2016 and limited IPV and OPV co-administration during SIAs (see Online Appendix A4). The model characterizes one subpopulation that represents historically undervaccinated communities (10% of the total population) and one that represents the general population (90% of the total population). Individuals in each subpopulation preferentially mix with each other. For the base case, we assume that the undervaccinated subpopulation attains only 30% of the routine immunization coverage and 20% of the SIA coverage of the general population from 1 January 2015 on. Despite the low coverage, the base case model suggests that the use of tOPV in nine full-scale SIAs in northwest Nigeria during 2015–2016 provided sufficient population immunity to serotype 2 transmission to ensure die-out of all OPV2-related viruses after OPV2 cessation. To generate a hypothetical cVDPV2 outbreak after OPV2 cessation, we modified the base case to gradually reduce the relative SIA coverage in the undervaccinated subpopulation from 20% to 2% for the last eight tOPV SIAs, while keeping all other model inputs unchanged from the base case (see Online Appendix A4). We used this modified case for all oSIA analyses in this study, which only vary assumptions related to the oSIAs in response to the new cVDPV2 outbreak.
Outbreak Response Strategies
Table 1 lists the IPV oSIAs strategies we considered. Given the global public health emergency that a cVDPV2 outbreak after OPV2 cessation would constitute, we assume fast, high-quality oSIAs. Specifically, we assume that the first oSIA (oSIA1) would start 35 days after the onset of paralysis for the first detected cVDPV2 case. This delay includes 21 days between the onset of paralysis and notification of the sequence results needed to confirm the nature of the outbreak, and 14 days between notification of sequence results and the initiation of oSIA1 to confirm the outbreak, release of mOPV2 from the global stockpile, and prepare the immunization campaign. 31 Detection of a polio case depends on the quality of surveillance, and for the undervaccinated subpopulation, we assume detection occurs as soon as three polio cases due to serotype 2 polioviruses per 10 million people accumulate since OPV2 cessation. 50 Unless otherwise noted and consistent with the protocol, 31 we assume that oSIA1 targets only the undervaccinated subpopulation (i.e., the initial outbreak population), while the four subsequent oSIAs target the general population as well. We further assume that all oSIAs target children aged 0 to 4 years unless otherwise noted. 31 We assume that oSIAs achieve 80% coverage in both subpopulations with a repeated missed probability of 0.750,54 that together imply a repeated reached probability of 0.925. 40 We assume that all oSIAs last for 4 days and occur at intervals of 20 days between the first days of successive oSIAs to reflect the recommended interval of 2 to 3 weeks. 31
IPV oSIA Strategies Considered in the Context of a Hypothetical cVDPV2 Outbreak in Northwest Nigeria

Note: IPV = inactivated poliovirus vaccine; oSIA = outbreak response supplemental immunization activity; cVDPV2 = serotype 2 circulating vaccine-derived poliovirus; mOPV2 = serotype 2 monovalent oral poliovirus vaccine.
IPV target age range excludes age group from 0 through 2 months.
The current outbreak response protocol recommends using IPV and mOPV2 during oSIA2, which would represent the first full-scale oSIA. 31 In addition to this recommended strategy (IPV added during oSIA2), we compare it to a strategy that does not add IPV to any oSIA (No IPV) and we consider the use of IPV during oSIA1 (IPV added during oSIA1), which targets only the initial outbreak population, during oSIA5 (IPV added during oSIA5), or during all oSIAs (IPV added during all oSIAs). We further consider IPV oSIA strategies that target older children with likely partially waned immunity to provide a greater intestinal boosting effect (IPV 5–9 during oSIA2; IPV 5–14 during oSIA2) and compare this to the corresponding target age group expansion with mOPV2 (No IPV but expand oSIA2 through age 9; No IPV but expand oSIA2 through age 14). Finally, we consider one IPV oSIA strategy that preemptively adds IPV to oSIA1 in the general population without co-administering mOPV2 (IPV in general during oSIA1) and one strategy that uses IPV-only instead of IPV co-administered with mOPV2 during oSIA2 in the general population while still co-administering mOPV2 and IPV in the initial outbreak population (IPV-only in general during oSIA2). Given that two recent small-scale IPV SIAs in northwest Nigeria excluded young infants (see Online Appendix A4) to avoid maternal immunity interference, we assume that all IPV oSIAs exclude the age group of 0 through 2 month old children.
Economic Inputs
Table 2 lists the input assumptions for the economic analyses based on prior work.50,55–57 We calculated ICERs and INBs using previously published methods.50,56,57 We calculate the number of DALYs lost per polio case using the recommended formula, 58 assuming a case-fatality rate for polio of 15%, 57 a disability weight of 0.369, 58 a life expectancy at the average age of onset of 54 years based on the estimated life expectancy at birth in Nigeria for 2017, 57 and no age-weighting. 57 We estimate the societal economic costs per polio case by multiplying the DALY estimate per polio case by the most recent available per-capita gross national income estimate for Nigeria (Table 2). 59 In a sensitivity analysis around the strategy of IPV added during oSIA2, we vary the discount rate between 0% and 10%, which implies DALYs lost per polio case of 25 and 4.6, respectively. This range affects the societal economic costs per polio case and the ICERs and INBs, but not the expected number of polio cases prevented or the expected incremental outbreak response costs, which do not change beyond the first year of the analytical time horizon. Given the small numbers of expected polio cases prevented involved, for simplicity we assume that the range of DALYs lost and societal costs per economic case associated with variation of the discount rate (i.e., $74,000 and $14,000 for discount rates of 0% and 10%, respectively) also accounts for the uncertainty in the much smaller treatment costs per polio case, which mainly occur during the acute disease phase but also include some long-term costs.
Health-Economic Input Assumptions

Note: mOPV2 = serotype 2 monovalent oral poliovirus vaccine; IPV = inactivated poliovirus vaccine; oSIA = outbreak response SIA; SIA = supplemental immunization activity; DALY = disability-adjusted life-year.
Results
For the modified base case with decreasing relative tOPV SIA coverage leading up to OPV2 cessation, the existing cVDPV2s that circulated in northwest Nigeria since the mid-2000s die-out in early 2016. However, due to insufficient population immunity to serotype 2 transmission at the time of OPV2 cessation in the undervaccinated subpopulation, OPV2-related viruses used prior to OPV2 cessation continue to circulate and evolve, leading to the emergence of a new cVDPV2 in the undervaccinated subpopulation in early 2017. Onset of the first detected paralytic case occurs in the first half of 2017 in the initial outbreak population and by then the cVDPV2 virus already circulates in the general population. A model run without any oSIAs resulted in reestablished continued endemic circulation of the cVDPV2 in northwest Nigeria, with over 300 polio cases in 2017 and over 2,000 polio cases through 2019 (see Online Appendix A4). In contrast, all oSIA strategies we considered (Table 1) re-interrupt transmission by the end of 2017 and reduce the number of expected polio cases during 2017 to approximately 11 or less. While the occurrence of a polio case given infection in a susceptible individual in reality represents a chance event, in our model we accumulate cases deterministically from all infections that occur in the population according the average paralysis-to-infection ratio for cVDPV2s (i.e., 1/2,000) and consequently we obtain fractional estimates of polio cases.
Figure 1 shows the effect of adding IPV to one or more different oSIAs in terms of incidence (Figure 1a) and population immunity to serotype 2 transmission (Figure 1b). Despite the smaller scale of oSIA1 compared to oSIAs2–5 (Table 1), IPV added during oSIA1 resulted in the greatest overall reduction in cases compared to No IPV among the strategies that add IPV to a single oSIA (i.e., greatest area between the curves in Figure 1a, corresponding to 0.6 polio cases and 6% of the cases that would occur with No IPV). However, because oSIA2 targets children under 5 years of age in all of northwest Nigeria, IPV added during oSIA2 achieves a slightly lower incidence following oSIA2. IPV added during oSIA5 yielded almost no change in the incidence curve (i.e., it overlaps the No IPV curve in Figure 1a) but a small increase in population immunity to transmission after the outbreak (Figure 2a). IPV added during all oSIAs yields a further marginal decrease in cases and increase in population immunity to transmission, but this requires about four times as many IPV doses as IPV added to oSIA2 or oSIA5 (see below). A breakdown of the population immunity to serotype 2 transmission by subpopulation (see Online Appendix 5) explains why the curves in Figure 1b for IPV added to oSIA1 and No IPV almost completely overlap despite the notable difference in polio incidence.

Impact of adding inactivated poliovirus vaccine (IPV) to different outbreak response supplemental immunization activities (oSIAs) that already use serotype 2 monovalent oral poliovirus vaccine. (a) Impact on polio incidence. (b) Impact on population immunity to transmission in comparison to the threshold effective immune proportion (EIP*) needed to stop transmission based on the basic reproduction number (R0) of serotype 2 wild or fully reverted poliovirus

Impact of expanding the second outbreak response supplemental immunization activity (oSIA2) that targets children under 5 years of age with serotype 2 monovalent oral poliovirus vaccine (mOPV2) to older age groups with mOPV2 or with inactivated poliovirus vaccine (IPV). (a) Impact on polio incidence. (b) Impact on population immunity to transmission in comparison to the threshold effective immune proportion (EIP*) needed to stop transmission based on the basic reproduction number (R0) of serotype 2 wild or fully reverted poliovirus
Figure 2 shows the effect of giving mOPV2 or IPV to older children. Consistent with earlier modeling analyses of expanded target age groups,40,60,61 we find a minimal effect of any of the expanded age group strategies for oSIA2 on the outbreak curve (Figure 2a). However, Figure 2b shows a small but clear effect on population immunity to serotype 2 transmission due to boosting of intestinal immunity of individuals already immune to polio disease but with partially waned LPV-induced immunity to serotype 2 transmission. Despite the IPV advantage of greater effective take at the individual level for individuals with prior LPV-induced immunity, mOPV2 leads to a slightly greater effect at the population level due to a combination of relatively high susceptibility to mOPV2 for older children with waned immunity and additional immunity from secondary OPV exposure following oSIA2.
Figure 3 considers two additional IPV oSIA strategies that use IPV-only instead of IPV co-administered with mOPV2 for the primary target age group of less than 5 year olds. The results suggest a larger effect of adding IPV preemptively to oSIA1 as a large “ring” around the initial outbreak population that receives mOPV2 (curves for IPV in general during oSIA1) compared to other IPV oSIA strategies in Figures 1 and 2. This remains consistent with prior analyses that modeled an IPV ring 54 and reflects the effect of giving IPV instead of not giving any vaccine in the general population during oSIA1. In contrast, conducting the same IPV ring during oSIA2 in the general population that would otherwise use mOPV2, leads to an increase in the incidence curve (Figure 3a). Thus, unlike giving IPV instead of mOPV2 to already immune individuals (Figure 2), giving IPV-only instead of mOPV2 to a target age group that includes most of the susceptible children very clearly represents a poorly performing strategy.

Impact of other possible strategies involving inactivated poliovirus vaccine (IPV) use during outbreak response supplemental immunization activities (oSIAs). (a) Impact on polio incidence. (b) Impact on population immunity to transmission in comparison to the threshold effective immune proportion (EIP*) needed to stop transmission based on the basic reproduction number (R0) of serotype 2 wild or fully reverted poliovirus.
Table 3 shows the results of the health economic analysis of the IPV oSIA strategies, including the IPV supply needs for the different choices. The IPV needs, which account for the expected wastage (Table 2), vary considerably between 1.4 million (IPV added during oSIA1 in the initial outbreak population) and 58 million (IPV added during all oSIAs). In contrast, the expected number of polio cases prevented remains small for all IPV oSIA strategies. Consequently, all ICERs indicate very high costs per prevented polio case or per DALY averted, making all options not cost-effective based on comparison to the average per capita gross national income in 2014 (i.e., approximately $3,000 in 2014 59 ). 47 Strategies that replace mOPV2 with IPV doses result in more expected cases and thus represent dominated options because of the negative effectiveness (i.e., denominator). However, in terms of INBs these small numbers of cases matter little whether positive or negative, such that the INBs all become negative and reflect the high incremental costs associated with the IPV use. These costs vary between $2.6 million for the small-scale strategy of IPV added during oSIA1 and $110 million for IPV added during all oSIAs. For the use of IPV in older age groups, the choice of comparator matters because it determines whether the IPV costs entirely add to the baseline (if compared to No IPV) or get partly offset by savings from not administering mOPV2 to those age groups (if compared to No IPV but expand through age 9 or 14).
Health-Economic Outcomes for Different IPV oSIA Options in Northwest Nigeria
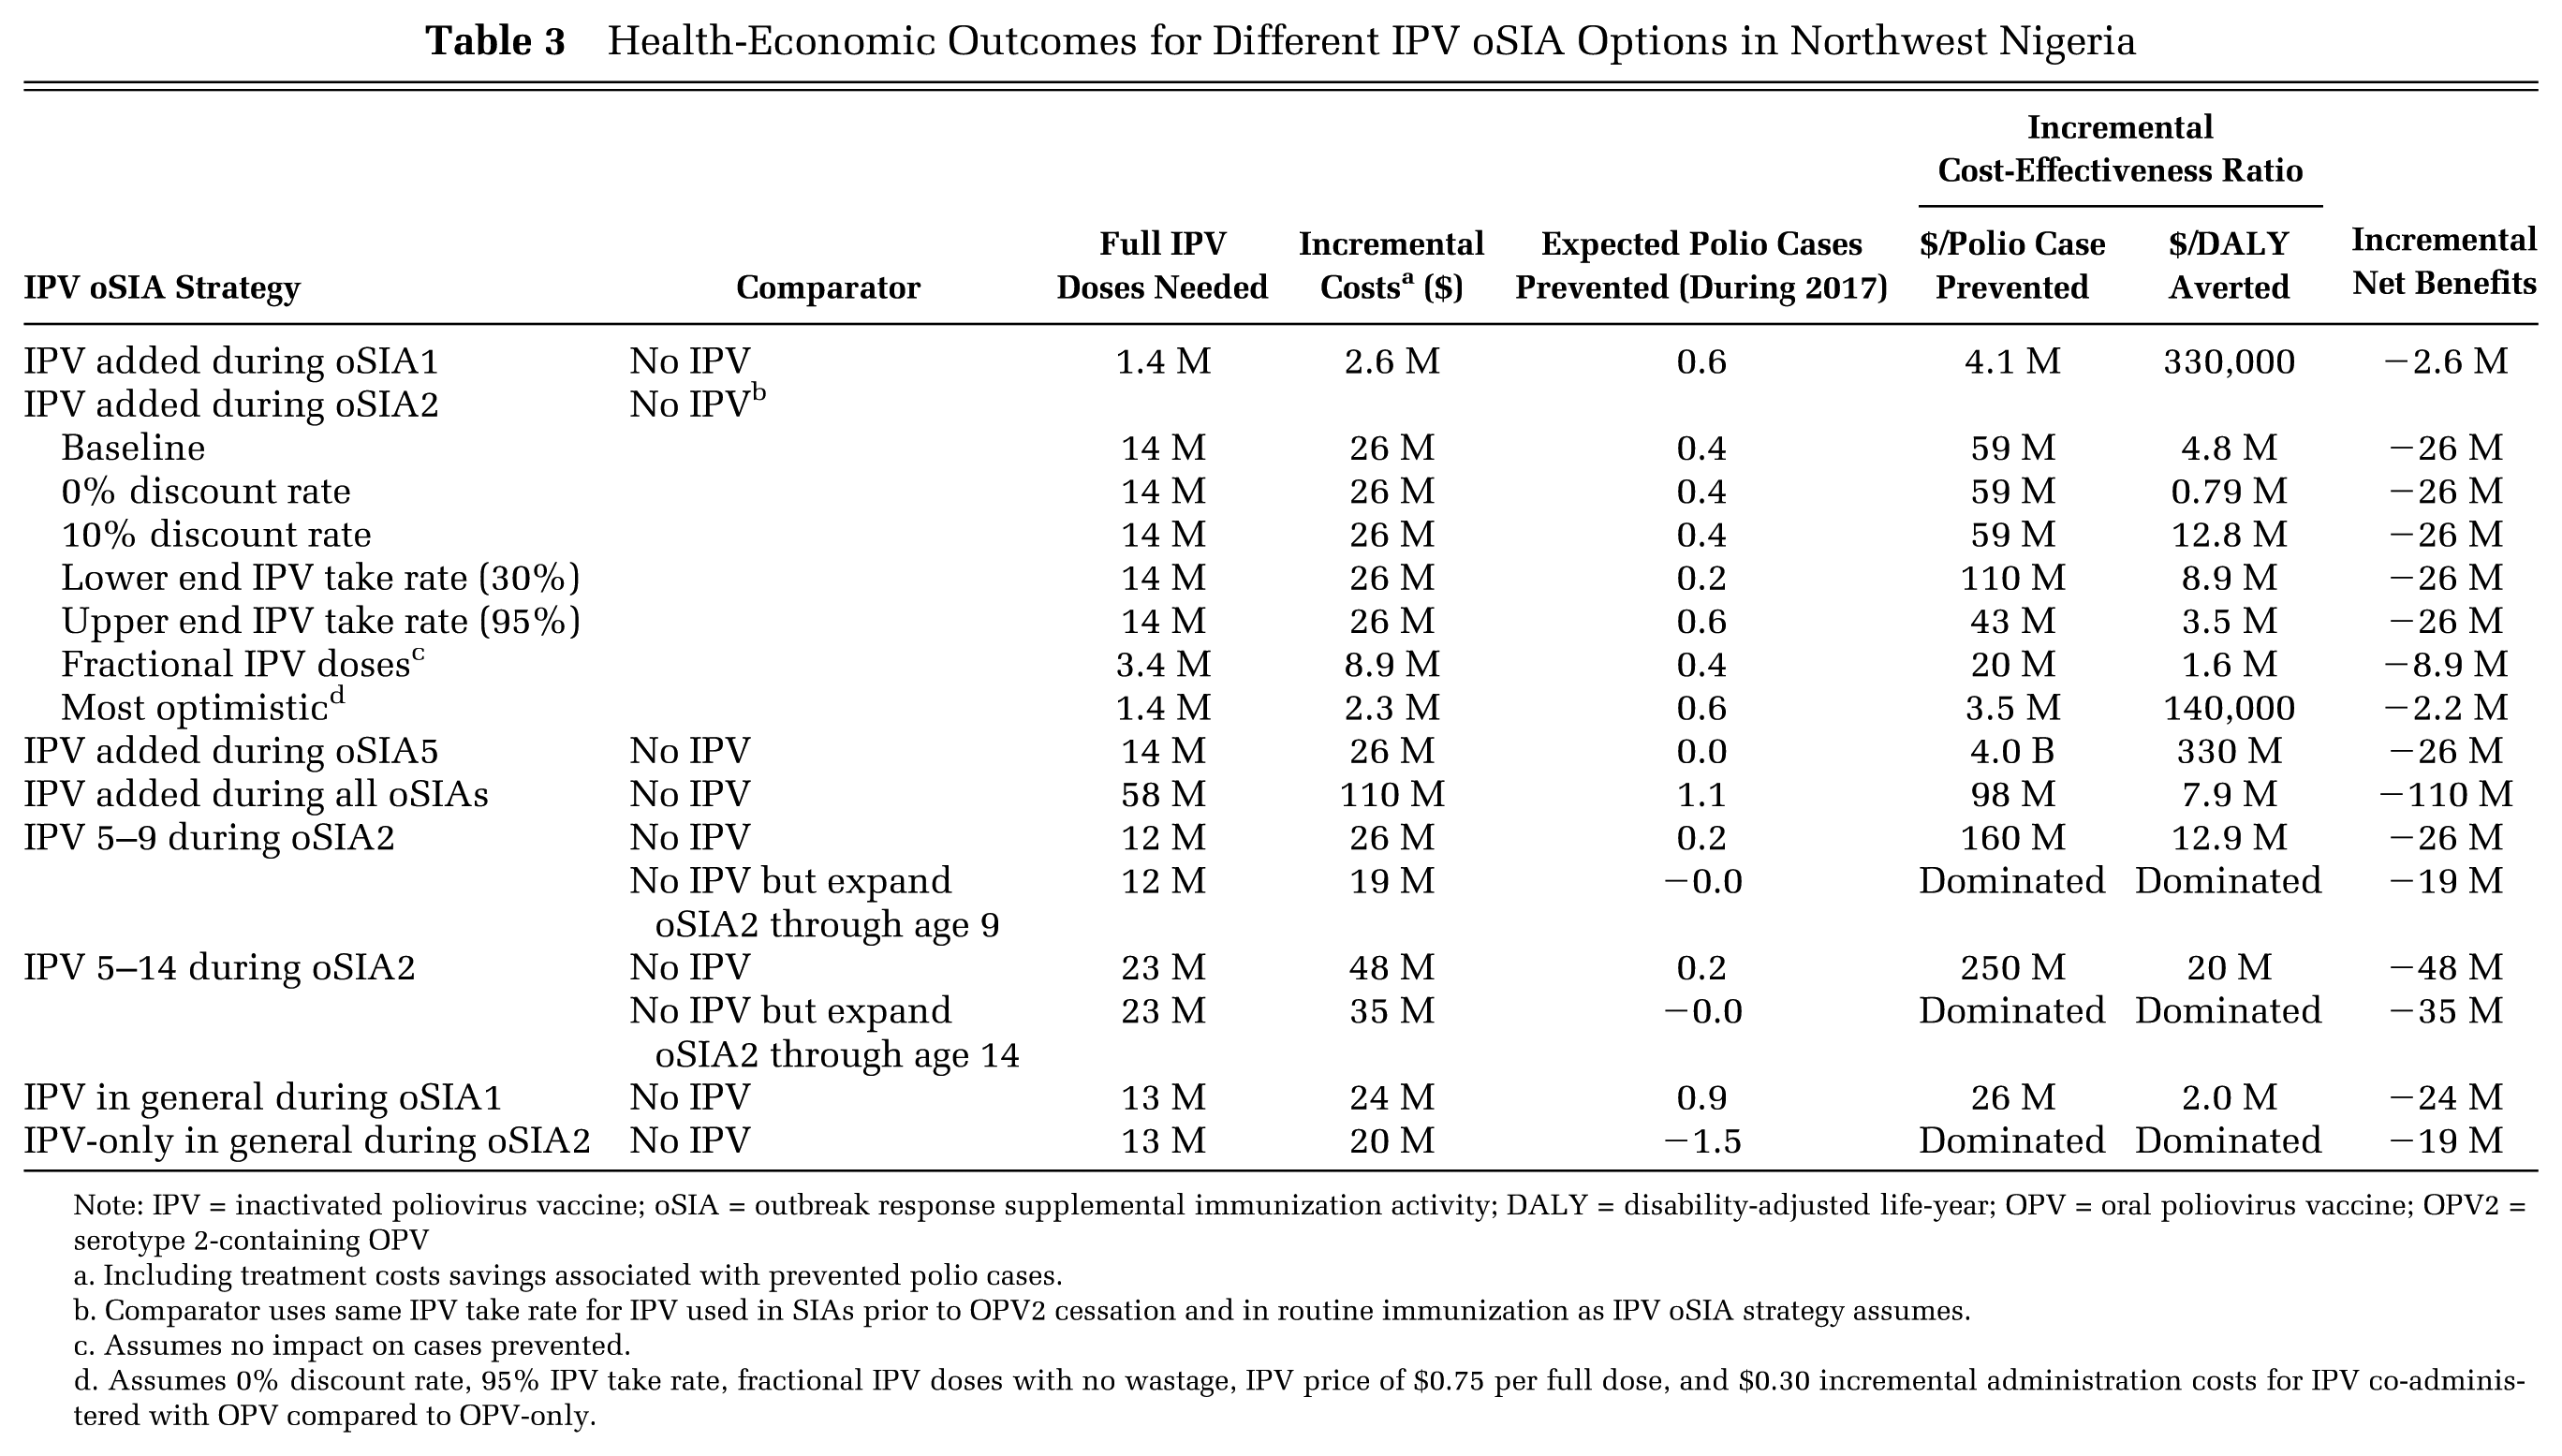
Note: IPV = inactivated poliovirus vaccine; oSIA = outbreak response supplemental immunization activity; DALY = disability-adjusted life-year; OPV = oral poliovirus vaccine; OPV2 = serotype 2-containing OPV
Including treatment costs savings associated with prevented polio cases.
Comparator uses same IPV take rate for IPV used in SIAs prior to OPV2 cessation and in routine immunization as IPV oSIA strategy assumes.
Assumes no impact on cases prevented.
Assumes 0% discount rate, 95% IPV take rate, fractional IPV doses with no wastage, IPV price of $0.75 per full dose, and $0.30 incremental administration costs for IPV co-administered with OPV compared to OPV-only.
In variations of the strategy of IPV added during oSIA2, we observed a small difference in polio cases prevented over a wide range of IPV take rate assumptions (see Online Appendix A6) but negligible effect of this on the INBs. Potential use of fractional IPV significantly reduced the IPV needs in terms of full-dose equivalents despite the increased assumed wastage (Table 2), which reduced the incremental IPV costs and (negative) INBs by approximately half. Although all incremental costs and prevented cases occur during the first year of the analytical time horizon (i.e., 2017), the discount rate affects the estimated DALYs lost and societal costs over the expected life-time of polio cases, which significantly affects the incremental costs per prevented polio case. However, because the expected number of polio cases prevented remains very small, the effect of the discount rate on the INBs remains minimal. A scenario that optimistically assumes no discounting (i.e., valuing future disability and economic loss associated with polio cases equal to immediate losses) and further makes very optimistic assumptions about IPV price (i.e., $0.75/5 = $0.15 per fractional IPV dose), wastage (i.e., no wastage), incremental IPV administration costs if co-administered with OPV (i.e., $0.30 per child), and IPV take rate (i.e., 95%) substantially reduces the ICERs and increases the INBs, but even this remains not cost-effective and not net beneficial.
Discussion
This analysis suggests very little expected health benefits of adding IPV to mOPV2 oSIAs in response to a potential cVDPV2 outbreak after OPV2 cessation in a setting conducive to fecal-oral transmission. While the model assumptions reflect the evidence of individual protection from polio for previously susceptible IPV recipients38,39 and a strong boosting effect for previously LPV-infected IPV recipients,32,33 the model results suggest that when co-administered with mOPV2, the incremental performance of IPV at the population level remains marginal. This relates to 1) the small incremental vaccine take for susceptible individuals of IPV co-administered with mOPV2 compared to mOPV2 alone, 2) the small effect of IPV-only on intestinal immunity, and 3) the limited population effect of an incremental boost of IPV co-administered with mOPV2 compared to mOPV2 alone on people that already contribute little to transmission due to prior LPV infection. In settings in which fecal-oral poliovirus transmission remains the dominant mode of transmission, rapid control of outbreaks requires above all elimination of children without existing intestinal immunity from potential participation in transmission through immunizations that induce intestinal immunity, which IPV does not provide.
While prior models demonstrated the limited effect of IPV used in routine immunization to prevent cVDPV2 outbreaks in such settings,26,27,42,50,53 this study provides the first analysis that modeled the addition of IPV to mOPV2 as part of a reactive outbreak response Although adding IPV will not reduce the performance of the outbreak response (i.e., assuming that doing so does not reduce OPV coverage), it requires substantial financial resources that make the intervention not cost-effective according to typical health-economic thresholds.47,62,63 Moreover, prioritizing IPV for children who would already receive mOPV2 as part of the outbreak response poses problems in the context of the current limited supply of IPV doses, which led to delayed introduction of IPV into routine immunization in some countries. 64,65 Models offer the luxury of testing the potential impact of using more IPV doses than actually available, but in the real world supply limitations mean that these strategies either take vaccine away from routine immunization elsewhere or remain practically infeasible. While under some circumstances justification may exist for reallocating vaccine to an emergency situation, the limited benefit of doing so in the context of an ongoing response with a cheaper and more effective vaccine presents real challenges. Moreover, IPV use in other countries remains important to maintain some level of immunity to protect against longer term risk such as iVDPV2s, with IPV expected to offer more benefits with respect to those risks in settings with less fecal-oral transmission potential and likely higher iVDPV2 prevalence compared to places most likely to generate cVDPV2 outbreaks.20,50 For example, in the immediate period following the tOPV-bOPV switch, we could create more risk by diverting IPV from a place that actually needs it (e.g., Egypt, with known high prevalence of iVDPV2s 12 ) to a place in which it will likely not affect the ability to stop an ongoing cVDPV2 outbreak (i.e., northeast Nigeria 15 ). Serious consequences could occur if the IPV supply limitations or other complications associated with using an injectable vaccine lead to delays in mOPV2 use or reduced mOPV2 coverage during an oSIA if the complications jeopardized the ability to control the outbreak and ultimately resulted in a need to restart OPV2 use.50,54 For example, the use of IPV may require a fixed-post or health camp delivery approach rather than a house-to-house approach, 66 which implies a greater chance of missing children.
The Global Polio Eradication Initiative plans to employ fractional IPV doses for outbreak response added during oSIA2, 31 which promises some improvement with respect to both IPV supply issues and expected costs compared to using full IPV doses (Table 3). Consistent with the finding that reducing the amount of IPV added to oSIAs improves the economic justification for the oSIA, no IPV use at all during oSIAs represents the best option in a setting like Nigeria based on this economic analysis. However, we caution against generalizing this finding to all settings and time periods. Understanding the implications of adding IPV to oSIAs at the global level and in the longer term requires further research, particularly as it relates to settings with better hygiene and consideration of exportations of outbreak virus or mOPV2 beyond the outbreak population. While all of our results in this study suggest that replacing mOPV2 with IPV represents a bad idea (i.e., economically dominated) for oSIAs in response to a cVDPV2 outbreak soon after OPV2 cessation, over time the risk of creating new iVDPV2s or cVDPV2s through the use of mOPV2 becomes a greater concern and IPV may represent the only polio vaccine option for outbreak response.50,54
We emphasize that the ICERs and INBs represent estimates based on a single hypothetical outbreak. The exclusion of the effect of IPV on exportation of the outbreak virus and/or of mOPV2-related viruses implies an underestimation of the benefits of IPV, but assessing the magnitude of this positive externality requires further work. Although we conducted bounding sensitivity analyses on IPV price and effectiveness assumptions, we did not conduct a comprehensive sensitivity analysis because our reliance on a historically calibrated model implies that independently varying inputs of the model will violate the historical fit with the evidence (e.g., changing R 0 values without simultaneously adapting other assumptions may lead to much shorter or longer occurrence of polio cases due to endemic WPVs than observed). Our model involves uncertainties and limitations that we previously discussed in detail2,5,40,41,44 and that similarly apply to this study. For example, different combinations of model inputs may perform equally well or better in terms of reproducing the evidence, and therefore we cannot preclude with certainty the possibility that IPV performs better than we assume. However, the clinical trial data and all models published to date suggest limited effect of IPV on fecal-oral transmission, and until compelling evidence proves otherwise, policy makers should carefully consider the implications of paying high costs to attain low expected benefits by adding IPV to oSIAs.
Footnotes
Financial support for this study was provided entirely by a grant from the Bill and Melinda Gates Foundation (OPP1129391). The funding agreement ensured the authors’ independence in designing the study, interpreting the data, writing, and publishing the report.
References
Supplementary Material
Please find the following supplemental material available below.
For Open Access articles published under a Creative Commons License, all supplemental material carries the same license as the article it is associated with.
For non-Open Access articles published, all supplemental material carries a non-exclusive license, and permission requests for re-use of supplemental material or any part of supplemental material shall be sent directly to the copyright owner as specified in the copyright notice associated with the article.