
Abstract
Keywords
Chronic hepatitis C virus (HCV) infection is one of the most important clinical and public health problems facing modern medicine, and the most common blood-borne infection in the United States. 1 Approximately 3 million Americans born between 1945 and 1975 are HCV infected. 2 Among them, an estimated 50% may be unaware of their HCV infection due to the fact the disease is often asymptomatic or accompanied by mild flu-like symptoms over many years. 3 Without diagnosis and timely treatment, infected individuals are at risk for liver fibrosis, cirrhosis, and hepatocellular carcinoma (HCC).
HCV screening can help identify HCV-infected individuals with potential liver damage and consequently allow efficient allocation of treatment resources, thus improving population health and lowering HCV-related morbidity and mortality. 4 The Centers for Disease Control and Prevention and the US Preventive Services Task Force both shifted their stances on HCV screening, recommending health care providers to offer a one-time screening test to high-risk adults and adults born between 1945 and 1965,5,6 due to new evidence showing that people born in these age cohorts account for approximately 75% of all HCV infections and 73% HCV-associated mortality in the United States. 7 Yet the cost of HCV screening and treatment is very expensive.5,8 In recent years, with the approval of many novel HCV drugs such as daclatasvir, elbasvir-grazoprevir, ledipasvir-sofosbuvir, ombitasvir-paritaprevir-ritonavir with dasabuvir, and simeprevir, up to 95% of patients with most genotypes of HCV infection going through treatment can achieve sustained virologic response. 9 Highly effective treatments have led to a dramatic rise in HCV treatment rate and drug expenditures 10 in the Veterans Affairs hospitals, Medicare & Medicaid programs, prisons, and other private health care providers. Many health care systems are facing severe budget challenges to meet their current HCV care demand.11,12
The objective of this study was to determine optimal implementation strategies for screening and treatment for the HCV birth cohort (born 1945–1975) to maximize population health in the next 10 years from the US health care payer’s perspective under spending budget constraints.
Methods
We developed a compartmental simulation model incorporating a Markov decision process of chronic HCV natural history that mimics HCV transmission, progression, screening, treatment, and death in the health care system. The model can project the societal benefit measured by the total discounted quality-adjusted life-years (QALYs) of the targeted US age cohorts with given budget limits and optimized screening and treatment implementation scenarios. The planning horizon is 10 years with a yearly budget planning cycle, shown in Figure 1. After the 10th budget planning year, all screening and treatment activities stop in the model, and the population is simulated forward until their end of life (100 years). Our goal is to determine optimal screening and treatment strategies from a US health care payer’s perspective for HCV birth cohorts (born 1945–1975) under spending budget constraints (i.e., our society’s total willingness to pay for eliminating HCV infection in these birth cohorts).

Model overview. St = proportion of the target population to screen; tt = annual budget in year t spent quarterly; Tt = proportion of the hepatitis C virus–positive population to treat every 3 months.
The decisions on the proportion of the target population to screen and the proportion of infected candidates to treat are made in each quarter (i.e., every 3 months). We consider four different implementation strategies: 1) allocate a percentage of the budget to screening, then treat patients with the rest of the budget and give treatment priority to the sickest patients (compensated cirrhosis); 2) allocate a percentage of the budget to screening, then treat patients with the rest of the budget and give treatment priority to the least critical patients (no fibrosis); 3) allocate a percentage of the budget to screening, then treat patients with the rest of the budget equally (first-come-first-serve); 4) allocate a percentage of the budget to screening, then only treat the more critical patients (portal fibrosis with numerous septa and compensated cirrhosis). If there is leftover treatment budget, then use it for additional screening until the estimated prevalence of the critical patients in the target screening population falls below a threshold, then switch to priority treatment from the most severe to least severe (similar to strategy 1).
We conducted model validation to ensure the entire budget is utilized by reallocating unspent money between screening and treatment. For example, in a quarter, a certain amount of the budget is allocated first to screening, and if there is unspent budget after screening everyone in the target screening population, the leftover money is reallocated to treatment in the same quarter. Similarly, if the budget is allocated to treatment (i.e., 0% allocated for screening first) and the budget is sufficiently large to treat all of the HCV-positive treatment candidates, then the leftover budget is automatically spent on screening. These conditions are embedded within the four strategies mentioned above.
Compartmental Simulation Model
Figure 2 shows the various population groups of a hypothetical HCV health care management system. The largest group is formed by the target screening population whose HCV status is unknown (A). Identified treatment candidates form the chronic HCV-positive portion of the system (B). The HCV-negative group (C) is formed by individuals who know they are not HCV infected either through screening or cleared infections by successful treatments or spontaneous viral clearance.
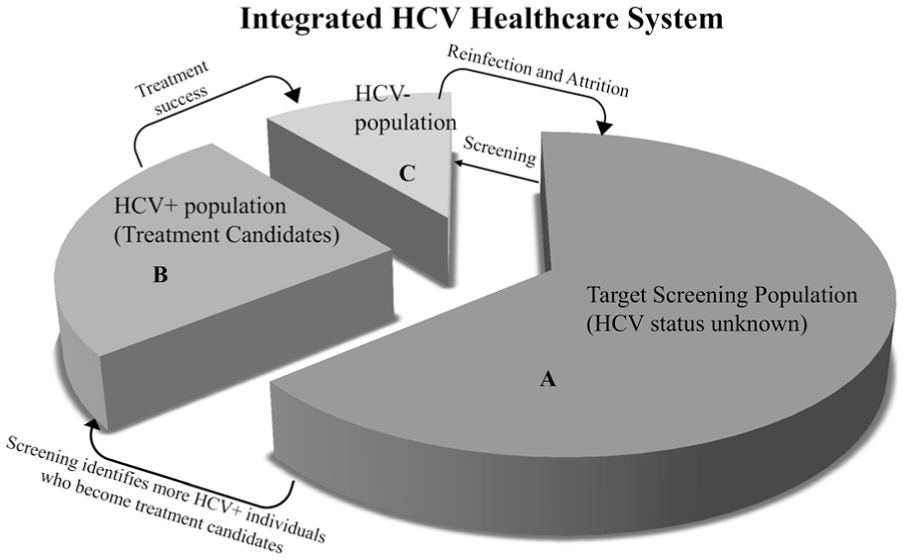
Model schematic of hepatitis C virus (HCV) care management system. The “reinfection and attrition” arrow indicates a process that individuals may rejoin the target screening group if they become reinfected or are uncertain about their HCV status through risky behavior.
Individuals move between population groups, as indicated in Figure 2. Screening may identify chronic HCV-positive individuals who become treatment candidates, and may also confirm uninfected individuals. In each quarter, treatment candidates either wait or get treated. Patients from the HCV-positive group who are successfully treated join the HCV-negative group. Successful treatment does not guarantee immunity against HCV. Individuals may rejoin the target screening group if they become reinfected or are uncertain about their HCV status. These activities are further described by mathematical equations in Online Appendix A.
Natural History Model
Similar to prior work13–15 in modeling chronic HCV infection, a Markov model is used to simulate the lifelong disease progression of chronic HCV patients, see Figure 3. Patient’s health states are defined by their liver conditions. Fibrosis staging is measured by the Metavir score, with possible transitions occurring every 3 months. The rates of HCV progression depend on age and gender.16–18 Spontaneous virus clearance, and subsequently returning to the healthy state, is only possible from the “no fibrosis” (F0) state. With effective treatment, patients transition to corresponding recovered states, stratified by their prior fibrosis severity. A proportion of patients with decompensated cirrhosis and HCC can receive liver transplantation. Individuals can die from all health states.

Natural history model. Health states include the following: healthy without HCV (H), no fibrosis (F0), portal fibrosis with no septa (F1), portal fibrosis with few septa (F2), numerous septa without cirrhosis (F3), compensated cirrhosis (F4), decompensated cirrhosis (DC), hepatocellular carcinoma (HCC), liver transplant (LT), after liver transplant (ALT), and dead (M). There are also three recovered health states, namely, recovered with history of mild fibrosis (R1), recovered with history of moderate fibrosis (R2), and recovered with history of advanced fibrosis (R3).
The Markov models for different age cohorts, gender, and treatment status are constructed using the corresponding progression parameters for the A, B, and C population groups in the HCV health care system, and are displayed in Online Appendix A, in Figures A.1 to A.4.
Solution Method
Due to the nonlinear, nonquadratic, and dynamic property of the model, we adopt a simulation approach, where we compute population health benefits (i.e., QALYs) for values of the decisions under each of the four implementation strategies. For each strategy, we considered five decision variables, ranging between 0 and 1, indicating the proportion of the annual budget allocated to screening for two consecutive years (10 years total). We conducted a grid search to find the best strategy by systematically evaluating each combination of decision variable values. The grid size was 0.2, so each of the five decision variables took on values in {0, 0.2, 0.4, 0.6, 0.8, 1.0} culminating in 65 = 7,776 simulations per implementation strategy. We also tested the probabilistic branch and bound algorithm developed by Huang and Zabinsky 19 to validate the results from the grid search and perform sensitivity analysis. The algorithm and results are described in Online Appendix D, which further confirmed our grid search results.
We created three age cohorts consisting of both genders, adopting a gender-blind policy, and divided the total budget according to the population proportions. We kept the screening and treatment proportions the same for every 2 years.
Data and Sources
In Online Appendix B, Table B.1 shows the input parameters used in the natural history model and their sources, and Table B.2 gives the cohort characteristics and their sources.
Cohort Characteristics
The model simulates screening and treatment activities in the US population, born between 1945 and 1975. The initial population distribution across the different compartmental groups (A, B, and C in Figure 2) and health states of the cohort studied is calculated from US Census data. 20 The HCV infection awareness is estimated at 50% according to the National Health and Nutrition Examination Surveys 2001 to 2008, 3 and this assumption is further explored in the sensitivity analysis. We initialize the model so that approximately half of the HCV-infected individuals are unaware of their HCV-positive status and reside in group A as potential screening targets, and the other half reside in group B as treatment candidates. Because the target cohorts are mostly older adults, the vast majority of HCV infected individuals are chronic; hence, we assume the prevalence of acute HCV infection in these populations to be small. 2 The initial fibrosis stage distribution by age group, race, and gender came from Allison and others 18 and was weight-averaged using population data from 2013 US Census to combine race and age group. The age-, gender-, and fibrosis-specific HCV population is calculated from National Health and Nutrition Examination Survey and the weighted fibrosis distribution.
Progression Parameters
Progression parameters 13 describe how an individual’s health condition progresses through the 14 health states defined in Figure 3, including fibrosis stage progression, treatment success, spontaneous viral clearance, infection and reinfection, progression after compensated cirrhosis, and mortality. These are static probabilities for an individual within an age-cohort and gender, transitioning between health states every 3 months. Together these parameters form a progression matrix, which is used in the Markov model.
Fibrosis
A chronic HCV patient’s fibrosis stage is assessed through liver biopsy or other noninvasive methods due to the risk of complications and potential sampling error from the former method. 21 The fibrosis progression probabilities (probability of patients moving through F0 to F4) depend on age and gender.16–18 Once a patient’s condition advances past F4, the progression is no longer age and gender dependent.
Treatment Effectiveness
Treatment effectiveness for sofosbuvir-ledipasvir (i.e., Harvoni, Gilead Sciences, Foster City, CA) depends on the HCV genotype (genotypes 1, 2, 4). The value is estimated at 97%.22–24 Daclatasvir plus sofosbuvir is considered for genotype 3 at 94% effectiveness. 25 In the model, effectiveness is weighted by the prevalence of different genotypes of HCV. 26
Infection and Reinfection
In our model, we simplified infection and reinfection to be a constant rate of individuals becoming unsure of their HCV infection status, rather than a rate of a susceptible population getting infected that depends on the size of the infected population, as in a traditional compartmental model from epidemiology (i.e., the Susceptible-Infected-Recovered model). We assumed that the risk of individuals being infected does not change with the effects of any treatment given in the model. This assumption is based on the observation that intervention is aimed only at a fraction of the population, and could not be expected to significantly alter the force of infection. We also assumed that a widespread screening and treatment program may not necessarily reduce individual risky behaviors that could lead to HCV reinfection. This value is estimated to be 0.0032 per person-year. 14
Mortality
Age cohort- and gender-specific mortality are computed from the US life table 2010, 27 weighted by population distributions from the US Census. The mortality from different fibrosis stages (F0 through F4) are adjusted by the non–liver-related mortality hazard ratio of chronic HCV infection. 28 The mortality for health states past F4 are from Salomon and others. 17 The mortality of recovered states is adjusted by a reduction factor of 0.9 on background mortality after successful treatment. 14
Costs and Utilities
Routine HCV antibody tests ELISA are offered to everyone selected for screening tests. Individuals with positive test results need to go through two further ELISAs, a recombinant immunoblot assay (RIBA) and a HCV RNA test, to confirm the chronic infection and genotype. Liver biopsy or FibroTest are used to stage patients’ liver conditions. The screening cost for healthy people only include the cost of ELISA test. For people with HCV infection or HCV infection history, the screening cost is a weighted combination of the costs of further testing. We assume about 50% of patients get liver biopsies and 50% of patients get the noninvasive FibroTest.
Treatment candidates are offered the sofosbuvir-ledipasvir (i.e., Harvoni, Gilead Sciences, Foster City, CA) or daclatasvir-sofosbuvir (i.e., Daklinza, Bristol-Myers Squibb, New York, NY) at a similar cost with a 50% discount on Average Wholesale Price through exclusive purchasing agreements with manufacturers. The treatment costs are assumed to be the same across different fibrosis states. We do not treat anyone past F4 state. The cost for treating liver cancer and liver transplants are not included because the budget is for screening activities and HCV drugs and treatment care only. The utility parameters are from Liu and others. 3 We did not include a utility decrement for people who are aware of their infection status.
As reported elsewhere, the authors have no specific funding source for this project. The authors in this study declared that they do not have anything to disclose regarding funding or conflict of interest with regard to this article.
Results
Base Case
The base case uses the parameter values detailed in Online Appendix B. The best solution obtained by the grid search is shown in Table 1. Column 2 gives the percentages of the annual budget allocated to screening for two consecutive years. Column 5 shows the total discounted QALYs, and column 6 shows additional QALYs above the “do nothing” case. The “do nothing” case refers to the situation where we screen no one and treat no one. The last column indicates the best implementation strategy.
Optimal Strategy and Budget Percentages From the Grid Search

Note: QALY = quality-adjusted life-year.
Incremental QALY is the difference between total QALYs of the optimal solution and the “do nothing” case.
The optimal screening and treatment strategy for all age groups under both budgetary constraints is strategy 1, where we allocate certain percentages of the budget to screening upfront, and conduct treatment with the remaining money by prioritizing patients with more advanced liver conditions first (i.e., F4 to F0). Strategy 4 sometimes has similar results indicated by the total QALYs gained, because in these cases, we are not able to finish treating all the F4 and F3 patients, and the prevalence of F4 and F3 in the target screening population does not fall below the predefined threshold; thus, strategies 1 and 4 produce the same outcomes. Comprehensive solutions for other strategies are provided in Online Appendix C.
When the budget is $5 billion per year, for age group of 40 to 49, the best strategy is to allocate 60% of the budget to screening during the first 2 years, and then emphasize treatment in the following years. This is because the prevalence of more critical patients (F3 and F4) is relatively lower in the younger age group 40 to 49, which means the pressure of treating advanced patients to avoid end-stage liver conditions is lower. The priority may be to catch as many chronic cases as possible in the early years by screening. The best strategies for age groups 50 to 59 and 60 to 69 are to allocate the entire budget to treatment during the first 2 years, and then conduct a moderate level of screening in the years to follow. This is because the prevalence of more critical patients (F3 and F4) is higher in older age cohorts, and these more advanced patients need immediate treatment to prevent them from progressing into nontreatable health states. Screening in the following years can help refill the treatment candidate pool.
When the budget is limited to $1 billion per year, for all the age groups, the best strategy is to focus entirely on treatment, with no screening. This is because money spent on screening cannot improve QALYs when these identified patients cannot get treatment under the severely limited budget.
Sensitivity Analysis on Fibrosis Awareness
We conducted sensitivity analysis on the initial distribution of fibrosis stages in groups A and B. Chronic HCV individuals who are in the target screening population may progress into more advanced fibrosis stages due to unawareness of their HCV infection. Therefore, we tested the case in which 70% of F4 and F3 patients are initially unaware of their infections and are in group A. Meanwhile, we also assumed that patients with less critical conditions (F0 to F2) are more aware of their chronic conditions and become early treatment candidates in order to maintain the same HCV prevalence in the target screening population. One possible explanation is that the people who are early in becoming aware of their infection status are healthier. We conduct the same grid search and the results are shown in Table 2.
Results for Sensitivity Analysis on Fibrosis Distribution in Groups A and B

Note: QALY = quality-adjusted life-year.
Incremental QALY is the difference between total QALYs of the optimal solution and the “do nothing” case.
Intuitively, more effort should be allocated to screening because the vast number of advanced patients (F4 and F3) in group A need to be identified in time before progressing to nontreatable health states. This is verified by the result in the case of age cohort of 40 to 49 under $1 billion per year, where some money is allocated to screening during the first 4 years. However, zero screening is done for age cohorts 50 to 59 and 60 to 69 when the budget is limited to $1 billion per year. The competition for the treatment resource in the 40 to 49 group is not as fierce as in the other older age cohorts, because the prevalence of more advanced patients is generally lower in this group.
Sensitivity Analysis on Budget Allocation in First Two Years
Another sensitivity analysis was conducted under the extreme scenario where we allocate and spend the entire budget of 10 years during the first 2 years. The results are shown in Table 3. By spending all of the money in the early years, we are able to conduct timely screening and treatment, thus improving overall QALYs. The incremental QALYs (difference between the total QALYs of optimal solution and the “do nothing” case) for both the age cohort 40 to 49 and the age cohort 50 to 50, in the $50 billion case, are large.
Results for the Sensitivity Analysis on Budget Allocation

Note: QALY = quality-adjusted life-year.
Incremental QALY is the difference between total QALYs of the optimal solution and the “do nothing” case.
Sensitivity Analysis on Larger Budget ($10 Billion per Year)
We conducted a sensitivity analysis setting the budget to be $10 billion per year for 10 years. Similar to the base case analysis, we tested all four strategies using grid search. The results are included in Online Appendix C, Table C.3. Comparing this result with the base case of $5 billion per year (Table 1), we can see that strategy 1 again performs the best and the total efforts invested in screening during early years have generally increased for all three age cohorts. This is logical because a larger budget implies that we can screen more people while ensuring that the same number of HCV-positive patients get necessary treatment in time.
Discussion
Chronic HCV infection is one of the most important clinical and public health problems worldwide. In the United States, with an estimated 1.5 million HCV-positive Americans unaware of their infection,2,29 and many among them may have been infected for decades, a significant number of people are at risk of major liver damage. Screening for people who are between 40 and 69 years of age can help identify infected individuals, assess their liver conditions, prevent further progression through timely treatment, and encourage responsible behaviors and thus decrease the chance of infecting others. There is an urgent and real opportunity to significantly improve public health by controlling a major infectious disease in the United States.
We explored two budget scenarios (an annual budget of $5 billion and an annual budget of $1 billion for 10 years) to reflect the health care system’s willingness to pay to eliminate HCV in the target birth cohorts. A rough estimate shows that in order to treat all HCV-positive individuals in these age cohorts, at least $120 billion is needed in total (assuming treatment costs $40,000 per person and no cost for screening). In year 2014, Medicare spent $4.5 billion on newer HCV drugs.30,31 These two budget constraints are set in consideration of the benchmark number of President Obama’s Fiscal Year 2016 federal budget request for treating HIV domestically, at $25.3 billion. 32 More than half of this budget is going into HIV care and treatment. We assumed the amount of financial support for HCV treatment and screening would be smaller. For example, during early 2015, the Patient-Centered Outcomes Research Institute Board of Governors approved up to $50 million for comparative clinical effectiveness research studies on the best ways to diagnose and treat HCV infection. 33 We also assumed the HCV health care system has unlimited capacity for conducting screening and treatment activities.
Several recent studies have analyzed HCV disease burden and resource consumption under updated screening and treatment scenarios.34–36 We investigated ways to prioritize screening and treatment implementation efforts when resources are limited. Under a payer’s perspective, we find that when the budget is $5 billion per year and the prevalence of advanced chronic patients (F4 and F3) is low, it is better to conduct screening in early years combined with timely treatment. When the budget is $5 billion per year, but the prevalence of advanced chronic patients (F4 and F3) is high, it is better to devote all of the budget to treatment in early years, and follow-up by a moderate screening effort to refill the treatment candidate pool. Because of the fact that screening alone cannot contribute to health gains without budget for treatment, the ideal situation would be to treat all the newly identified patients through screening as soon as possible.
Our study also provides insight on treatment prioritization strategies. Prioritizing the sickest patients for treatment gains the most population health benefit and is consistent with current medical practice guidelines (e.g., AASLD, EASL).37,38 Treatment is very costly; therefore, private and government-funded health insurance plans’ policies on coverage will differ and standards are still forming. Currently, Medicare may cover new therapies, monitoring, and follow-up tests depending on the progression of liver condition and medical necessity. 39 Medicare covers one HCV screening test ordered by a primary care doctor, and yearly repeat screening for high-risk patients. 40 Treatment prioritization policies have ethical, legal, and moral implications and should be implemented with utmost care to fairness considerations.
Our results show that for the age cohort of 50 to 59, the resources are very limited for adequate treatment, due to the high prevalence of more advanced fibrosis patients. Compared to age cohort 40 to 49, asymptomatic patients in this cohort had more time to progress into more advanced fibrosis stage. Compared to age cohort 60 to 69, fewer of the critical patients have died of old age or progressed into liver cancer in the younger group. We recommend allocating extra resources to age cohort 50 to 59 in practice, to catch more F4 and F3 patients before their condition progresses to decompensated cirrhosis or liver cancer.
Our study has a few limitations. Because we did not account for other benefits of screening such as improving the awareness of HCV and behavioral risk reduction through screening, and thus preventing onward transmission, the model may have underestimated the benefit of screening. However, an argument can be made that the presence of a screening program may not lead to behavioral risk reduction, as people may think that any potential infection will be identified and treated under the screening program. Thus, the effect of widespread screening and treatment on reinfection rate is unclear. In addition, the model only considers financial constraints (i.e., yearly budgets) and neglects any potential capacity constraints of the HCV health care system to deliver the services required in practice, such as available doctors’ appointment time, available HCV drugs, and so on. We assumed additional staff and facilities can be added, but it may not be the case in all systems. Last, we assumed the initial budget division across the three birth cohorts is proportionally fair (i.e., weighted by their population distribution). Finding the overall best combination of screening and treatment across the three cohorts by allocating a different proportion of the initial budget may produce better overall health outcomes. However, such a policy could be controversial in real-world settings, even if it gives the maximum population health outcomes.
In conclusion, how much effort should be devoted to screening depends on the scarcity of the resource and prevalence of the sickest patients in the target population. Patients with the most critical condition (compensated cirrhosis) should be treated first to achieve the highest population health.
Footnotes
Acknowledgements
The authors thank Prof. Lauren Cipriano at Ivy Business School and Prof. Jeremy Goldhaber-Fiebert at Stanford University for their valuable insights and helpful comments on this research.
References
Supplementary Material
Please find the following supplemental material available below.
For Open Access articles published under a Creative Commons License, all supplemental material carries the same license as the article it is associated with.
For non-Open Access articles published, all supplemental material carries a non-exclusive license, and permission requests for re-use of supplemental material or any part of supplemental material shall be sent directly to the copyright owner as specified in the copyright notice associated with the article.