
Abstract
Multiple new chronic hepatitis C virus (HCV) treatment regimens that include second-generation directly acting antivirals achieve sustained virologic response (SVR) in >90% of patients, with fewer side effects than previous regimens.1–5 These remarkable characteristics have led to substantial increases in the number of patients initiating therapy. However, at current prices in the absence of discounts like those gained by some purchasers,6,7 treatment costs for the approximately 3 million institutionalized and noninstitutionalized people with HCV in the United States could exceed $100 billion.8,9 A substantial majority of these costs would be due to the treatment-naïve genotype 1 HCV monoinfected patient population, the group of patients we focus on in this study.
High treatment costs pose exceptional challenges to health care systems with large numbers of patients with HCV. Private commercial payers cover a large fraction of the US chronically HCV infected patient population. In addition, the Department of Veterans Affairs (VA) 10 has more than 100,000 HCV-infected patients who are treatment-naïve. The VA patient population is of special note because they are older and have more comorbidities than patients outside VA. 11 Because of these differences and because of VA’s lower negotiated prices and cost of care, the cost-effectiveness of HCV treatments may vary between VA and non-VA populations.
We conducted analyses of the cost-effectiveness of multiple new HCV treatments for non-VA and VA populations, accounting for differences in patient characteristics and costs of ongoing care and current drug prices as well as potential reductions in these prices. We evaluated a range of currently approved HCV antiviral medications including multiple regimens whose efficacies all exceed 90% and who are currently competing for market share, in particular, sofosbuvir/ledipasvir (SOF-LDV; trade name: Harvoni, Gilead Sciences, Inc., Foster City, CA), ombitasvir/paritaprevir/ritonavir/dasabuvir (3D; trade name: Viekira Pak, AbbVie, Inc., North Chicago, IL), and sofosbuvir/simeprevir (SOF-SMV; trade name: Olysio, Janssen Pharmaceutical Company, Raritan, NJ).
Methods
Overview
Since health benefit and cost implications of chronic HCV infection and treatment accrue over a lifetime, we used a decision-analytic Markov model12,13 to follow genotype 1 HCV monoinfected, treatment-naïve, nonincarcerated individuals receiving care in VA and non-VA settings. Each cohort was stratified by sex, race, liver fibrosis status, and interleukin-28B (IL-28B) host genotype, relevant for the efficacy of older regimens. VA and non-VA cohorts differed by these characteristics and baseline age. Cohorts experienced different disease and treatment costs specific to care setting. For both settings, we evaluated current treatment strategies including interferon-free regimens. We employed a societal perspective, considering lifetime health benefits and costs, discounting both at 3% annually. 14
Starting Cohorts
Cohorts consisted of chronic, genotype 1 HCV monoinfected treatment-eligible individuals. Cohorts were assigned race-specific IL-28B genotype distributions since genotype predicts treatment response to some regimens. 15 Distribution of baseline liver disease was characterized by METAVIR scores, ranging from F0 (no fibrosis) to F4 (compensated cirrhosis). 12 Starting characteristics of both cohorts are shown in Table 1 (Appendix Tables 1 and 2; all appendixes are available online). The non-VA cohort reflected chronic HCV infected individuals in the general US population12,15,16; the VA cohort represented an older population with more advanced liver fibrosis. 17
Selected Model Inputs

Note: HCC = hepatocellular carcinoma; HCV = hepatitis C virus; DAA = direct-acting antiviral; SOF-RBV-PEG = sofosbuvir/pegylated interferon/ribavirin; SOF-LDV = sofosbuvir/ledipasvir; 3D = ombitasvir/paritaprevir/ritonavir/dasabuvir; SOF-SMV = sofosbuvir/simeprevir.
Additional model parameters, especially those related to HCV disease natural history, are shown along with a model schematic in Appendix Tables 1 to 7 and Appendix Figures 1 and 3. Additional description of parameters and their derivation and sources are described in Appendix Sections A to D.
For the VA cohort, VA actuarial models provided data on non-HCV mortality rates, which were used along with data on higher rates of mortality for age- and sex-specific mortality for individuals with chronic HCV to compute the hazard ratio shown in the table (Appendix Table 4).
As older regimens like those using boceprevir are response guided and IL-28B-specific, they have complicated sets of probabilities for their SVR rates. We provide these in Appendix Table 5.
The total quality-of-life weight for a given age and HCV disease state is computed as the product of the mean age-specific quality weight obtained from published data and the utility associated with the HCV disease state, minus any utility decrements for events that occurred during the cycle. The QALY decrement for receiving HCV treatment involves multiplying the annual utility decrement by the time on treatment.
The DAA cost is added to the peginterferon and ribavirin cost under triple therapy.
The total costs for a given age and HCV disease state is computed as the sum of the mean age-specific health care costs and the HCV-specific health state plus any costs of HCV treatment, or liver transplant that occurred in the cycle.
HCV Natural History and Mortality
Our model12,13 follows individuals with 3-month probabilities of progressing through fibrosis stages toward advanced liver disease (i.e., decompensated cirrhosis, hepatocellular carcinoma, and liver transplant) and mortality risks consistent with liver disease and other patient characteristics (Appendix Figure 1). Treatment resulting in cure can leave residual fibrosis consistent with liver disease stage at time of cure but without additional progression, though we also explore the effect of F4 progression to advanced liver disease on policy conclusions in sensitivity analyses. Aside from mortality, we assumed no difference in HCV and fibrosis natural history between VA and non-VA cohorts. For the non-VA cohort, 2009 US life tables provided sex-, age-, and race-specific mortality rates from non-HCV causes. 18 For the VA cohort, VA actuarial models provided data on non-HCV mortality rates. 19 Patients with chronic HCV have higher risk of mortality from HCV and non-HCV-specific causes12,20 (Appendix Tables 3 and 4). Individuals with more advanced liver disease have higher mortality rates.12,21 Treated individuals achieving SVR are no longer at higher risk for liver-related death and are at somewhat lower risk for non–liver-related death equivalently in both cohorts (90% of the elevated risk for those not treated22–25).
Treatment
We evaluated the following regimens: 1) no treatment; 2) 48 weeks of pegylated interferon/ribavirin (PEG-RBV); 3) response-guided therapy using boceprevir/pegylated interferon/ribavirin (BOC-RBV-PEG); 4) 12 weeks of sofosbuvir/pegylated interferon/ribavirin (SOF-RBV-PEG); 5) 8 weeks of sofosbuvir/ledipasvir (12 weeks for cirrhotic patients); (SOF-LDV); 6) 12 weeks of ombitasvir/paritaprevir/ritonavir/dasabuvir (plus ribavirin for all genotype 1a patients and cirrhotic genotype 1b patients; 24 weeks for cirrhotic genotype 1a patients); (3D); or 7) 12 weeks of sofosbuvir/simeprevir (24 weeks for cirrhotic patients); (SOF-SMV). No treatment was included in the analysis primarily for comparability with previous analyses. All strategies generally conformed to standard clinical protocols1–5,26,27 (Appendix Figure 2). As the model is not stratified by HCV viral load and as there are clinical arguments in favor of using 8 weeks for all F0 to F3 patients, 28 the SOF-LDV strategy does not limit 8 weeks of treatment to patients with viral load below 6 million IU/mL, the implications of which we explore in sensitivity analyses. The analysis did not consider retreatment due to lack of newer regimen retreatment efficacy data. The analysis also did not consider a number of other regimens whose trial-estimated efficacies, treatment duration, and drug prices are generally reasonably similar to those we evaluated, given the recency of their publication, Food and Drug Administration approval, and market entry: simeprevir/pegylated interferon/ribavirin, sofosbuvir/daclatasvir, elbasvir/grazoprevir.29–33
We assumed that treatment adherence rates were similar to those reported in trials. Since adherence in clinical settings can be lower, in sensitivity analyses representing patient populations for whom continuity of care is often challenging, we allowed up to an additional 11% 3-month risk of dropout to account for increased nonadherence for all patients outside of clinical trial settings. 13 SVR rates from treatment were lower for patients with F4 fibrosis than for those with F0 to F3 in the older regimens.26,27,34 SVR rates depended on IL-28B genotype for PEG-RBV and BOC-RBV-PEG strategies. 12 For efficacy, we used the following clinical trial results, selecting trials primarily as those submitted to the Food and Drug Administration for drug approval: NEUTRINO (SOF-RBV-PEG), 27 ION-1 (SOF-LDV), 2 SAPPHIRE-I, 4 PEARL-III and PEARL-IV (3D), 3 and COSMOS (SOF-SMV). 5 Treatment side effects caused quality-of-life decrements where severity and duration depended on regimen1–5,26,27 (Appendix Table 5, Appendix Figure 2).
Costs, Quality of Life, and Cost-Effectiveness
We estimated costs for both non-VA and VA care settings. Background health care costs were age- and sex-specific, accounting for higher comorbidity levels observed in HCV-infected individuals35,36 (Appendix Sections C.1 and C.2, Appendix Figure 3, and Appendix Table 7). For the non-VA cohort, we derived background health care costs from the Medical Expenditure Panel Survey, 37 adjusted for the chronic HCV-infected population we studied (Appendix Figure 3). Fibrosis stage-specific costs of the non-VA cohort were based on studies of HCV-related expenditures for patients relative to matched comparison enrollees in a national medical and pharmacy claims database. 36 For individuals achieving SVR in both cohorts, we assumed ongoing costs depended on current fibrosis stage and were 50% lower than pre-SVR levels 38 (as this assumption is conservative with respect to highly effective but highly expensive treatments, we varied reduction in costs widely in sensitivity analyses).16,39 VA costs were derived using a similar approach and VA data sources40,41 (Appendix Table 7).
Treatment costs depended on regimen used, duration of treatment, and medical care costs required for administration and monitoring. Costs differed between non-VA and VA care settings. In the non-VA setting, we converted Average Wholesale Prices (AWP) of drugs to costs using a conversion factor of 0.64. 42 Treatment costs also reflected frequency and severity of side effects. 43 Medical care costs on treatment reflected claims data. 36 For VA, drug prices were defined as 0.42 of AWP.40,42 We expressed all costs in 2013 US dollars, and inflation-adjusted costs from other years using the US Consumer Price Index. 44
An individual’s quality of life—expressed as quality-adjusted life-years (QALYs)—depended on age, 45 advanced liver disease, 46 and achievement of SVR. Regimens could reduce quality of life temporarily due to their side effect profiles1–5,26,27 (Appendix Table 5).
We assessed treatments cost-effectiveness’ by combining QALYs and costs using incremental cost-effectiveness ratios relative to the next-best alternative. 14
Funding Sources
The research was supported in part by a grant from the VA Health Services Research and Development Service and by grants from the National Institutes of Health. Funders had no role in the study’s design, conduct, or reporting; results and conclusion presented do not necessarily represent those of the funders.
Results
Chronic HCV infection resulted in high lifetime risks of advanced liver disease (Table 2). In the absence of HCV treatment and with its age and fibrosis distribution at baseline, the non-VA population had a 19.4% lifetime risk of decompensated cirrhosis, an 11.1% risk of hepatocellular carcinoma, and a 2.3% risk of liver transplant. Risks for these conditions in the VA population were marginally higher, reflecting older age and a more advanced fibrosis distribution.
Health Effects of Treatment Strategies for Chronic Hepatitis C Virus a
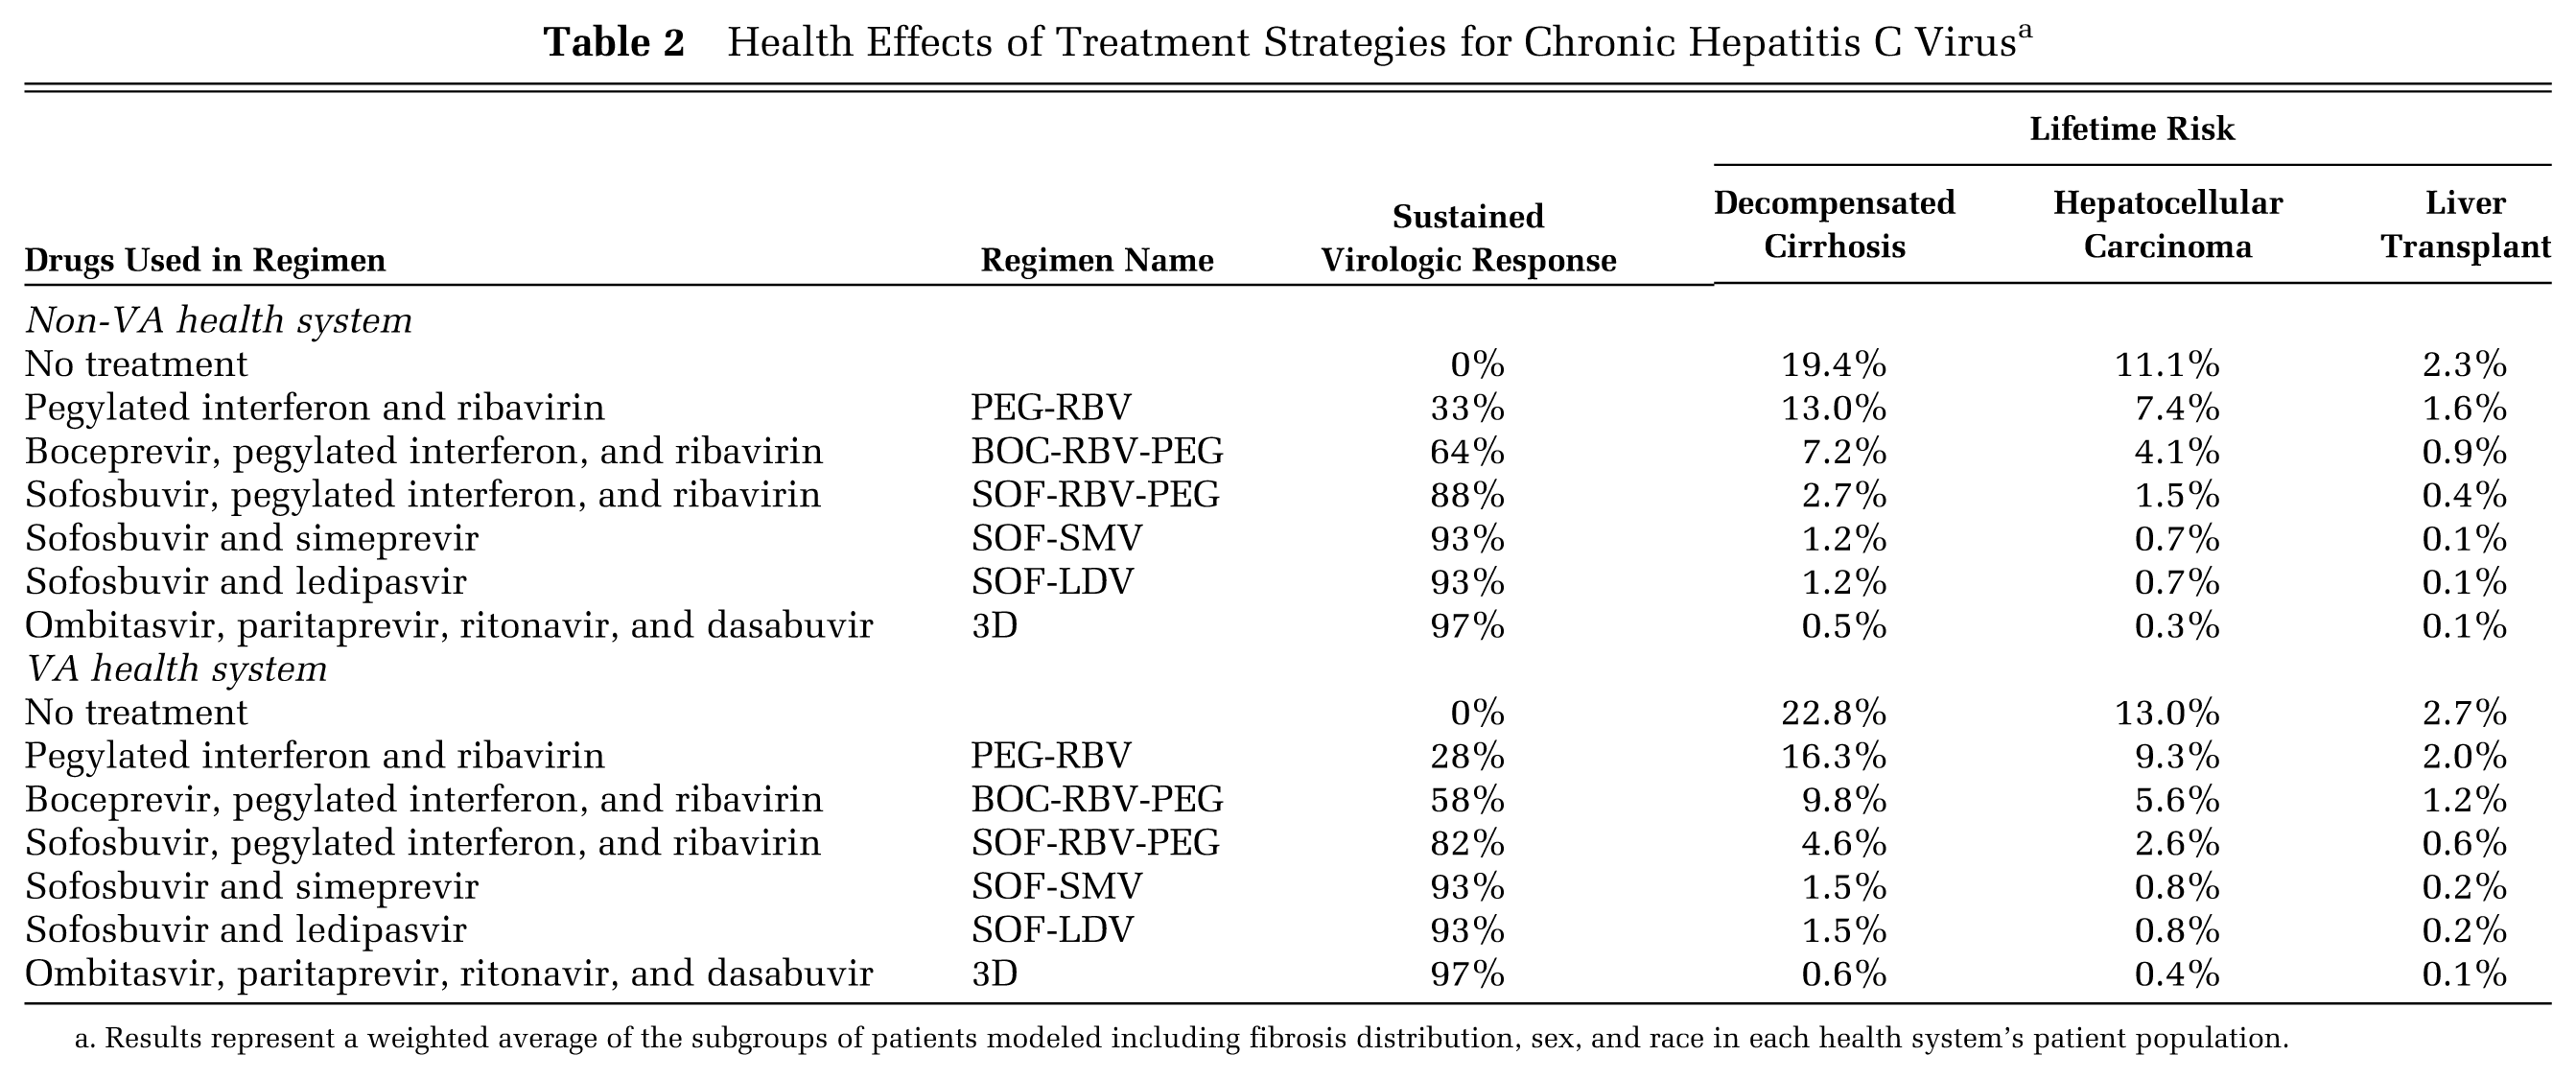
Results represent a weighted average of the subgroups of patients modeled including fibrosis distribution, sex, and race in each health system’s patient population.
Newer, shorter treatments produced substantially higher rates of SVR compared to older regimens when considering adherence as well, which resulted in appreciably larger health benefits (Table 2). The most effective regimen was 3D, which achieved SVR in 97% of non-VA and VA patients, followed by SOF-LDV and SOF-SMV, which both achieved SVR in 93%, accounting for adherence. The least effective regimen in both populations was PEG-RBV. Other older regimens achieved intermediate SVR levels. Higher SVR rates corresponded to larger reductions in lifetime risks of advanced liver disease. At trial efficacies, 3D achieves the lowest levels of decompensated cirrhosis, hepatocellular carcinoma, and liver transplant (all below 1%).
Treatment increased quality-adjusted life expectancy by reducing rates of advanced liver disease, improving survival, and increasing quality of life post-SVR (Table 3 and Figure 1, Panels A and B). Without treatment, non-VA and VA chronic HCV-infected patients lived 10.158 and 7.709 discounted QALYs, respectively. SOF-LDV, 3D, and SOF-SMV yielded the greatest QALY gains—all resulted in more than 2 additional discounted QALYs for both non-VA and VA patients. Treatment with 3D resulted in marginally higher QALYs in both populations, although differences between the three regimens are small.
Cost-Effectiveness of Treatment Strategies for Chronic Hepatitis C Virus
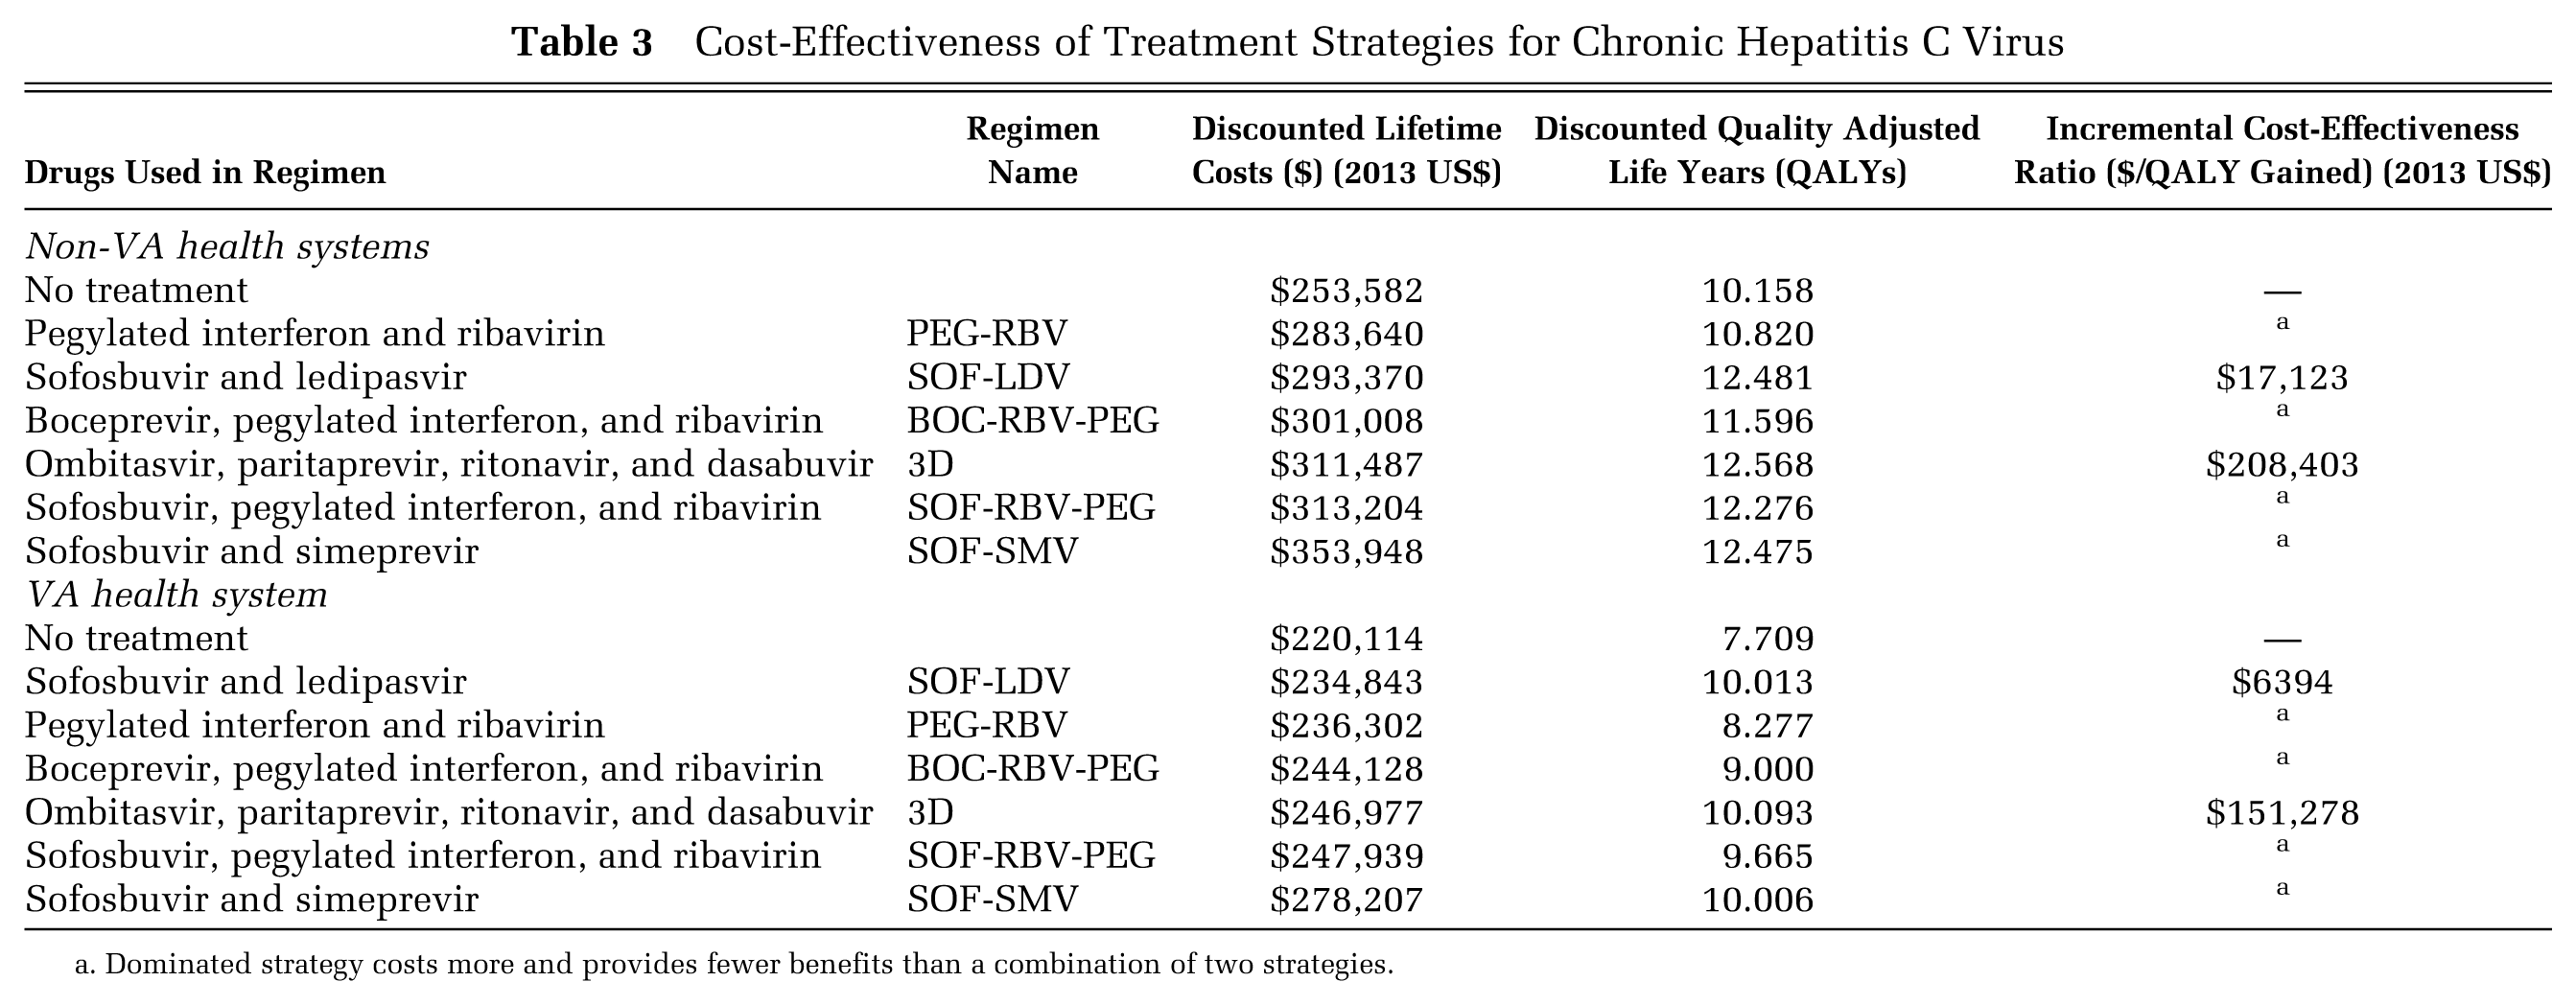
Dominated strategy costs more and provides fewer benefits than a combination of two strategies.

Efficient frontiers and cost-effectiveness acceptability curves for chronic HCV treatment regimens for the non-VA and VA health care systems. Panels A and B show the cost-effectiveness planes made up of discounted QALYs (y-axis) and lifetime costs (x-axis) for the general (non-VA) and VA patient populations. Black squares on the thick black line show nondominated regimens on the efficient frontier. Regimens shown with gray diamonds are dominated. Panels C and D show the cost-effectiveness (CE) acceptability curves made up of the proportion of PSA samples in which a given regimen has the highest net monetary benefit (y-axis) and willingness to pay thresholds up to $250,000 per QALY gained (x-axis) for the non-VA and VA populations.
Highly effective treatment regimens increased total lifetime costs from both treatment costs and because of prolonged survival (Table 3). Without treatment, the average non-VA and VA chronically infected HCV patient had $253,600 and $220,100 discounted lifetime costs, respectively. VA patients had lower average lifetime costs despite being older and sicker because of more favorable drug prices and care delivery costs. At current drug prices and discounts, SOF-LDV increased costs by $39,800 and $14,700 for the non-VA and VA patients, while 3D increased costs by $57,900 and $26,800 for non-VA and VA patients, respectively. SOF-SMV cost the most in both settings (increases of $100,400 and $58,100 for non-VA and VA patients, respectively). The total cost of 3D treatment was higher than SOF-LDV because for some patient subgroups, 24 weeks of treatment with 3D is required, whereas SOF-LDV is used for 8 or 12 weeks.
Treatment with SOF-LDV had the most favorable incremental cost effectiveness at current drug prices and discounts (Table 3, Figure 1, Panels A and B). Use of SOF-LDV cost $17,100 and $6400 per QALY gained in non-VA and VA populations, respectively, relative to no treatment (Table 3). Relative to SOF-LDV, 3D cost $208,400 and $151,300 per QALY gained in non-VA and VA settings, respectively. In both settings, these treatment options dominated all others. Findings were generally consistent in both systems for patients with particular fibrosis scores with those with similar treatment regimens used in patients with F0 and F4 fibrosis having higher costs per QALY gained, though for SOF-LDV, cost per QALY gained remained below $50,000 for F0 and F4 as well (Appendix Table 8).
Choosing Between New Drugs: Prices and Efficacies
While our main analysis finds that SOF-LDV delivers better value than 3D, both regimens are new; their pricing is evolving and translation of trial-measured efficacy to effectiveness for large populations is uncertain. We performed a series of analyses to understand the effect of efficacy and drug price on cost-effectiveness.
If 3D provided a further 20% reduction in price, its incremental cost-effectiveness ratio becomes substantially more favorable at $71,800 and $6400 per QALY gained for non-VA and VA patients, respectively (Figure 2, Panel A). At a price reduction of 30%, 3D dominates SOF-LDV in both groups. When we varied the efficacies of SOF-LDV and 3D across their trial-estimated, a 3D price reduction remained a more influential determinant of its cost-effectiveness across much of the SOF-LDV efficacy confidence intervals. At the upper end of the SOF-LDV efficacy confidence interval, a 35% to 40% 3D price reduction was required to achieve a cost per QALY gained below $50,000 (Appendix Figure 4). Importantly, just as a 30% price reductions to 3D enhances its cost-effectiveness relative to SOF-LDV, a 25% to 30% reduction in the price of SOF-LDV in response could negate any improvement in the incremental cost-effectiveness ratio of 3D (Figure 2, Panel B). Such reductions to SOF-LDV’s price would also reduce its cost per QALY gained.

The effect of regimen price reduction on the cost-effectiveness of 3D. Shown in Panel A is the effect of percent price reductions to 3D’s current price received by each system (x-axis) on 3D’s cost per QALY gained (blue line for price reductions in the non-VA system; orange line for the VA system). Shown in Panel B are the cost per QALY gained for 3D for price reductions to both 3D’s and SOF-LDV’s current prices for the non-VA system. The current prices per week for 3D in the base care for non-VA and VA systems are $4796 and $3147, respectively (Table 1).
Time Horizon
Treatment of HCV incurs upfront costs but results in prevention of progression of liver disease, the development of hepatocellular carcinoma, and liver transplants, over a period of many years. An analysis with a shorter time horizon captures the upfront costs but not all of the benefit, resulting in a less favorable estimate of cost-effectiveness. For example, in a non-VA population for a time horizon of 10 years, SOF-LDV costs $48,300 per QALY gained relative to no treatment and 3D costs over $1.3 million per QALY gained relative to SOF-LDV.
Other Sensitivity Analyses
Over a wide range of sensitivity analyses, our findings consistently show that SOF-LDV and 3D dominate other treatments and that, at current drug prices and discounts, while SOF-LDV costs less than $20,000 per QALY gained in the non-VA setting, 3D costs over $200,000 per QALY gained (Appendix Tables 8–12). Findings are consistent between non-VA settings and VA settings with SOF-LDV costing less than $8000 per QALY gained and 3D costing over $150,000 per QALY gained. Finally, while SOF-SMV delivers health benefits comparable to SOF-LDV and 3D, few scenarios short of a large price reduction cause it to become a nondominated strategy. These findings are generally consistent for patients regardless of fibrosis stage at baseline though with higher cost per QALY for those with F0 fibrosis. Likewise, they are consistent for patients treated at age 65 (Appendix Table 8). They are also consistent across a range of natural history scenarios including ones in which patients whose fibrosis progresses somewhat slower than average and in scenarios in which there is a risk of progressing to liver cancer post-SVR for patients who had progressed to F4 when treatment was initiated (Appendix Table 9). They are also consistent across many alternate assumptions regarding treatment efficacy (Appendix Table 10). Notably, if the benefit of SVR is a larger (70%) mortality reduction, then 3D achieves a cost per QALY gained below $100,000. In patient subpopulations with very high rates of reinfection, such as people who are incarcerated, incremental cost-effectiveness ratios are higher, though SOF-LDV costs less than $60,000 per QALY gained even in such a scenario. Finally, findings are robust to alternate quality of life assumptions (Appendix Table 11).
Probabilistic Sensitivity Analyses
Probabilistic sensitivity analyses (PSA) simultaneously sampled all uncertain model parameters from their respective distributions (Appendix Table 13). Over 10,000 PSA samples, for non-VA settings, SOF-LDV provided the highest net monetary benefit in 100% of samples at a willingness-to-pay of $50,000 per QALY gained and 95% of samples at $100,000 with the remaining 5% being 3D. For VA settings, SOF-LDV was preferred in 98% of samples and 3D in 2% at $50,000 per QALY gained; SOF-LDV was preferred in 72% samples and 3D in 28% at $100,000 (Figure 1, Panels C and D).
Discussion
Our analysis found that the latest generation of highly effective but costly HCV treatments delivers good value, comparable to other medical interventions commonly deemed high value, in the non-VA US population.8,47,48 In the VA population, HCV treatment is even more cost-effective, despite patients being older with more comorbid conditions. The more favorable cost-effectiveness is due to the VA’s lower cost of drugs.
New treatments for HCV continue to arrive with efficacies all well in excess of 90%,30–33 and while our study has considered numerous treatments, its main findings are properly understood about newer treatments in general—with a group of highly effective treatments of similar durations and side effect severities, price achieved for a given health system determines which regimen is most cost-effective. In our main analysis, we found that SOF-LDV delivers the most value despite modestly larger health benefits from 3D. This finding is mainly due to treatment cost, as 3D’s current pricing per 12 weeks of therapy is similar to SOF-LDV’s, but unlike SOF-LDV, subgroups of patients require ribavirin and/or 24 weeks of treatment. Because the effectiveness of several new regimens is similar, the cost-effectiveness of one regimen relative to others depends strongly on price. As new regimen prices are fluid, we identify price reductions (20% to 30%) for 3D that substantially improve its cost-effectiveness, though responsive price reductions from SOF-LDV are also possible. Additionally, the ranking of therapy by cost within a given health system can therefore depend on patient mix and hence the frequency with which particular regimen variants are indicated.
Our study contributes to prior literature in a number of ways. First, our analysis evaluated multiple recently approved drugs, updating prior high-quality cost-effectiveness analyses conducted in non-VA8,13,47–52 and VA settings.53,54 In general, our policy findings are consistent with these prior analyses, though the specific new regimen identified as cost-effective and the exact incremental cost-effectiveness ratios estimated depend on parameter assumptions specific to models relating to characteristics of the patient population, the mix of viral subtypes, and health system considered including starting fibrosis distribution, background mortality rates, and treatment and medical care costs. Additionally, as new HCV drugs have continued to be released, prior analyses have considered the regimens available when they were conducted, which are subsets of currently available regimens and hence incremental estimates may vary for this reason as well. Second, by evaluating cost-effectiveness of these drugs in both non-VA and VA populations, our study assesses how system-level differences (e.g., costs of delivering services or obtaining HCV drugs) affect cost-effectiveness—system differences in this case influence the exact cost per QALY gained but not the regimen identified as most cost-effective. Finally, it identifies the key driver of the difficult decisions between new regimens that health systems and payers face—drug price is far more influential than uncertainty about efficacy. This more general finding is important as new HCV regimens continue to be released.
Duration of coverage and time horizon are important in determining value of new HCV regimens as non-VA payers often cover individuals for shorter durations than their lifetime, in contrast to longer term engagement that VA has with its patient population. For payers with shorter time horizons (e.g., 5–10 years before the individuals they cover shift to a new insurer), new HCV treatments appear to deliver substantially less value given their high upfront costs. This highlights that increased health benefits may be foregone unless the value of HCV treatment is considered over the appropriately long time horizon.
Despite new HCV regimens’ potential for long-term cost-effectiveness, health care systems are concerned about the year-over-year budget impacts of HCV treatments, regardless of which regimen they prefer. If, as expected, treatment uptake rates exceed historical levels, total costs could exceed $100 billion to treat all patients nationally without further drug price changes. Patient prioritization may be necessary to maximize health benefits per dollar spent within constrained budgets. In fact, budget concerns have already prompted health care systems to prioritize offering treatments to patients based on characteristics such as more advanced fibrosis.55,56 Prioritization is clearly an important area for future research that should seek to identify appropriate patient subgroups for immediate treatment.
Our study has several limitations. We focused on patients receiving care in the general US health care system and the VA. However, there are other payers with large chronic HCV patient numbers (e.g., Medicare, Medicaid, and prison health systems) that our analysis does not consider. Each has similarities and differences to our groups. For example, Medicare patients are older than the commercial payer population and may have comorbidity patterns that are somewhat less severe than VA patients. However, a strength of our study is that we evaluated two substantially different patient populations and found similar cost-effectiveness. Additionally, our study focuses on individuals who are treatment-naïve and genotype 1. While continued expansion of HCV screening implies that they will make up a large share of individuals who are chronically HCV infected, 57 guidance on achieving value for previously treated patients who could benefit from retreatment is an important topic for future analysis. There is substantially less data available on regimens, costs, quality of life, and outcomes for retreatment. The SOF-LDV strategy we consider in the main analysis does not stratify treatment duration by HCV viral load. In principle, this may imply that the costs may be overestimated, and therefore, the cost-effectiveness ratio of SOF-LDV may be less favorable than we estimated and that of 3D may be somewhat more favorable than we estimated. However, the magnitude of the difference in estimated cost for SOF-LDV is not, in general, sufficiently large to alter the main findings. Furthermore, it has been argued that there are no strong statistical reasons to limit 8 weeks of treatment based on HCV viral load, 28 in which case, the strategies as modeled in the main analysis provide the appropriate cost-effectiveness ratio. The drug prices we used for our VA analysis are similar to but not identical to prices actually paid by the VA; thus, actual VA costs may differ and will change as drug prices change. Finally, our analysis uses rates of SVR similar to the randomized trials. In practice, SVR rates may be lower, which will make the cost-effectiveness less favorable than we estimated.
New efficacious but costly regimens offer good value for treatment of genotype 1, HCV monoinfected patients in both non-VA and VA populations. Sofosbuvir/ledipasvir was most cost-effective, given current prices, but ombitasvir/paritaprevir/ritonavir/dasabuvir would obtain similar cost-effectiveness with price reductions of 20% to 30%. Although new regimens can be cost-effective, these results must be considered in light of other studies that have examined the aggregate cost of treating HCV patients,8,58 which will likely prove challenging for many health care systems.
Footnotes
The research was supported in part by a grant from the VA Health Services Research and Development Service (IIR 12-059-2) and by Grant R01 DA15612-016 from the National Institutes of Health. Drs. Owens, Barnett, Holodniy, and Asch are supported by the Department of Veterans Affairs. Dr. Goldhaber-Fiebert is supported in part by a National Institutes of Health National Institute on Aging Career Development Award (K01 AG037593-01A1). The funding agreement ensured the authors’ independence in designing the study, interpreting the data, writing, and publishing the report.
The views expressed in this article are those of the authors and do not necessarily reflect the position or policy of the Department of Veterans Affairs or the US government.
References
Supplementary Material
Please find the following supplemental material available below.
For Open Access articles published under a Creative Commons License, all supplemental material carries the same license as the article it is associated with.
For non-Open Access articles published, all supplemental material carries a non-exclusive license, and permission requests for re-use of supplemental material or any part of supplemental material shall be sent directly to the copyright owner as specified in the copyright notice associated with the article.