
Abstract
Cardiovascular disease (CVD), which incorporates coronary heart disease (CHD) and stroke, is the main cause of death worldwide 1 and in England and Wales. 2 Hypertension, defined as a persistent raised blood pressure (BP) of 140/90 mmHg, 3 has been recognized as the most important modifiable risk factor for CVD.2,3 Poorly controlled high BP can damage artery walls and increase the risk of developing a blood clot. Moreover, if it is not treated it can also damage organs such as the kidneys, heart, and brain. Decision-analytic modeling (DAM) guidelines have recognized that randomized controlled clinical trials (RCTs) are good sources of evidence to judge the effectiveness of treatments; however, because the time horizon for trials often does not reflect the full duration of the impact of interventions, DAM is used to extend the results of a short-term trial over a longer time horizon.4,5 A primary outcome used in RCTs that are focused on hypertension is often change in BP. However, this is only an intermediate outcome, and DAM can be used to examine the impact of change in BP on the risk of CVD events in the longer term.
Previous research has identified the need for further investigation into the compliance of DAM to good practice and its impact on the conclusions drawn from economic evaluations. 6 Our aim is to critically evaluate how DAM in primary prevention of CVD conforms to guidelines and, in doing so, validate a framework previously developed to assess compliance to guidelines. The focus here is on one particular clinical area since this makes it possible to remove some of the variation between models that is not relevant for the purpose of assessing compliance (e.g., different outcomes, treatment options, or sources of uncertainty). CVD prevention has been selected due to the wide number of recent and available model-based cost-effectiveness studies conducted in this topic area. We focused on interventions aimed at lowering BP, as a modifiable risk factor for CVD, and sought to answer the following research question: “To what extent do model-based economic evaluations of primary prevention interventions aimed at lowering BP in patients with hypertension or at risk of developing hypertension conform to the published guidelines for DAM?”
Methods
Studies of interventions aimed at lowering BP were reviewed and the challenges faced when applying DAM methods were identified and discussed. A systematic review was conducted, meeting the UK Centre for Review and Dissemination guidance and the Preferred Reporting Items for Systematic Reviews and Meta-Analysis (PRISMA) guidelines for reporting. 7
The review followed a structured approach for framing research questions: patient population (P), intervention (I), the comparator group (C), outcome (O), and the study design (S), or PICOS. 7 Articles published from January 2000 to March 2015 and written in English were included in this review if they met all of the following conditions:
The target population was individuals presenting with high BP or at risk of developing hypertension
The intervention(s) aimed at lowering BP
Management of hypertension, as a modifiable risk factor for CVD, was part of a primary prevention strategy (when studies also included secondary prevention, we have concentrated on the results for primary prevention)
The study was a model-based economic evaluation
This review excluded systematic reviews, guidelines, trials, protocols, and conference abstracts. In addition, we also excluded studies where the interventions
Were aimed at screening BP
Were part of a polypill strategy
Measured nonadherence to treatment
Were part of a secondary prevention and treatment strategy
Searches were undertaken using terms identified by expert clinical opinion and a list of synonyms identified for each term that helped inform the final search terms used in this review (“cost effectiveness,” “mathematical model,” “decision analysis,” “Markov model,” “decision tree,” “economic evaluation,” “hypertension,” and “lowering blood pressure”). The search was undertaken using truncations and wildcards, and all synonyms were subsequently combined with appropriate medical subject heading terms (MeSH) or subject terms using Boolean operators (see Online Appendices 1 and 2).
The following databases were searched: EMBASE and Medline via the Ovid interface, and the Centre for Reviews and Dissemination’s (CRD) NHS Economic Evaluation Database (NHS-EED). In addition, we manually examined the reference lists of the studies included in this review. All articles identified by database searching were exported into ENDNOTE-X7 and duplicate references were removed.
Titles identified by the searches were screened by reading the abstract; this activity was completed by two reviewers (SJ and CP). Articles that appeared to be relevant at this point were obtained and screened against the inclusion and exclusion criteria (CP); several articles appeared relevant on reading the abstract but were subsequently excluded after reading the full article.
All studies were manually searched and data were extracted by a single reviewer (CP); any doubtful point(s) were checked with at least one another reviewer. 6 The extraction tool consisted of a framework 6 that synthesizes contemporary DAM guidelines in a single checklist instrument; this framework was developed to aid researchers assessing adherence to guidelines. The tool aided the retrieval and organization of information from each study across five dimensions (see Online Appendix 3):
Problem concept
Model concept
Synthesis of evidence
Analysis of uncertainty
Model transparency and validation
This approach ensured that the review did not miss any information related to the model building process. Data were extracted as free text and in the form of a “yes/no” response.
Results
The database search yielded 2607 studies; after removing 27 duplicates, 2580 studies were left for screening. A total of 2549 studies were excluded because they did not consider a CVD-related intervention, were not a model-based economic evaluation, or were focused on screening (Figure 1). Thirty-one full-text articles were assessed for eligibility, of which 18 were rejected as a secondary prevention strategy. Thirteen studies were included in this review, none of which were identified through other sources (Figure 1).
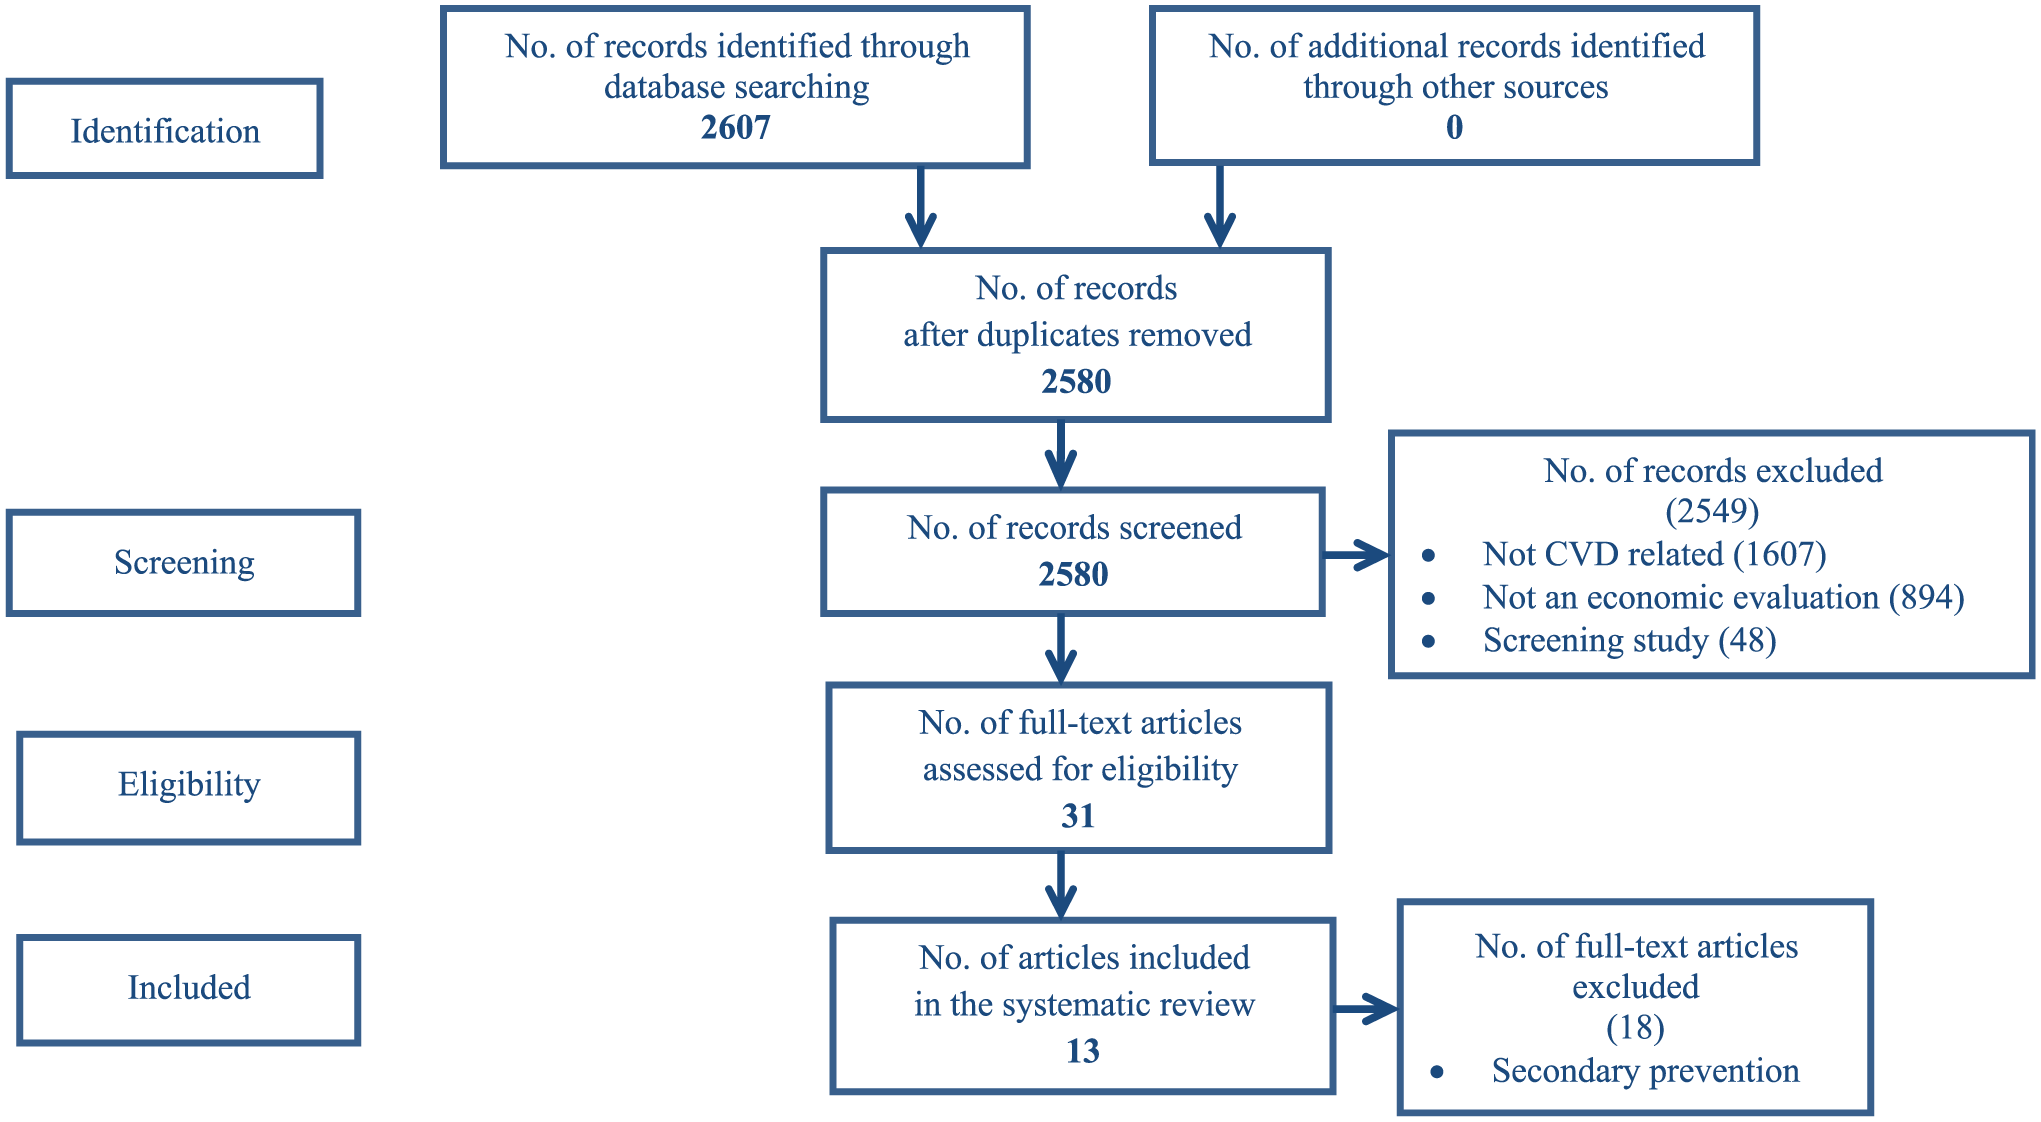
Flow chart using the PRISMA statement for the systematic review.
Only two of the studies included were published prior to 2004. Thus, it can be seen that the majority of studies (11/13) would have had access to DAM guidelines at the time of their publication (e.g., Weinstein and others 8 or Philips and others 9 ).
Four studies evaluated programs for the clinical prevention and treatment of hypertension10–13 and nine evaluated antihypertensive drug treatments to lower BP (Table 1).14–22 Ten studies were cost-utility analyses (CUA) or combined both CUA and a cost-effectiveness analysis (CEA)10–12,15–17,19–22 while three studies were CEA13,14,18 (Table 1). The intervention target (risk factor) examined was high BP. The remainder of this section describes the main findings.
Summary of Analytic Framework, Methods, and Model Features of Studies Included.

Note: ACE = angiotensin-converting-enzyme inhibitor; AMI = acute myocardial infarction; ARB = angiotensin-II-receptor blocker; BP = blood pressure; CCB = calcium-channel blocker; CE = cost-effectiveness or cost-effective; CEA = cost-effectiveness analysis; CHF = congestive heart failure; CUA = cost-utility analysis; CVD = cardiovascular disease; EchoCar = echocardiography; EVPI = expected value of perfect information; HCTZ = hydrochlorothiazide; HF = heart failure; HIS = health insurance system; HPN = hypertension; IHD = ischemic heart disease; LYG = life year gained; MI = myocardial infarction; NHB = net health benefit; NMB = net monetary benefit; LT = long term; PAD = peripheral artery disease; T_se = treated, side-effects (health state); U_cve_ua = untreated, cardiovascular event, unaffected (health state); T_cve_ua = treated, cardiovascular event, unaffected (health state); T_se_cve_ua = treated, side-effects, cardiovascular event, unaffected (health state); U_cve_af = untreated, cardiovascular event, affected (health state); T_cve_af = treated, cardiovascular event, affected (health state); T_se_cve_af = treated, side-effect, cardiovascular event, affected (health state).
Problem Concept and Model Concept
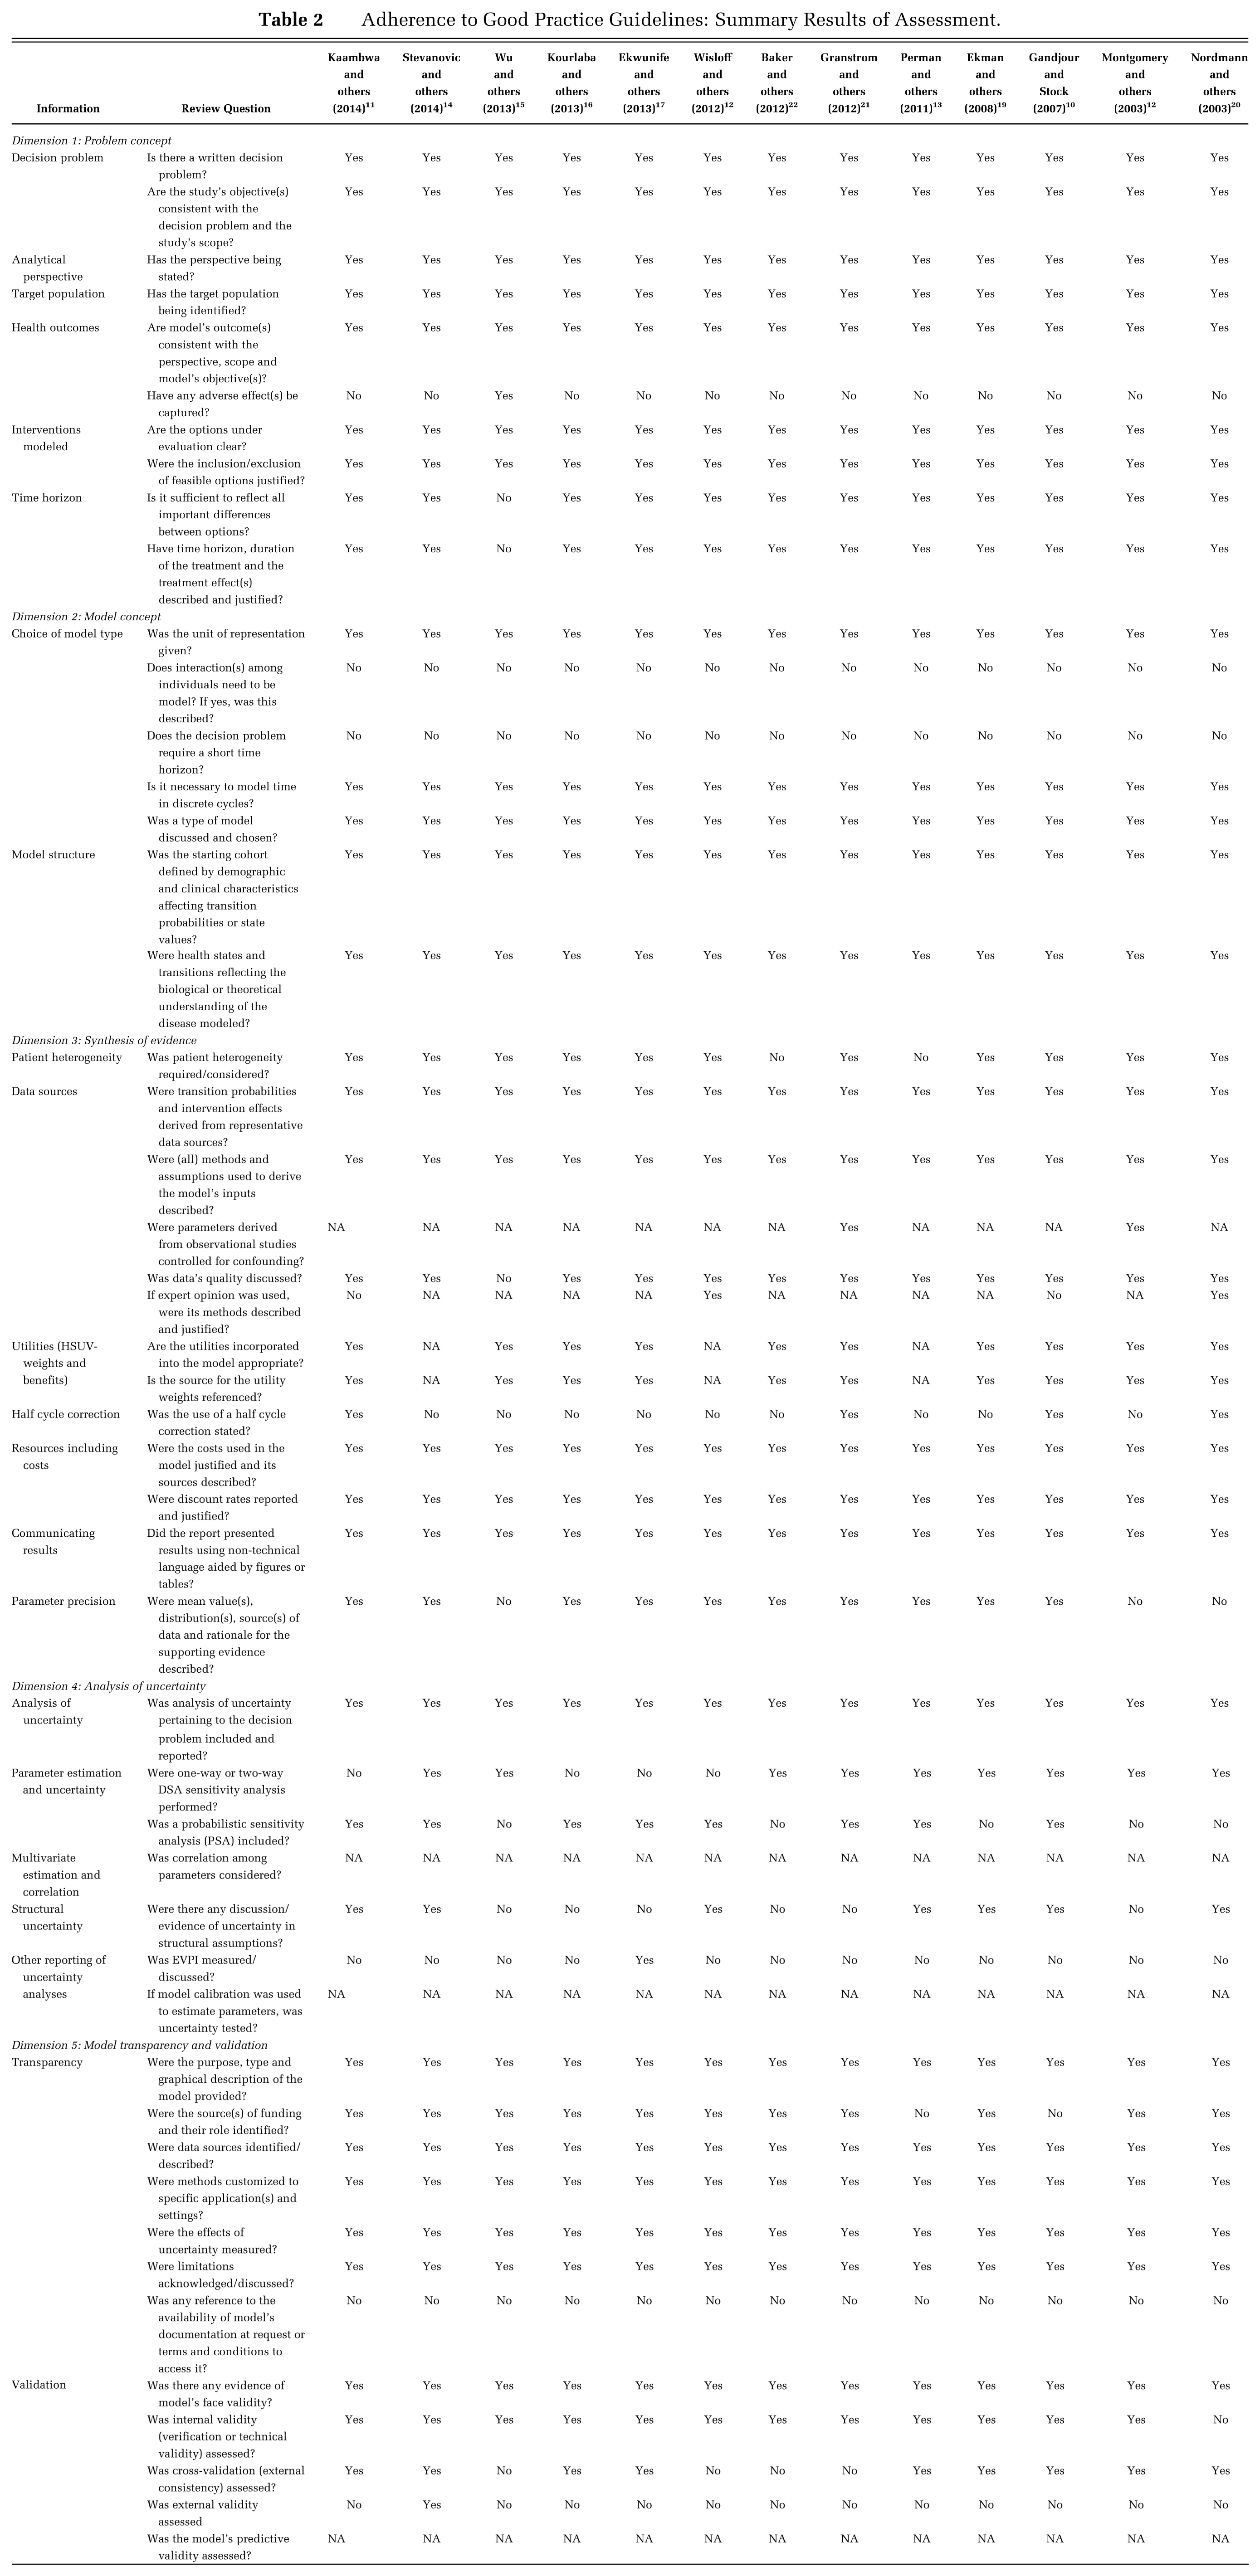
The decision problem and study objective(s) were stated in all the studies (Table 2), and all evaluated CE from a health care payer perspective. The target decision-maker audience was made explicit in 10/13 studies as that of the health care payer, that is, including only the health effects experienced by patients receiving the intervention and costs for the medical services required to provide the intervention. 23 For the remaining studies,10,14,19 the perspective was left implicit. Ekman and others 19 commented that the analysis was “in a Swedish health care setting”, while Stevanovic and others 14 were interested “in the Dutch setting” and Gandjour and Stock 10 focused on those “insured by the German SHI,” where SHI refers to the German Statutory Health Insurance.
Adherence to Good Practice Guidelines: Summary Results of Assessment.
For all studies, the target population was individuals with hypertension or at risk of developing hypertension (Tables 1 and 2), frequently stratified by gender, presence of hypertension, age groups, and mean age. The target population was always modeled as closed (reflecting members entering only at the start of the analysis).
Despite all the studies sharing a common aim, namely, primary prevention of CVD via lowering BP, these economic models compared a wide range of interventions and presented their results using outcome measures such as QALYs,10–12,15–17,19–22 life years gained (LYG),13,14,16,18,20,22 net health benefits (NHB), 18 net monetary benefits (NMB), 17 and expected value of perfect information (EVPI) 17 (Table 1).
Side effects were modeled in only one study. 15 Four studies10,11,14,22 acknowledged the lack of adverse events as a limitation of their results due to lack of data. Two studies argued that since “previous clinical trials found that first-line hypertensive drugs do not have more side effects than placebo” 13 or they have “mild side effects,” 19 there was no need to model adverse effects. Similarly another study argued that fatal side effects would have been already captured in the clinical trials via the measure of effectiveness. 18
All the studies commented on the reasons for the selection of their comparators, where their choice of comparators seems to have been governed by the scope of the study. Two studies acknowledged as a limitation the exclusion of relevant comparator(s) arguing that there may be more relevant comparators not included.19,21 Furthermore, the “do nothing” option was considered in four of the studies.10,14,18,19
All the studies used Markov models and included a figure showing the model structure; in one study, 13 the structure of the Markov model shown in the figure did not seem to reflect the structure of the model described in the text. The model structures accounted for both acute and chronic health states. Five studies made explicit reference to how the structure of their models was defined either by using an existing generic model, 18 being based on disease progression,10,11 or consisting of health states designed to reflect the course and history of CVD events. 22 One study reported that “health states in the Markov model are based on cardiovascular events measured in the previously reported registry study.” 21 For the remaining studies it was inferred that the model structure was based on disease progression.
A lifetime time horizon was adopted in all but two studies: of these, one used a 5-year 15 time horizon for a population aged 65 years while the second used 20 years for a population aged 18 and older. 22 The 5-year time horizon was justified as matching the 5-year time span given to social security authorities in China for budget planning, 15 while the 20-year time horizon was not discussed. 22 Cycle length, though rarely justified in the studies, was always 1 year. Only one study 10 justified their choice as most of the data used in their model referred to a 1-year period.
Synthesis of Evidence
Patient heterogeneity was considered in most of the studies; results were presented by age cohorts10,12,14,15,18 and gender.10–12,14–16,18,19,21 Some studies added further analyses based on the risk of CVD,10,12,17 scenarios of SBP reduction,14,19 smoking, 14 and patient adherence.14,22 The risks of secondary events were modeled in seven of the studies, for example, the risk of a further stroke after a first stroke.12–14,18–21 In some instances, assumptions were acknowledged; for example, the study by Stevanovic and others 14 assumed the risk of secondary events to be equal to the risk of a first nonfatal CVD event. The authors acknowledged that this would lead to an underestimation of the CVD risk, and so an increased risk of death in patients experiencing nonfatal CVD events was adopted. 14 In Wisloff and others, 18 secondary nonfatal events were allowed, and a patient experiencing a secondary event was assumed to be in a health state that was worse than the state they were already in. For example, a patient with stroke sequelae that experiences a myocardial infarction (MI) will have the risk and costs associated with the stroke sequelae and not those related to MI. Perman and others 13 utilized expert opinion in the assessment of the risk of secondary events. Montgomery and others, 12 due to a lack of data, assumed that any second cardiovascular event was fatal and acknowledged this as a limitation. Some studies that did not use separate states to model secondary events10,11,22 captured the increased mortality from secondary events through the mortality rate of patients surviving CVD events. Few of the studies acknowledged the lack of epidemiological data to model secondary events as a limitation.11,22
All studies applied discounting to their results: a discount rate of 3% was most common for costs and benefits;10,15,17,19,21,22 two studies used a different discount rate for costs and benefits (Stevanovic and others 14 used 4% and 1.5%, while Montgomery and others 12 used 6% and 1.5%, respectively; Table 1). Information on the parameters used as inputs were most frequently presented in tables showing mean values and the type of distribution(s) while some studies also included 95% confidence intervals or range intervals.10,11,20 The methods used to report the sources of information varied from reporting a detailed list of sources per parameter in a table to mentioning the sources of data in the main text.
Analysis of Uncertainty
The studies examined and reported uncertainty surrounding their identified outcomes through sensitivity analysis (SA). Uncertainty in parameter estimates was most commonly handled through deterministic sensitivity analysis (DSA) and probabilistic sensitivity analysis (PSA). Five studies used only one-way DSA,12,15,19,20,22 while another four11,16–18 only used PSA. Only one study measured EVPI 17 (Table 2).
Elements pertaining to structural uncertainty (SU) were acknowledged as such in six studies.10,11,13,14,19,20 Most commonly SU was assessed through SA by varying the time horizon, 11 the duration of the effectiveness of the treatment,11,14 the discount rate,13,19 or by using alternative measures of outcomes. 19 One study examined the impact of assumptions related to secondary events. 18 Lack of clinical evidence for key parameters such as the treatment effect of drugs10,11,14 was identified as a source of SU. Two studies acknowledged that they could have included more relevant comparators had they had more information,19,21 and another two acknowledged that they had excluded a potentially relevant state due to lack of epidemiological data 10 or insufficient evidence on its relevance. 20
The decision about which events and health states were included was partially discussed. Some studies acknowledged that they subdivided a health state 11 (CHD into MI, HF, and angina), or excluded a potentially relevant health state 15 (combined stroke and MI event). All studies included chronic health states (post events); however, few discussed having modeled the progression of disease.10,11,22 Most frequently, the studies acknowledged the adoption of assumptions, that is, assuming the duration of treatment effects to be lifetime or as long as the time horizon in the model,10,11,14 or 5 years 19 or varied. 21
Model Transparency and Validation
All the studies included a graphical description of the Markov model they used (Table 2). Sources of funding were identified in 11 studies: five were funded by the pharmaceutical industry,14–16,19,21,22 one benefited from joint funds from government and pharmaceutical sources, 18 three were exclusively government-funded,11,12,20 and one was privately funded. 17 None of the studies stated any means for accessing more detailed information about the model. All the studies had a clear policy context with an explicit statement of funder and developer.
Validation, according to guidelines, 24 is a set of methods for judging the accuracy of a model in making relevant predictions; in other words, validation helps readers understand what a model does and how it does it. In this review, we checked for five main types of validation. All the studies were subjected to face validity checks (having been peer reviewed and published in a journal) and they were subjected to verification (internal validity checking). The methods used were justified to a greater or lesser extent in each study. All studies undertook SA of parameters as a way to double check that the direction and magnitude of their outputs were as expected.
In terms of cross-validation, results were mixed. Eight studies10–14,17,19,20 examined different models that addressed the same problem and compared their results; however, the level of detail provided varied. Five studies presented limited or no evidence of cross-validation;15,16,18,21,22 only Wisloff and others 18 undertook an exercise of external validation by comparing their estimated lifetimes to those reported by Statistics Norway and in doing so they found that the input into their model needed to be adjusted to fit Norwegian mortality data. An assessment of predictive validity was not included in any of the studies considered.
Discussion
Using a previously developed practical framework, 6 we have critically evaluated how 13 published economic evaluations conformed to contemporaneous good practice guidelines. We found that published economic evaluations of interventions aimed at lowering BP in patients with hypertension, as part of a primary prevention strategy of CVD, demonstrated limited compliance to DAM guidelines, which has usually been explained by lack of data or imperfect data. This was particularly apparent in the assessment of SU (or lack of) and model external validation.
This review identified common grounds in terms of the adherence to, and use of, guidelines. The conceptual modeling in all the studies included in this review was based on a disease process where the focus was on the definition of the health states (conditions) as opposed to treatment (pathways) received and where the decision problem posed required the evaluation of the reduction in the risk of developing hypertension, thus explaining the use of Markov models.
It has been argued that alternative model structures can lead to variations in model predictions, 25 most importantly, in the context of a primary prevention strategy, an inappropriate model structure may lead to poorly informed policy decisions, resulting in inefficient allocation of scarce resources. 26 Models are by nature sensitive to choices made at every single stage during the model development process (i.e., model concept, model structure). There will almost always be more than one set of choices, and for this reason, guidelines have suggested assessing the extent to which model predictions are influenced by the choices made during the model development process and have suggested methods to do so, such as scenario analyses.27,28
Lifetime time horizons should be adopted (or be justified when constrained by the cohort’s lifetime), or at the very least, time horizons should be “long enough” to capture relevant differences in outcomes across strategies. 23 Lack of data or imperfect data still poses important challenges for researchers, for example, when modeling the risk of secondary events and disease progression or to attempt the assessment of model validity. Even though elements pertaining to SU were identified by various authors, the assessment of SU cannot be considered common practice in this particular clinical area and additional guidelines are still needed to aid researchers identifying and quantifying SU.
External validity still poses a challenge to researchers and, more importantly, to future guidelines due to the apparent unavailability of actual extra data (from RCT or patient-level data) to undertake the exercise. It has been suggested that instead of using all the data available to create a model, some data be set aside to use during the validation process (e.g., one third of the data). 29 This may or may not always be possible, and will depend on how much data a researcher has to build a model.
Studies included in this review shared similar research questions and yet there was a great diversity in the structures of the Markov models used. Some of these were simple and some more complex, and they were generally developed with limited justification. 26 These indicate, as suggested by Squires and other, 30 that the methods for the development of the model structure are still underdeveloped. This can lead to errors including poor validity, credibility, and no basis for model verification and the analysis of structural uncertainty.
Caro and Möller 29 described the above as the disposable approach to modeling: models are built for a single use, focused on a particular product for a relatively short time. This explains—to some extent—the reduced motivation for undertaking model validation. 29 Future research should examine whether the development of “generic models,” or as proposed by Caro and Möller, the development of multi-use models over time, can capture sufficient detail to be realistic and avoid particulars for which there are no data, and thereby allow the economic evaluation of interventions targeting CVD in any setting, and whether this will bridge the knowledge gap and, most importantly, allow ease of comparison between the results obtained from different studies.
This is the first study that has critically reviewed compliance to DAM guidelines using a previously developed practical framework. It has covered more than a decade of published DAM studies of interventions aimed at lowering BP in patients with hypertension. We believe the inclusion of recent studies from European, American, and Asian countries has helped reflect current practice worldwide.
The exclusion criteria adopted may be considered as limitation; however, these were required to guarantee consistency in the analysis. Furthermore, a negligible number of non-English-language studies were identified pertaining to applied studies. The fact that none of the studies included was published after the release of the “five-dimension framework” and the selection of one particular clinical area (and any impact on generalizability this may have) may also be considered a limitation.
Our findings seem in line with recent debate around the methodological challenges being faced by DAM where model validation and SU have been identified as fundamental problems due to the lack of motivation, time, and data to validate models and, in the case of SU, a lack of methods. 29
Footnotes
Acknowledgements
We want to thank Professor Richard McManus and Professor Jonathan Mant for their insightful comments during the design of this study.
MCPR undertook the review and analyses and wrote the first draft. All authors contributed to refined manuscript and approved the final version. The views expressed in this article are those of the authors and do not necessarily reflect the position or policy of the Health Economics Unit or the University of Birmingham.
No funding was received for this study.
References
Supplementary Material
Please find the following supplemental material available below.
For Open Access articles published under a Creative Commons License, all supplemental material carries the same license as the article it is associated with.
For non-Open Access articles published, all supplemental material carries a non-exclusive license, and permission requests for re-use of supplemental material or any part of supplemental material shall be sent directly to the copyright owner as specified in the copyright notice associated with the article.