
Abstract
In the United States, lung cancer screening with computed tomography (CT) has emerged as a new standard-of-care for certain high-risk individuals. In December 2013, the US Preventive Services Task Force—drawing from results of the National Lung Screening Trial (NLST)—recommended annual CT screening for individuals who were 55 to 80 years of age and who had a minimum 30 pack-year smoking history with no more than 15 years since quitting. 1 Following the US Preventive Services Task Force recommendations, a decision was made by the Centers for Medicare & Medicaid Services (CMS) to provide coverage for lung cancer screening using the same criteria, with the exception of the terminal age of screening, which was decreased to 77 years. 2 Given that Medicare-eligible individuals represent most of those who will be screened, criteria for CMS coverage in effect dictate the practice parameters for this new intervention.
Despite this encouraging development, projected to result in a 20% mortality reduction for eligible individuals, 3 a substantial proportion of the US population will still die from lung cancer. The identification of effective, adjunct screening biomarkers therefore remains a critically important goal. Ideally, such biomarkers could detect different attributes of a cancer’s development relative to CT (e.g., a molecular biomarker); in this way, a combined biomarker + CT screening strategy could enhance test performance. In addition, such biomarkers should be inexpensive, thereby allowing screening to be offered to smokers who are currently ineligible by CMS criteria. Researchers have already made substantial related progress. 4 In early reports, some biomarkers, such as annexin I, p53, carcinoembryonic antigen, retinol binding protein—and some multi-biomarker panels—have been reported to have sensitivity values ranging from 40% to 91% and specificity values from 75% to 84%,5–7 with possible cancer detection capability as early as 12 to 29 months prior to a lung cancer diagnosis. 8
Adjunct biomarkers are not currently used for lung cancer screening, given their early stage in development. Projections of health and economic benefits associated with such technologies are typically completed at the time of, or following, dissemination. But ideally, such analyses—which can provide key insights about the requirements for such technologies to succeed in “real-world” settings—would be performed in advance. In this study, we used a validated, computer-based mathematical model of lung cancer to evaluate seven hypothetical, combined biomarker + CT lung cancer screening strategies, simulating a combined cohort of one million men and one million women born in 1950.9–13 Leveraging the versatility of simulation methods, we extensively varied both the assumed test performance of biomarkers and the eligibility criteria for biomarker screening to identify potential health and economic tradeoffs across strategies. We compared our results to those associated with the current standard-of-care, defined here as annual CT for individuals who meet CMS coverage criteria. Our purpose was to project health and economic outcomes associated with the use of future, combined biomarker + CT lung cancer screening strategies in the US population.
Methods
Overview of the Lung Cancer Policy Model (LCPM)
We used the LCPM to project population-level outcomes consequent to multiple combined biomarker + CT screening strategies. The LCPM is a computer-based simulation model that was developed to evaluate the effectiveness, cost, and cost-effectiveness of lung cancer screening interventions at the population level.12–16 The model simulates US populations at the individual patient level, incorporating tumor development and growth, detection, follow-up, staging, and treatment. A “true” disease stage is assigned based on the individual’s simulated disease characteristics (including, but not limited to, tumor size and distant spread) and is updated at regular intervals (every month) as the individual ages. In the model, detection of a suspicious pulmonary nodule may be prompted by symptoms, incidentally, or on a screening examination. Detection of benign and malignant nodules—as well as downstream risks and procedures (e.g., biopsy, surgery)—are simulated. Because the LCPM simulates numerous details of clinical events, including specific staging examinations and treatment modalities, the model can be used to compare a wide range of cancer prevention, screening, and treatment strategies.12–16
To inform natural history parameters (i.e., probabilities of cancer development, metastasis, etc.) in the LCPM, we obtained de-identified data from NLST and Prostate, Lung, Colorectal and Ovarian (PLCO) screening trial participants, including information on smoking history, age of entry into the trial, age at each individual screen, screening outcomes, follow-up procedures, and date of death.14–16 For participants diagnosed with lung cancer, information on age at diagnoses, lung cancer stage, and lung cancer histology were provided. The outputs of the LCPM were calibrated and validated to the results from these two clinical trials. A detailed description of the LCPM is publicly available, as recorded within a designated National Cancer Institute website (http://www.cisnet.cancer.gov/lung/profiles.html).
Lung Cancer Screening Strategies: Incorporation of Biomarker Tests
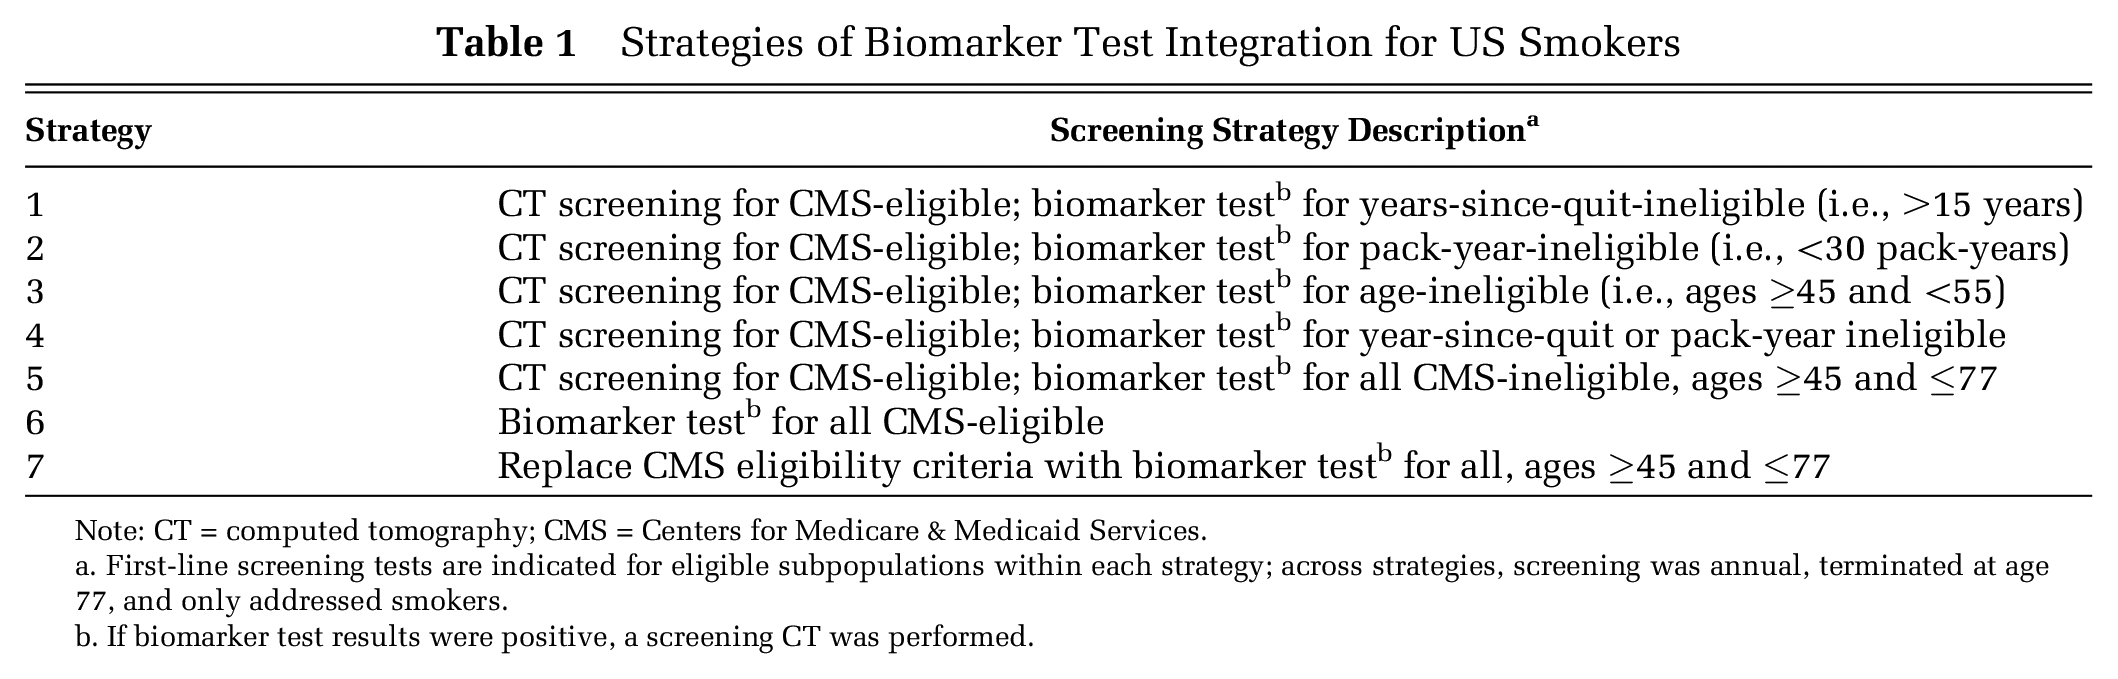
We expanded the LCPM to allow for evaluation of combined biomarker + CT screening strategies. This was readily accomplished since the LCPM explicitly models benign and malignant nodules. We developed and evaluated seven different combined biomarker + CT strategies (Table 1). In all strategies, as detailed below, screening was annual and was done on ever-smokers only. (Note: in the strategies described, the term smokers is used to describe both current and former smokers.) Positive biomarker results were followed with CT; negative results were followed by no immediate further workup, but with annual biomarker screening until age 77. Screening was terminated in all strategies at age 77.
Strategies of Biomarker Test Integration for US Smokers
Note: CT = computed tomography; CMS = Centers for Medicare & Medicaid Services.
First-line screening tests are indicated for eligible subpopulations within each strategy; across strategies, screening was annual, terminated at age 77, and only addressed smokers.
If biomarker test results were positive, a screening CT was performed.
In Strategies 1 to 3, smokers eligible for screening under CMS criteria underwent standard-of-care first-line screening (CT alone). However, the screening population was expanded. Smokers who failed to meet one—and only one—of CMS’ eligibility criteria (due to having >15 years-since-quit [Strategy 1]; having <30 pack-year history [Strategy 2]; or being ≥45 but <55 years old [Strategy 3]) were screened with the biomarker test first. If biomarker results were positive, a follow-up CT was performed.
In Strategy 4, as above, smokers eligible for screening under CMS criteria underwent first-line, screening CT. However, the screening population was expanded to include biomarker screening for smokers who had either >15 years-since-quit or <30 pack-year history.
In Strategy 5, as above, smokers eligible for screening under CMS criteria underwent first-line, screening CT. However, smokers ≥45 years of age who did not meet criteria underwent first-line biomarker screening.
In Strategy 6, all individuals eligible for screening under CMS criteria underwent biomarker screening as a first-line test; as above, patients with positive results underwent follow-up CT.
In Strategy 7, all smokers ≥45 underwent first-line biomarker screening (regardless of whether or not they met CMS eligibility criteria); as above, patients with positive results underwent follow-up CT.
Additional strategies evaluated included the current standard-of-care, that is, CT screening for CMS eligible individuals; and a no-screening strategy, for reference.
Sensitivity and Specificity of Biomarker Tests
In the LCPM, the sensitivity and specificity of a screening test were user-defined inputs. In other words, given the sensitivity and specificity of a biomarker test, the test returned positive or negative results depending on the true disease status of the individual. When applying follow-up CT (for positive biomarker results), we assumed conditional independence between biomarker and CT performance characteristics. In the LCPM, CT sensitivity depends on nodule size; specificity is independent of nodule size. Sensitivity varies with size and was previously estimated during calibration to a single-arm screening trial. 9 CT was estimated to have a sensitivity of 63% for 1 to 4 mm nodules, 77% for 4 to 8 mm nodules, and 100% for nodules >8 mm. CT specificity is assumed to be 74%.
In the biomarker literature, a biomarker test is often characterized by a receiver operating characteristic (ROC) curve. 17 The performance of the biomarker test is represented by the area under the ROC curve (AUC). We generated five ROC curves (AUC = 0.55, 0.65, 0.75, 0.85, and 0.95) to examine the effects of varied biomarker test performance on health outcomes (see the appendix). Each ROC curve is represented by multiple pairs of sensitivity and specificity values; the details of ROC curve construction are provided in the appendix.
Notably, in the biomarker literature, the capability of some biomarker tests for detecting lung cancer is restricted to certain subtypes.18,19 Therefore, we also examined strategies’ performance in the setting of three histology-specific biomarker tests, in which biomarkers could detect: 1) non–small cell lung cancer (NSCLC) and small cell lung cancer (SCLC), 2) NSCLC, or 3) NSCLC, except squamous.
Model Simulations and Assumptions of the Base-Case Analysis
We ran model simulations corresponding to the seven combined biomarker + CT screening strategies and five ROC curves (with representative point estimates for each curve). We additionally ran model simulations for standard-of-care CT screening (using CMS eligibility criteria), and for a no-screening strategy. Each model run simulated a combined cohort of one million men and one million women born in 1950, a birth cohort that came of lung cancer screening age during the years of NLST (the study with which our mortality reduction results were validated). Notably, the model is designed such that population characteristics critical to the current analysis (e.g., pack-year history at the time of screening) can be incorporated; this allows for accurate postimplementation projections associated with the aforementioned screening strategies.11–13 Since our goal was to compare strategies based on their effectiveness and efficiency, all simulations were performed assuming 100% adherence. Additionally, simulations assumed that screening history had no influence on subsequent smoking behavior.
For our base-case analysis, we selected a single test performance point (sensitivity = 0.75, specificity = 0.95) from one ROC curve (AUC = 0.95) in order to generate a set of results that would allow for rapid, simple comparison of outcomes trends across strategies. For each strategy, we projected 1) lung cancer–specific mortality reduction, 2) costs associated with screening tests, and 3) the number of individuals screened. Since biomarker tests are not currently used for lung cancer screening, there is no specific cost or reimbursement information available for such tests. Therefore, in our analysis, we designated one CT scan to represent one “unit” cost. In the base case, we assumed that the biomarker test had no additional associated cost. Although a new screening biomarker will not have zero cost, any cost selected for the purposes of this analysis would be somewhat arbitrary, considering the wide range in costs for existing biomarkers and the uncertainty about where in that range a lung cancer screening biomarker would fall. The base case serves essentially as an anchor, to allow for simplicity in interpretation of the results and sensitivity analysis. In sensitivity analysis, as further detailed below, costs of biomarker tests were evaluated in reference to CT costs (i.e., if both CT and the biomarker test had the same cost, then they would both cost 1 unit, whereas if the biomarker test cost twice that of CT, the biomarker test would cost 2 units, etc.).
Comparison of Biomarker Strategies: Efficiency Frontier Analysis
We additionally sought to determine the tradeoff between maximizing health benefits of combined biomarker + CT screening (here, lung cancer mortality reduction) while minimizing screening costs. We compared the tradeoffs of different strategies using an “efficiency frontier.”14,20 “Efficient” strategies were those that prevented the greatest number of lung cancer deaths for the same weighted unit costs of screening tests.
Importantly, since some biomarker + CT strategies under evaluation extended the population of screened individuals, comparisons of mortality reductions—across strategies—within screened individuals would be flawed (because the numbers screened would vary). Therefore, in our study, other than for the purposes of validation, we consistently report lung cancer–specific mortality reductions for the whole simulated cohort (i.e., the whole population, whether individuals were screened or not) for each strategy.
Sensitivity Analysis
In sensitivity analyses, we varied the sensitivity and specificity (from 0% to 100%, respectively) of the biomarker screening test and evaluated associated trends across strategies. In addition, we varied the cost of the biomarker test (from 0.5× to 2× that of CT) to determine effects on strategy efficiency. Finally, analyses were performed corresponding to multiple points of multiple ROC curves; as described above, representative analyses are presented for simplicity.
Validation
In order to verify our results, we performed a subgroup analysis to project the lung cancer–specific mortality reduction associated with the subgroup of patients who underwent standard-of-care screening. This estimate was compared to corresponding NLST results to evaluate the similarity of projections. 3
Results
Model Validation
The cumulative mortality reduction of standard-of-care screening (CT alone, using CMS eligibility criteria) is shown in Figure 1. The projected lung cancer–specific cumulative mortality reduction due to screening, when averaged over the total simulated US population, was 8.3%. Within the subgroup of patients who met CMS eligibility criteria, this projection increased to 21.3%, which is similar to the observed value from the NLST (20.0%) 3 ; this level of similarity provides a source of validation for our results (Supplemental Figure S1).
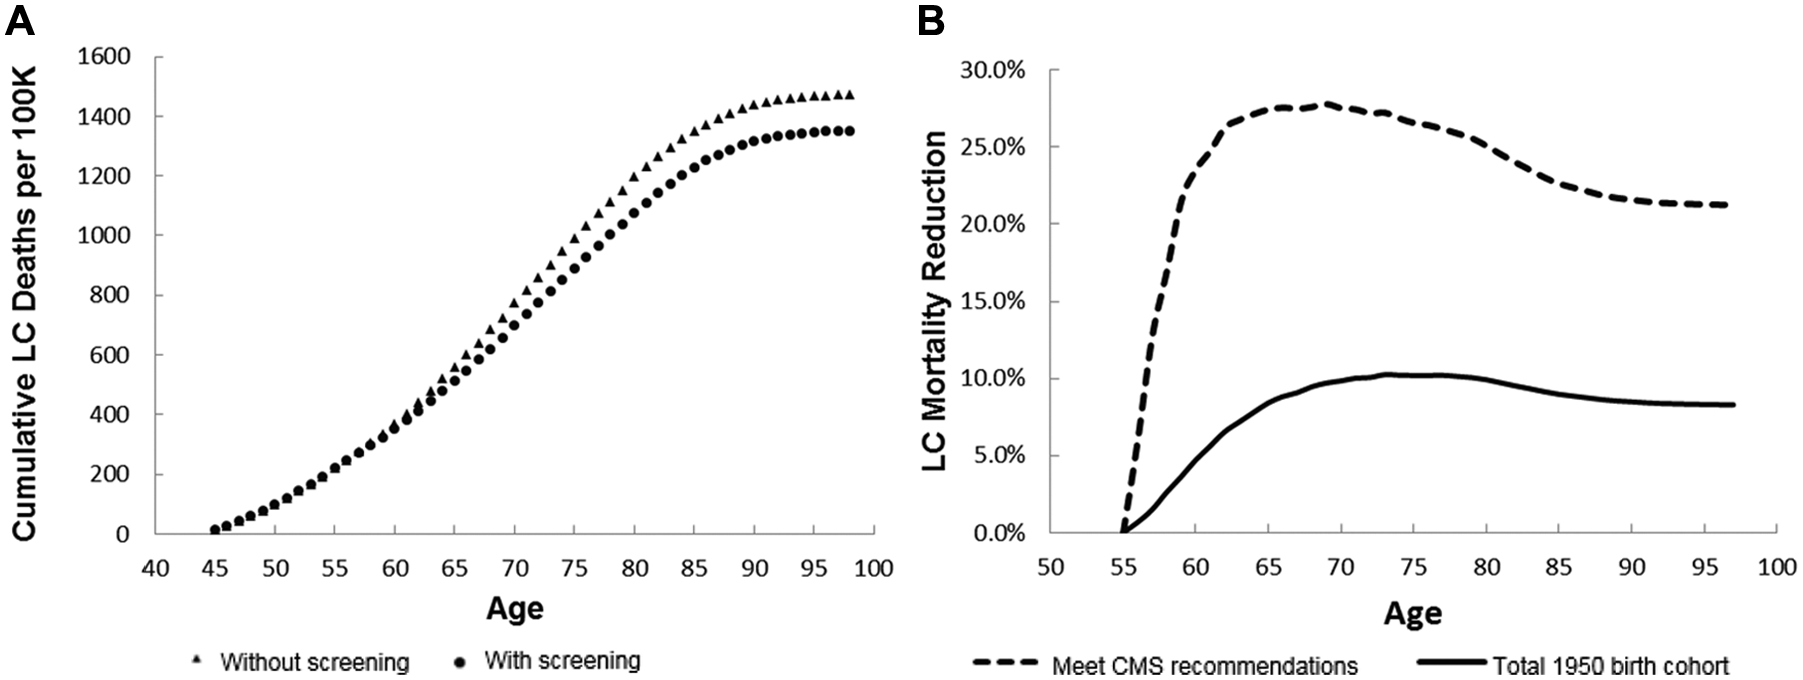
Cumulative lung cancer deaths and mortality reduction. (A) Cumulative lung cancer deaths per 100,000 for a 1950 birth cohort are shown. The triangles and circles correspond to cumulative lung cancer deaths without and with screening, respectively. (B) Lung cancer mortality reduction as a function of age for the 1950 cohort (solid) and for the people who satisfied CMS’s eligibility criteria (dashed). For the latter subgroup, the projected overall lung cancer–specific mortality reduction was 21.3%, which was similar to the observed value from the NLST (see the Results section for further details). CMS = Centers for Medicare & Medicaid Services; NLST = National Lung Screening Trial; LC = lung cancer.
Base-Case Results: Comparison of Study Outcomes Across Strategies
Table 2 provides projections of cancer-specific mortality reductions, unit costs (in the base case, the cost of a CT = 1 unit and the cost of a biomarker test = 0 units), and the percentage of individuals screened for all strategies evaluated. Under base-case assumptions, the highest lung cancer–specific mortality reduction was associated with Strategy 5 (CT screening for CMS-eligible smokers, and first-line biomarker screening for all CMS-ineligible smokers ages ≥45 and ≤77). The lowest was associated with Strategy 6 (first-line biomarker screening for all CMS-eligible smokers).
Base-Case Analysis Results: Projected Cancer-Specific Mortality Reductions, Unit Costs/100,000 Persons, and Proportions of Individuals Screened With CT Across Strategies

Note: CT = computed tomography; CMS = Centers for Medicare & Medicaid Services.
Standard-of-care strategy, that is, annual screening for smokers meeting CMS eligibility criteria.
One “unit cost” was designated to be equivalent to the cost of screening one CT scan (see Methods for further details). The provided base-case results assume 1 unit cost for any screening CT performed (first-line, or as a follow-up to a positive biomarker test), and 0 unit cost for any biomarker test.
In some strategies, smokers who were ineligible for CT screening could qualify for biomarker screening in more than one way (i.e., too few pack-years for CT screening or too many years-since-quit for CT screening). In Supplemental Table S1, Strategy 4 is used as an example to show the population stratified by CMS eligibility criteria, and subsequently the percentage of the population eligible for biomarker screening. The table shows the percentage of the population who is eligible for a biomarker test even though they fail to satisfy the pack-years criteria, fail to satisfy the years-since-quit criteria, or fail to satisfy both.
Histology-Specific Biomarker Tests
In Figure 2, we present lung cancer–specific mortality reductions that were achieved, for each strategy, when a biomarker test with base-case performance characteristics could detect NSCLC + SCLC, NSCLC, and NSCLC (except squamous). Our results indicated that there is minimal difference in lung cancer–specific mortality reduction between tests that can detect NSCLC + SCLC and tests that can detect only NSCLC. However, in Strategies 4 to 7, we found that the limitations of a biomarker test that could not detect squamous cell cancers were more pronounced. In particular, for Strategy 7 (first-line biomarker screening for all smokers ≥45 and ≤77, regardless of whether CMS criteria are met), we found that the failure to detect squamous cell lung cancers could attenuate mortality reductions by up to 5.7%, relative to the other histology-specific tests considered.

Lung cancer mortality reduction associated with histology-specific biomarker tests (within combined biomarker + CT screening strategies). Findings demonstrate minimal within-strategy differences in effectiveness attributable to the use of biomarkers that could detect NSCLC + SCLC versus NSCLC. Limitations of a biomarker that could not detect squamous cell cancer, however, were more pronounced, particularly for Strategies 4 to 7. Base-case biomarker performance (sensitivity = 0.75 and specificity = 0.95) was assumed. CT = computed tomography; LC = lung cancer; SCLC = small cell lung cancer; NSCLC = non–small cell lung cancer.
Efficiency Frontier and Sensitivity Analyses
Figure 3 plots each strategy on efficiency frontiers, weighing lung cancer–specific mortality reduction against the unit costs of screening tests; again, base-case performance characteristics for the biomarker test were assumed. The origin of the graph corresponds to the no screening scenario. If the biomarker test were free (Figure 3A), then the standard-of-care strategy (CT alone, using CMS eligibility criteria) would not be considered efficient. Strategies 5 to 7 would be considered efficient.

Efficiency frontiers: Lung cancer mortality reduction versus screening costs. Efficiency frontiers (lung cancer mortality reduction v. unit costs) were generated; two scenarios of biomarker test cost are shown. Base-case biomarker performance characteristics (sensitivity = 0.75 and specificity = 0.95) were assumed. (A) For a free biomarker test, only Strategies 5 to 7 were on the efficiency frontier. (B) When the cost of a biomarker test was equal to that of a screening CT scan, standard-of-care CT screening (“X”) is on the efficiency frontier. All additional combined biomarker + CT strategies utilized more resources than the current standard-of-care, as expected. CT = computed tomography; LC = lung cancer.
If the biomarker test cost the same as a CT scan (1 unit each), then the current standard-of-care (CT alone, using CMS eligibility criteria) would be on the efficiency frontier. In particular, it would be one of four strategies considered efficient; it would be more efficient relative to all remaining strategies. The three other efficient strategies (Strategies 1, 4, and 5) were projected to yield superior reductions in lung cancer–specific mortality, but at increased cost.
Leveraging the full spectrum of ROC curves generated, we further identified biomarker cost thresholds—for each point of each ROC curve generated—beyond which standard-of-care screening will always remain on the frontier (Figure 4). For example, the maximal cost threshold value for the base-case ROC curve (AUC = 0.95) is 0.86—this means that if the cost of the biomarker test exceeds 0.86× that of a CT scan, then the current standard-of-care screening strategy (CT alone, using CMS eligibility criteria) will remain efficient, despite the availability of a high-performing biomarker test.

Biomarker cost thresholds beyond which standard-of-care screening (CT alone) will remain efficient. Biomarker cost thresholds are provided as a function of specificity—for each point of each of five ROC curves—beyond which standard-of-care screening (CT alone) will always be considered efficient, even following the availability of high-performing biomarker tests. Distinct ROC curves are designated by their corresponding area-under-curve (AUC) values. We found that such cost thresholds initially increase with specificity and then decrease after reaching a maximum. CT = computed tomography; ROC = receiver operating characteristic curve.
Furthermore, we found that such cost thresholds consistently increase with specificity and then decrease after reaching a maximum (Figure 4). The explanation for this phenomenon is as follows. In one-way sensitivity analyses, when varying sensitivity and specificity of the biomarker test from 0 to 1, as expected, we found that across strategies lung cancer–specific mortality reduction improved with increasing sensitivity (Figure 5). Similarly, as expected, costs of screening increased with poorer specificity, due to increased false-positive biomarker results (Figure 5).

Sensitivity analysis: Effects of varied biomarker sensitivity and specificity on lung cancer mortality reduction and screening costs in combined biomarker + CT screening strategies. (A) Lung cancer mortality reduction, as expected, increases with increasing sensitivity of a biomarker test. (B) Total unit costs of screening per 100,000, as expected, increase with decreasing specificity, due to excess testing from false-positive biomarker results. CT = computed tomography; LC = lung cancer.
Therefore, with low biomarker specificity, and a consequent excess of CT referrals for false-positive biomarker test results, efficiency will decrease. However, very high specificity corresponds to relatively low sensitivity. Therefore, when specificity increases beyond a certain point (and, accordingly, when sensitivity decreases beyond a certain point), due to attenuated mortality reductions, efficiency will decrease. As such, a maximal cost threshold occurs between the two extreme values of specificity values for all biomarker test performance profiles, as illustrated in Figure 4.
Discussion
In this study, we projected health and economic outcomes associated with the use of multiple future, combined biomarker + CT lung cancer screening strategies in a US population. In so doing, we challenged the current standard-of-care in two principal ways: 1) we introduced a hypothetical biomarker test and 2) we extended screening to additional subpopulations of smokers, using biomarkers as a first-line test for smokers who would not otherwise be screened. We found that under conditions of high, but plausible, test performance for a successful biomarker, combined biomarker + CT strategies may contribute substantially to lung cancer mortality reduction. Such benefits were most pronounced when continuing CT screening for CMS-eligible smokers, but also offering a biomarker test to all CMS-ineligible smokers ≥45 but ≤77 years of age. Under our analysis assumptions, this strategy would have the potential to increase lung cancer mortality reduction in the United States from 8.3% to 23.9%. However, we additionally found that unless the cost of such a test is low—lower than that of a CT scan—current standard-of-care CT screening will remain economically efficient, when weighing mortality reductions and screening costs. Therefore, even if a high-performing biomarker for lung cancer screening becomes available, unless such a test can be introduced at a relatively low cost, it may not ultimately be economically viable.
We also found that, when considering US population benefits, the ability of such a test to detect specific lung cancer subtypes will matter. For example, we found that when biomarker screening was extended to the largest subpopulations of CMS-ineligible smokers (Strategies 5 and 7; see Table 2 and Figure 2), a biomarker test that was able to detect all NSCLC, including squamous cancers, would provide substantially greater mortality benefits relative to those that could not. This finding was driven by the relatively high proportion of squamous cancers that contribute to NSCLC (about 37% in men and 25% in women). 21 Since a primary benefit of combined biomarker + CT strategies, as modeled in this analysis, is their ability to reach additional subpopulations of smokers, if an important subtype is “missed” by the biomarker, then benefits of such combined strategies are necessarily attenuated.
The knowledge obtained by analyses such as ours, which address future implementation considerations for emerging technologies, is theoretical—and the question of its current relevance may be raised. Typically, model-based projections of potential benefits and costs associated with such technologies are initiated, at the earliest, after they are fully developed, tested, and ready to disseminate. However, we have demonstrated that meaningful insights can be gained concerning how such technologies may integrate into practice even earlier. This is because key factors that will inevitably constrain their success are already known, such as the cancer’s natural history, plausible target populations, and the performance and costs of current, accepted practices. In our study, by incorporating such constraints within a validated simulation model of lung cancer, we provide early projections of how such technologies will fare when implemented. Equally, we identify key factors—and relationships between such factors (e.g., specificity and cost efficiency)—that will be important for their success. Early knowledge of such factors can shape clinical trial designs and focus policy maker decisions prior to such technologies’ dissemination, providing greater assurance of their success and reach at the population level.
Our study has several limitations that warrant specific consideration. First, since biomarker discovery for early lung cancer detection is still in its infancy, the specific ROC curve(s) that will ultimately define their performance are unknown, as are the degrees to which they detect distinct cancer properties from CT (i.e., conditional independence). It should be emphasized that our study results are best used to anticipate drivers and barriers of future biomarkers’ viability rather than for definitive projections of population benefits. We felt that additional analyses incorporating conditional dependence may further complicate the interpretation of results, particularly given that the biomarker itself is hypothetical. Second, in the current analysis, we did not make comprehensive (lifetime horizon) projections of costs consequent to screening results. For simplicity, we restricted economic outcomes to short-term costs. In reality, the cost burden of false-positive results is even greater, due to unnecessary, further downstream testing and procedures. Incorporating such costs would decrease upper limits (thresholds) of biomarker costs that would be needed in order for biomarkers to be viable—as adjunct screening tests to CT—from an economic standpoint. However, had we incorporated the lung cancer treatment costs avoided subsequent to screening-detected cancers, biomarkers may have potentially been economically viable at higher cost thresholds. A comprehensive cost-effectiveness analysis is required to better understand the viability of biomarker screening in this context. Third, we evaluated a limited number of possible screening strategies. For simplicity, we focused on a restricted subset in which an adjunct biomarker test could be used to extend screening to subpopulations of smokers that otherwise would not be screened. However, additional paradigms could be tested, for example, involving more granular risk stratification algorithms. We felt that given the uncertainty surrounding biomarker test performance, this type of analysis would be beyond the scope of our study. However, we expect to expand our analysis accordingly in future studies. Finally, we assumed 100% screening adherence for those eligible in each strategy, which is not likely to be achievable in real-world circumstances. Our estimated values of lung cancer mortality reduction for different strategies therefore correspond to “best-case” scenarios of compliance. We also assumed no influence of screening on smoking behavior. This assumption may have increased or decreased projected mortality reductions, as lung cancer screening likely prompts some smokers to reflect on the negative health consequences of smoking, while others become less motivated to quit smoking following a cancer-free imaging test. 22
In conclusion, we found that future, combined biomarker + CT strategies have the potential to improve lung cancer screening effectiveness in the United States, but that corresponding biomarkers must be highly accurate—and low in cost—in order for such strategies to achieve economic efficiency that is greater than the current standard-of-care. One of the inherent challenges in modeling biomarker screening tests at this point in time is the lack of clinical evidence. The early stage of development and discovery of such biomarkers means that presently, even the few published studies in this field are limited to a single institution; moreover, techniques are not standardized. 8 By applying constraints that are known—and which will inevitably affect the success of future biomarker tests—and leveraging a population model of lung cancer to evaluate the benefits and costs of several hypothetical screening strategies, we gained new insights into factors that will drive the effectiveness and viability of emerging screening technologies. Moreover, the framework provided can be used to shape the course of such technologies prior to their dissemination, optimally ensuring their effectiveness and efficiency in future years.
Footnotes
This work was supported by Grants U01CA152956 and K25CA133141 from the National Cancer Institute, National Institutes of Health. PP receives research funding from the Medical Imaging and Technology Alliance, for unrelated research. All work was done at the Institute for Technology Assessment, Massachusetts General Hospital, Boston, Massachusetts. Financial support for this study was provided in part by two grants from the National Cancer Institute at the National Institutes of Health. The funding agreement ensured the authors’ independence in designing the study, interpreting the data, writing, and publishing the report.
References
Supplementary Material
Please find the following supplemental material available below.
For Open Access articles published under a Creative Commons License, all supplemental material carries the same license as the article it is associated with.
For non-Open Access articles published, all supplemental material carries a non-exclusive license, and permission requests for re-use of supplemental material or any part of supplemental material shall be sent directly to the copyright owner as specified in the copyright notice associated with the article.