
Abstract
Wealthy universities enjoy advantages in accessing resources, disproportionately benefiting high-income students who are overrepresented in these institutions. Using administrative data from 2017 to 2019, the author analyzes the relationship between resource inequality and student income segregation across universities in Brazil and Chile. Both countries have significantly expanded higher education through the entry of new private institutions while introducing large-scale equity policies. The findings show comparable levels of resource inequality in both countries but greater student segregation in Chile. As a result, high-income students in Chile attend universities with 1.7 times more resources than their lower income peers compared with 1.3 times in Brazil. The public sector exhibits larger resource disparities in both countries, which is closely connected to differences in research intensity. High-income students are concentrated at well-funded public institutions that conduct most of these countries’ research, while public universities serving lower income students are more likely to be underfunded. In contrast, research disparities play a more minor role in the private sector: private universities targeting high-income niches access more resources regardless of their research capacity. The concentration of resources in a few institutions that primarily enroll high-income students is likely to lessen the equity implications of increasing participation in higher education.
The effectively maintained inequality theory suggests that as enrolment in higher education expands to include lower socioeconomic status (SES) students, students sorting into institutions of unequal status becomes increasingly relevant in shaping socioeconomic inequalities (Lucas 2001). This student segregation is likely to reproduce the resource gaps between rich and poor students within higher education. Universities drawing affluent students tend to “accumulate prestige, cashed out as tuition revenues and further leveraged to raise public and private monies that buy high-cost faculty” (Marginson 2006:5), widening the resource gap between high- and low-status universities (Carpentier 2021; Czarnecki and Sauer 2024; Davies and Zarifa 2012). These processes reinforce each other over time, enhancing the advantages of these universities and students while reducing the resources available to institutions serving lower income students (Deming and Walters 2017; Hamilton and Nielsen 2021). Expanding access and reducing financial barriers may be insufficient to address inequity in higher education if resources remain concentrated in institutions that disproportionately enroll affluent students.
This study examines the link between resource stratification and socioeconomic segregation across universities in Brazil and Chile. Building on previous studies, I assess resource stratification by measuring inequality in per-student expenditures (Czarnecki and Sauer 2024; Davies and Zarifa 2012) and segregation by analyzing the distribution of students from different income backgrounds (Kuzmanic et al. 2022). I combine and expand these approaches by examining the extent to which universities serving more advantaged students have more resources and how these disparities connect to universities’ subject mix, study modes, locations, and research intensity. Unlike prior cross-country studies of the financial dimension of stratification (e.g., Czarnecki and Sauer 2024), in this study, I jointly analyze resource stratification and socioeconomic segregation. This enables me to further explore the socioeconomic gradient in university resources, providing valuable insights into the equity implications of different higher education funding models (Carpentier 2021; Hamilton and Nielsen 2021; Ingram 2023; Taylor and Cantwell 2019).
This study also expands international comparisons of stratification and segregation in higher education to two Latin American countries. Like many countries in the region, Brazil and Chile have high and persistent income inequality, with Gini coefficients of 0.53 in Brazil and 0.43 in Chile as of 2022 (World Bank n.d.), alongside strong intergenerational persistence at the top of the income distribution (Torche 2014). At the same time, educational mobility has increased among younger cohorts, driven primarily by the expansion of their higher education systems. In 2020, 34 percent and 55 percent of 18- to 24-year-olds were in higher education in Brazil and Chile, respectively (OECD 2022). In addition to the increasing competition for resources among public universities observed in most higher education systems, a second trend has taken place in these countries: the rapid growth of new private institutions relying on student fees since the 1990s. By 2010, more than 70 percent of higher education enrollment in Brazil and Chile was at private institutions, exceeding the Latin American average (49 percent) and far surpassing Europe (15 percent) and the United States (28 percent) (Ferreyra et al. 2017).
Despite shared trends in private sector growth, Brazil and Chile offer contrasting experiences of higher education expansion in Latin America. Most Chilean universities, both public and private, rely heavily on tuition fees and compete for students through a centralized admission system. In Brazil, public universities are tuition free, with a greater regulatory divide between the public and private sectors. Additionally, both have implemented distinct equity policies with varying implications for social segregation. These countries provide a unique opportunity to assess the stratification and segregation patterns of public and private universities across diverse institutional settings.
Background
Segregation and Resource Stratification in Higher Education
As participation in higher education expands, social stratification works not only vertically, by level of educational attainment, but also horizontally, through student segregation within these systems (Gerber and Cheung 2008; Reimer and Thomsen 2019). The effectively maintained inequality theory posits that, as participation in higher education increases, high-SES students leverage their advantages to secure “qualitatively better education,” disproportionately enrolling in more selective and prestigious institutions (Lucas 2001:11). As a result, institutions of varying prestige differ significantly in the socioeconomic composition of their student bodies (Boliver 2015; Croxford and Raffe 2015; Kuzmanic et al. 2022).
Student segregation often occurs alongside a resource inequality across institutions. Consistent with the Matthew effect, which predicts a self-reinforcing cycle between prestige and funding prospects, high-status universities accumulate advantages when competing for resources. In this context, cuts in public funding and intensified competition for students, staff, and private resources have usually deepened inequalities in university revenues, leading to a growing resource stratification over time (Carpentier 2021; Davies and Zarifa 2012; Ingram 2023; Marginson 2018). Inequity in higher education will depend on “the extent to which these forms of stratification reproduce each other,” as reflected, for example, in the overrepresentation of disadvantaged students in underfunded institutions (Marginson 2016:9).
Not all resource inequalities imply inequity. Differences in resources may stem from universities’ mission diversity, that is, their specialization in distinct types of education (e.g., fields of study, degrees, study modes), without implying a priori differences in quality (Carpentier 2021; Czarnecki and Sauer 2024). Higher education institutions with distinct missions serve “a diverse set of students and social needs and can deliver different types of education with varying cost structures” (Eckel 2008:177). For example, regional universities in lower income areas might specialize in lower cost courses and study modes.
However, evidence from 21 European countries suggests that resource disparities are more pronounced across universities with similar missions, primarily driven by differences in research intensity and access to competitive funding (Czarnecki and Sauer 2024). Resource stratification tends to align with the divide between a small group of elite, research-intensive institutions and a broader set of demand-absorbing universities with more limited research capacity (Cantwell and Marginson 2018). High-income students are more likely to gain access to research-intensive institutions, which tend to offer better funded environments and employ more qualified faculty members, reflecting “the joint contests between families for social advantage and between institutions for social prestige” (Cantwell and Marginson 2018:129).
Although most of this literature has focused on long established systems in North America and Europe, the proliferation of new private institutions has transformed the higher education landscape in many countries of the Global South, especially in Latin America (Levy 2018). The extent to which the expansion of higher education through increased private provision has mirrored the stratification and segregation patterns of the more traditional sectors needs further exploration. This represents one of the main purposes of this study.
The Rise of Private Universities in Latin America
By the mid-twentieth century, higher education in Latin America remained an elite system, with very limited access, and consisted mainly of public institutions and a few Catholic universities (Bernasconi 2008). Most universities in the region focused on professional training, and only a few developed significant research capacity (Balán 2012; Schwartzman 2020). Although universities generally enjoyed high levels of institutional autonomy, funding relied largely on public subsidies, usually allocated through historical budgets, with some variation in the role of tuition across countries.
In the 1980s and 1990s, higher education reforms introduced new regulatory frameworks, quality assurance mechanisms, and funding arrangements inspired by New Public Management across many of these countries (Bernasconi and Celis 2017). These reforms increased competition for students and resources and, in many cases, enabled the entry of new private institutions. As a result, higher education enrollment expanded rapidly, driven largely by the growth of the private sector (Ferreyra et al. 2017). By 2010, nearly half of higher education enrollment in Latin America was concentrated at private institutions (Levy 2018).
Most private institutions in the region emerged as demand-absorbing providers offering low-cost programs with limited research capacity and typically enrolling students from more disadvantaged socioeconomic backgrounds (Ferreyra et al. 2017; Schwartzman 2020). Yet an elite segment of private universities also emerged within this sector, which tend to be more selective in admissions and charge higher tuition fees. These elite private institutions have taken an increasing role in the social and cultural formation of high-income students, often functioning as closed spaces of socialization and network formation (Almeida 2015; Villalobos Dintrans, Quaresma, and Franetovic 2020).
Unlike the traditional public sector, the unequal distribution of resources in the private sector may be less associated with a research-driven differentiation and more directly tied to the socioeconomic composition of the student body (Villalobos et al. 2025). Higher resource private universities target affluent students by leveraging their higher tuition fees and increasingly investing in nonacademic factors such as student services, sports, and campus leisure (Alter and Reback 2014; Buckner and Gong 2022; Jacob, McCall, and Strange 2018). In such contexts, the link between revenues, costs, and research output might be less clear than in the public sector.
This study expands previous studies on resource stratification across universities in Europe and North America (Czarnecki and Sauer 2024; Davies and Zarifa 2012) by exploring the divergent patterns of resource stratification and socioeconomic segregation across public and private universities in Brazil and Chile. The study provides new comparative evidence on the resource gap of universities with different socioeconomic compositions, contributing to our understanding of the equity implications of resource stratification across different institutional settings.
The Cases of Brazil and Chile
Brazil
Since the end of the 1980s, the Brazilian state has expanded social spending and public provision in key sectors such as health care and education on the basis of an institutionally mixed model (de Dios 2019). This system has aimed, for example, to guarantee free and universal access to public health care and tuition-free public education, while often maintaining a large private sector alongside them. This dual structure has been particularly pronounced in higher education, where public institutions coexist with a large and expanding private sector.
Various types of institutions offer bachelor’s degrees in Brazil, including centers focusing on one discipline (12 percent of undergraduate enrollment), multidisciplinary schools (32 percent), and universities (56 percent). Universities must engage in research, at least one third of their faculty members must hold postgraduate degrees, and one third must have full-time contracts. The two leftmost columns of Table 1 show key characteristics of public and private universities in Brazil.
Characteristics of Public and Private Universities across Countries.
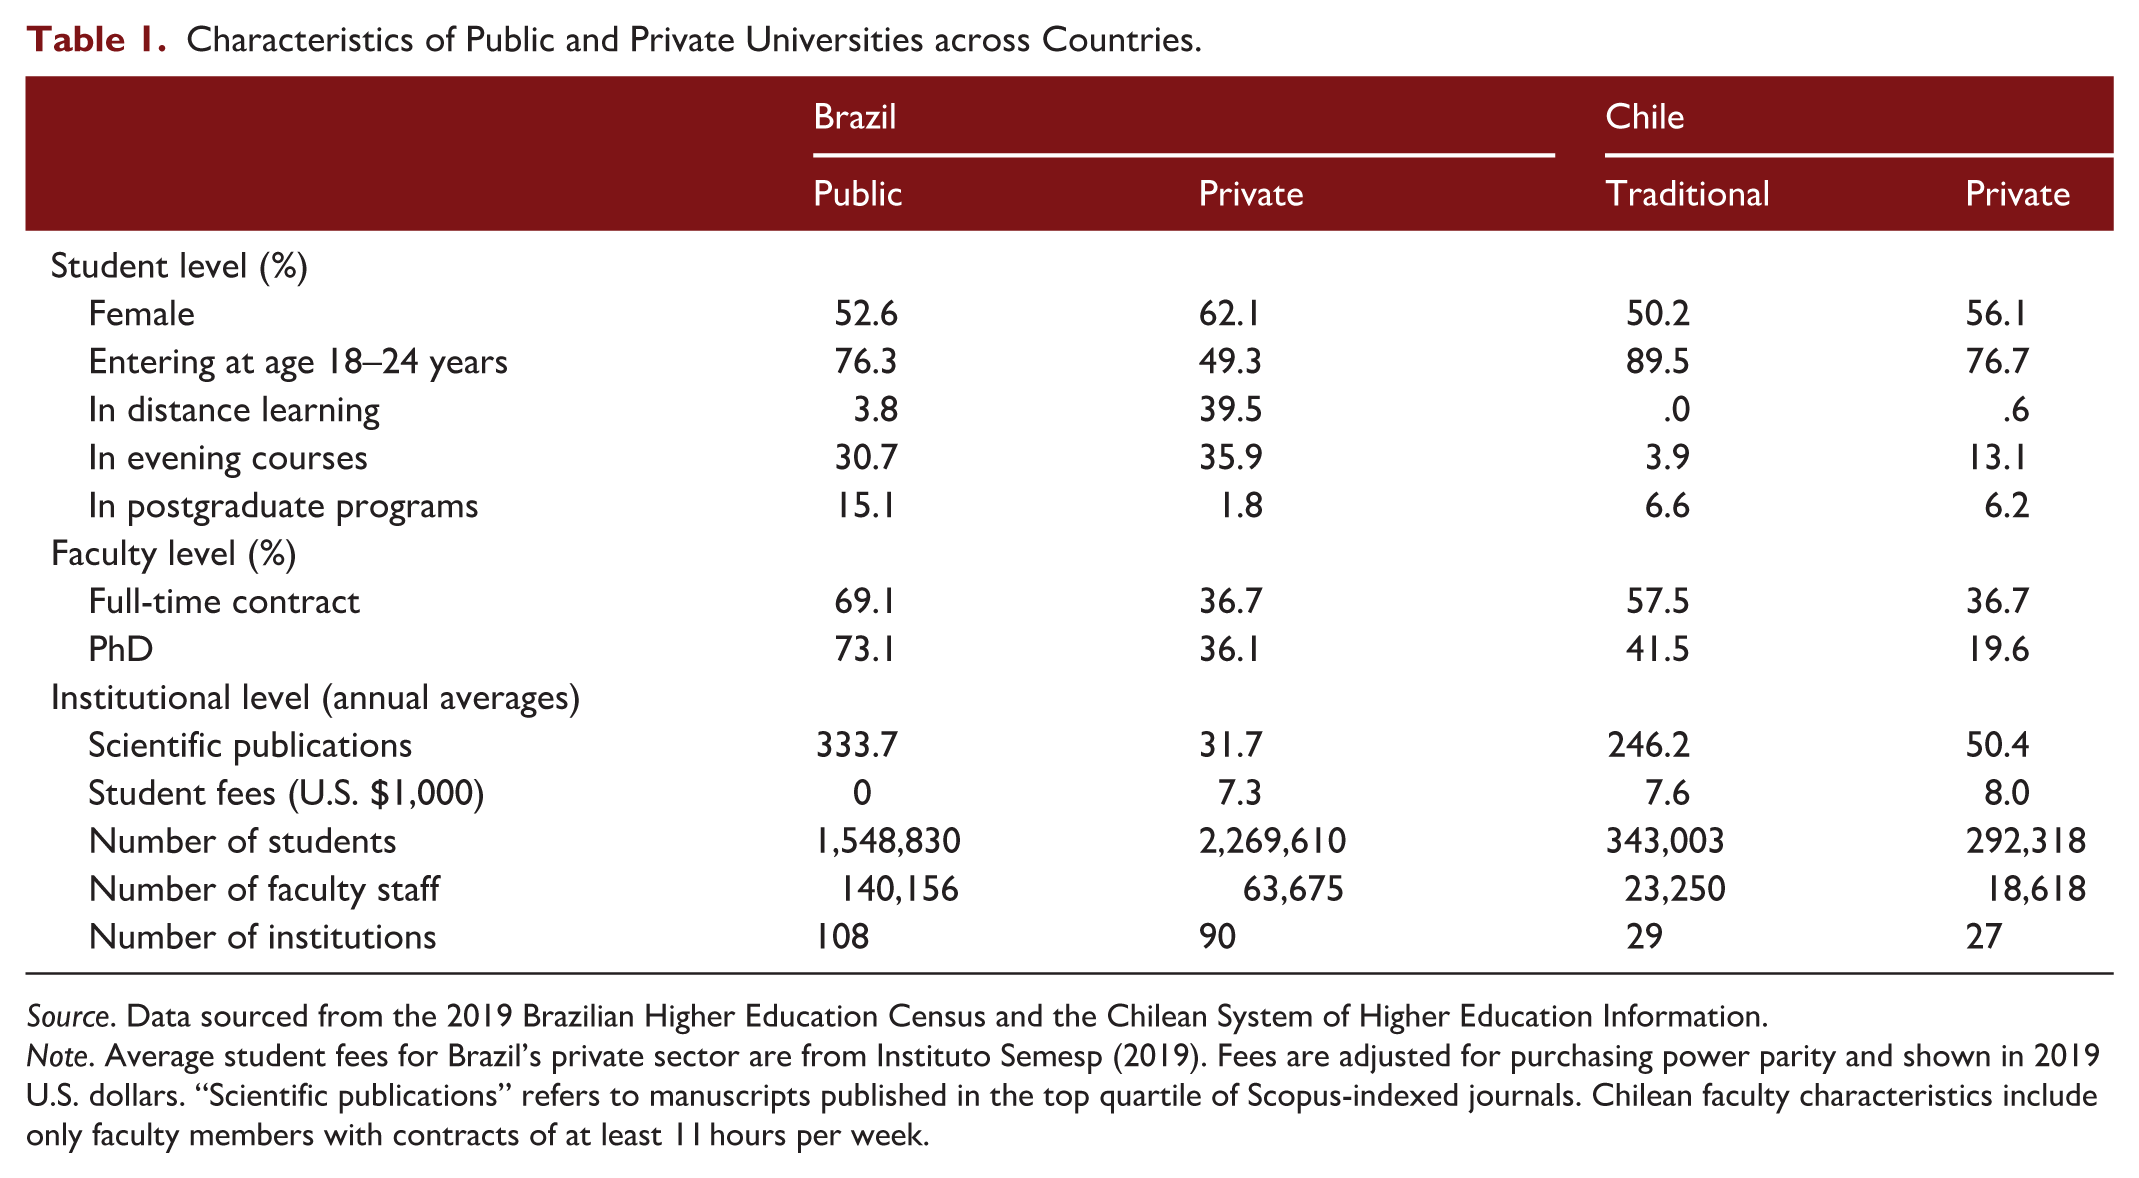
Source. Data sourced from the 2019 Brazilian Higher Education Census and the Chilean System of Higher Education Information.
Note. Average student fees for Brazil’s private sector are from Instituto Semesp (2019). Fees are adjusted for purchasing power parity and shown in 2019 U.S. dollars. “Scientific publications” refers to manuscripts published in the top quartile of Scopus-indexed journals. Chilean faculty characteristics include only faculty members with contracts of at least 11 hours per week.
Public universities (108 institutions in 2019) account for about 40 percent of university enrollment. These institutions are run by the federal government (64 percent of public enrollment in 2019) or one of the 27 state governments (32 percent of public enrollment), with a small portion administered by local municipalities (about 4 percent of public enrollment). All public universities are tuition free and dependent largely on government transfers. Federal universities are primarily funded by the Ministry of Education, while state universities rely on state-level budget arrangements, which vary significantly across states. Since the 1990s, federal resource allocation has increasingly adopted performance-based criteria, combining historical spending patterns with performance indicators such as enrollment, graduation rates, faculty composition, infrastructure, research output, and program quality ratings (Reis et al. 2017). It also includes incentives for evening programs and for students residing outside the university’s main locality. In this context, universities with stronger research profiles and postgraduate programs have been more likely to secure funding. Figure A1 in the Supplementary Material illustrates the distribution of research production across public universities in Brazil.
Student admission to public universities is determined by a unified selection system based on scores from the competitive National Exam of Upper Secondary Education (ENEM). On average, public universities are more academically selective than private universities, drawing larger numbers of better prepared students (Carvalhaes, Senkevics, and Costa Ribeiro 2023). The country’s most selective public universities rank among the top in Latin America, leading the region’s graduate education and research (Balbachevsky and Sampaio 2017).
By 2022, 90 private institutions were recognized as universities, making up 45 percent of all universities. Unlike public universities, private institutions do not rely on public funds, charge tuition fees, and establish their own decentralized admission processes (some use students’ ENEM scores; others have their own entrance exams). As shown in Table 1, these private universities disproportionally serve students aged 25 and older and women, with a greater focus on evening courses and distance learning.
Private universities tend to have a more limited research orientation, employing a lower percentage of full-time faculty member, and having a smaller proportion of staff members with PhD degrees (see Figure A1 in the Supplementary Material). Moreover, private universities in Brazil concentrate heavily on high-demand fields such as business, administration, and law (Balbachevsky and Sampaio 2017). Public universities tend to offer broader coverage, with some specializing in more research-intensive fields such as engineering and natural sciences (Figure A2 illustrates the distribution of fields of study across universities).
These developments led to high socioeconomic inequities in access, as high-SES students can better afford fees and are more prepared for the highly competitive entrance exams to public universities (Balbachevsky, Sampaio, and Yahn de Andrade 2019). Racial disparities have remained particularly pronounced, with black, brown, and indigenous students frequently performing below average and being significantly less likely to transition into higher education (Carvalhaes et al. 2023). To address these inequalities, a subsidized loan system and corporate tax exemptions in exchange for free tuition for low-income students have been in place in the private sector since the early 2000s. In the public sector, a law enacted in 2012 mandates that 50 percent of federal university students must come from public schools (usually from low-income backgrounds), and they must mirror the state’s racial composition. Also implemented by state-run universities, this policy has changed the profile of students entering the public sector (McCowan 2016).
Chile
Neoliberal reforms to Chile’s welfare system during the military dictatorship of Augusto Pinochet (1973–1990) introduced a market-oriented model with a strong role for private providers in health care, social security, and education. These reforms encouraged the creation of private institutions, promoted competition between providers, and increased private spending. Since the return to democracy in 1990, governments have expanded social spending and introduced targeted policies to improve quality and equity in access to social services (de Dios 2019). Yet the system continued to rely heavily on private provision and market competition, particularly in higher education, where many new private institutions entered the sector after 1990.
Currently, the Chilean higher education system includes three types of institutions: training centers offering two-year degrees (11 percent of enrollment), professional schools offering two- to four-year degrees (33 percent), and universities (56 percent). Universities are the only ones that award bachelor’s degrees and engage in research. The two rightmost columns in Table 1 describe universities in Chile.
Before the massive entry of new private institutions in the early 1990s, there were 25 universities: 16 state universities and nine traditional private universities. Given their shared “public function,” funding mechanisms, and history, traditional private universities have advocated for positioning themselves as “nonstate public universities” within the public sector (Guzmán-Valenzuela and Barnett 2024). Following this stand, this study groups these 25 institutions under the term traditional universities. These institutions are responsible for a significant portion of the country’s scientific research, especially the two most prestigious ones: Universidad de Chile and Pontificia Universidad Católica de Chile (see Table 1 and Figure A1 in the Supplementary Material). Traditional universities usually cover a wide range of fields, including high-cost degrees in engineering and natural sciences (see Figure A2 in the Supplementary Material).
Unlike public universities in Brazil, all traditional universities (state and traditional private) rely on tuition fees and receive public funding. Public transfers include competitive and performance-based funds, as well as core funding based on historical spending patterns. Yet public transfers represent about 25 percent of revenues in the median traditional university, while tuition fees contribute 60 percent; most of the rest comes from income-generating activities unrelated to teaching. Table A1 in the Supplementary Material shows the distribution of universities’ revenue sources in Chile, and Figure A3 displays the distribution of revenue sources within each university sector.
New private universities in Chile (27 institutions) do not receive public funding and depend mostly on fees. The Chilean system shows more similarities between traditional and new private universities, with all heavily relying on private resources and mainly developing in-person and day courses (see Table 1). Although traditional universities are more research-intensive, these differences are not as pronounced as in Brazil (see Figure A1 in the Supplementary Material). Moreover, the student admission system operates through an integrated national platform that includes the most selective universities, both traditional and new. Currently, 45 of 55 universities participate in this system, which admits applicants on the basis of three academic factors: a standardized university entrance exam, high school average grades, and their ranking within their high schools.
Chile has introduced several policies to improve equity in the system, including a government-backed student loan scheme launched in 2006. One of the most significant reforms in the past decade was the implementation of a free tuition policy in 2016. Under this policy, the Chilean government pays universities a regulated fee on behalf of students from the bottom 60 percent of the income distribution. Although all traditional universities (state and traditional private) participate in this policy, some new private universities, particularly the most expensive ones, have opted out. Evidence suggests that the equity policies applied in recent decades have had an impact, although moderate, on reducing students’ socioeconomic segregation in this system (Kuzmanic et al. 2022).
Research Questions
Brazil and Chile provide a valuable opportunity to examine the differential patterns of resource stratification and social segregation between the public/traditional and the expanding private sectors. The first three research questions of this study are as follows:
How is the inequality of financial resources across public/traditional and private universities in Brazil and Chile?
How segregated are students by SES across these universities?
How do financial resources vary across universities with different student socioeconomic compositions within each sector?
This study further explores whether the linkage between student socioeconomic composition and university resources reflects mission diversity or whether it is related primarily to research intensity, examining how these patterns vary between the public/traditional and private sectors. In Brazil and Chile, mission diversity among universities is greatly reflected in the variety of subject mixes, study modes, and locations, which cater to different needs and educational demands without necessarily reflecting stratification. Hence, the fourth research question is as follows:
4. To what extent are differences in financial resources among universities serving different socioeconomic groups associated with mission diversity (subject mix, study modes, and location) and research intensity within each sector?
Data and Method
Data
Brazil
The Brazilian Higher Education Census provides information on universities’ courses, revenues, and expenditures, which are submitted annually by university authorities. Expenditures are disaggregated into two components: salaries and other operating costs. Salaries include monetary payments to faculty and administrative staff members, while other operating costs include items like basic services and infrastructure. Table A2 in the Supplementary Material shows the distribution of these expenditure components across universities. All monetary values are adjusted for purchasing power parity (PPP) and expressed in 2019 U.S. dollars.
I combine these data with that of the National Exam of Student Performance (ENADE). The ENADE questionnaire collects data on the gross monthly income of the families of final-year students in Brazilian higher education, which students report by selecting from seven income ranges. ENADE assesses different discipline groups each year, covering most disciplines on a three-year cycle. Because income information is observed at the discipline level, I aggregate it to the university level by computing a weighted average across disciplines, using each discipline’s total student enrollment as weights. For the analysis, I consider the average expenditures of universities over the 2017–2019 ENADE cycle.
Twenty-one universities did not provide financial statements in 2017–2019 but had data from earlier years. I impute their expenditure for 2017–2019 using the method proposed by Lipps and Kuhn (2023) for longitudinal data. I predict universities’ expenditures in 2011–2013, 2014–2016, and 2017–2019 on the basis of a linear regression model using yearly data on enrollment (size and distribution across study modes and fields of study) and faculty (size, qualifications, contract types, gender, and age). The imputed values result from multiplying the university’s observed average expenditure in 2011–2016 by the period-specific deviation represented by the ratio between the predicted value for 2017–2019 and the average prediction across the three periods.
To assess the quality of the imputation, I conduct validation exercises using the subsample of universities with complete financial information (n = 127). I randomly assign missing values to 20 universities in this subsample and apply the same imputation procedure used in the main analysis. I repeated this simulation 500 times. Figure A4 in the Supplementary Material shows the distribution of the correlation between observed and imputed expenditures across iterations. The imputed values closely track the observed data, with an average correlation of 0.86. Most importantly for this study, the overall inequality of university resources remains virtually unchanged after imputation. As shown in Figure A5 in the Supplementary Material, the average Gini index of per-student expenditure across simulations mirrors that obtained using the observed data, with little variation across iterations (SD = 0.007).
After excluding 38 universities without any financial information, the final sample includes 148 Brazilian universities, which closely reflect the overall characteristics of Brazilian universities (see Table A3 in the Supplementary Material). The exclusion of 38 institutions may introduce selection bias. To mitigate this concern, I apply the inverse probability weighting method throughout the analysis. This method estimates the probability of a university being included in the final sample on the basis of observable characteristics (type of administration, size, student distribution across study modes, and geographic location). By weighting observations according to the inverse of these probabilities, inverse probability weighting helps reduce potential selection bias related to these observable factors. Because the 186 institutions have information on their socioeconomic composition, I further verify that the measures of socioeconomic segregation are similar between the broader population of universities and the final sample.
Chile
The Chilean System of Higher Education Information provides annual data on all universities’ courses, including audited financial statements of all higher education institutions. See Table A2 in the Supplementary Material for the distribution of salaries and other operating costs across Chilean universities. As with the Brazilian data, I consider the average expenditure between 2017 and 2019, adjusted for PPP and expressed in 2019 US dollars.
The students’ household income data come from the Department of Educational Assessment, Measurement, and Records, which administered the Chilean university entrance exam until 2019. To register for this exam, students must complete a socioeconomic questionnaire, which collects information on their families’ monthly income through a categorical variable with 12 income ranges. To ensure comparability with the Brazilian data, I focus on students graduating from higher education in 2019 and trace their information back to when they took the university entrance exam between 2009 and 2015. This procedure provides income information for 75 percent of final-year students in 2019.
After excluding two state universities that began operating in 2017 and two private universities without graduates in 2019, the final sample includes 52 Chilean universities. Although these data represent the majority of universities in the country, the sample size remains limited, which may affect the precision and stability of certain analyses. This limitation should be considered when interpreting the results, particularly in relation to sector-specific dynamics in this country.
Analysis
Stratification
The analysis focuses on expenditure per student. I first use Lorenz curves, which plot the cumulative proportion of resources against the cumulative proportion of institutions, forming a 45° line when all universities have equal resources (line of perfect equality). The farther the Lorenz curve is from the line of perfect equality, the more pronounced the financial stratification. Additionally, I use the Gini index, which represents the area between the line of perfect equality and the observed Lorenz curve relative to the area that would result if one university held all the resources (maximum inequality). This index provides an intuitive measure of inequality and has been computed for other higher education systems, allowing further cross-country comparisons (Czarnecki and Sauer 2024; Davies and Zarifa 2012). I complement the Gini index with the Theil index, which can be decomposed into inequality between sectors and within sectors. This last index allows me to quantify how much of total inequality is due to differences between public/traditional and private universities, rather than variation within each sector.
Socioeconomic Segregation
I use family income to measure last-year students’ socioeconomic backgrounds. However, Brazilian data include seven income categories, whereas Chilean data include 12 (Table A4 in the Supplementary Material details these categories and their distributions). To ensure comparability, I define three groups with similar thresholds and distributions across countries. Adjusted for PPP, high-income students are those whose family income is at least U.S. $2,627 in Brazil (top 23 percent of the sample’s income distribution) and U.S. $2,535 in Chile (top 21 percent). Because the lowest income ranges overlap less between countries, the primary analysis considers the low-income group to include students with less than U.S. $1,314 in Brazil (bottom 45 percent) and less than U.S. $1,086 in Chile (bottom 49 percent). Alternatively, I define the low-income group as those with less than U.S. $657 in Brazil (bottom 20 percent) and less than U.S. $724 in Chile (bottom 30 percent). Middle-income students fall between these two categories.
Income groups offer the advantage of being relatively comparable across countries. However, in Chile, students report family income at university entry, whereas in Brazil, they report it in their final years. Because family income may change during students’ time in higher education, this timing difference may affect cross-national comparability. To partially address this, I complement the analysis by examining segregation based on mothers’ education as reported by students on the respective questionnaires, which is more likely to be time invariant. I define three educational groups on the basis of their mothers’ education: primary education (36 percent in Brazil and 12 percent in Chile), secondary education (33 percent in Brazil and 48 percent in Chile), and higher education (29 percent in Brazil and 40 percent in Chile). Although not perfectly aligned, these groups are still strongly associated with income. Table A5 in the Supplementary Material (available only for Chile, as ENADE does not allow matching both variables in Brazil) shows that 83 percent of high-income students have mothers with higher education, compared with 19 percent among low-income students.
I use segregation plots to visualize socioeconomic segregation (Elbers and Gruijters 2024). These plots illustrate the socioeconomic composition of each university considering multiple groups, allowing me to jointly explore the segregation of low-, middle-, and high-income students. I support this analysis by measuring the dissimilarity index, which indicates the percentage of students who would need to switch universities to achieve perfect integration.
Socioeconomic Composition and Per-Student Expenditure
I use scatter plots to illustrate how variations in per-student expenditures correspond to differences in the percentage of high-income students across universities (third research question). To quantify this relationship, I estimate the following model:

where
I use this model to examine how
For universities’ research intensity, I use the number of publications in the top quartile of the Scopus-indexed journals from 2015 to 2019 and the proportion of total students enrolled in PhD programs. Both variables are included as second-degree polynomials to allow for nonlinear relationships, as differences in research intensity are likely to be more pronounced at the upper end of the distribution, where more research-intensive universities stand out from the rest. Table A8 in the Supplementary Material displays the distribution of these covariates.
This last analysis descriptively examines the extent to which resource inequality between universities with different socioeconomic compositions is associated with differences in research intensity. Because total expenditure per student includes research spending, adding research intensity as a control raises concerns about mechanical overlap. To partially address this, I complement the main specification with measures of research intensity from an earlier period (2012–2016), before the expenditure window used in the analysis (2017–2019), reducing the scope for contemporaneous mechanical relationships.
Even so, including research intensity likely amounts to overcontrolling. Research disparities are both a cause and a consequence of resource disparities, both of which are also likely to be persistent over time. Still, by controlling for research intensity, this analysis enables me to examine the extent to which socioeconomic disparities in access to resources are linked to differences in universities’ research intensity, and, crucially, whether this relationship operates differently across public/traditional and private sectors.
Results
Resource Stratification
Figure 1 displays the Lorenz curves of per-student expenditures. Brazil and Chile exhibit similar levels of inequality between top-tier universities and the rest: the top 10 percent of institutions (15 universities in Brazil and 5 in Chile) account for 25 percent of expenditures. However, Brazil shows a moderately steeper division between low- and middle-tier universities, with the bottom 40 percent of universities accounting for 20 percent of total per-student expenditures, compared to 25 percent in Chile.
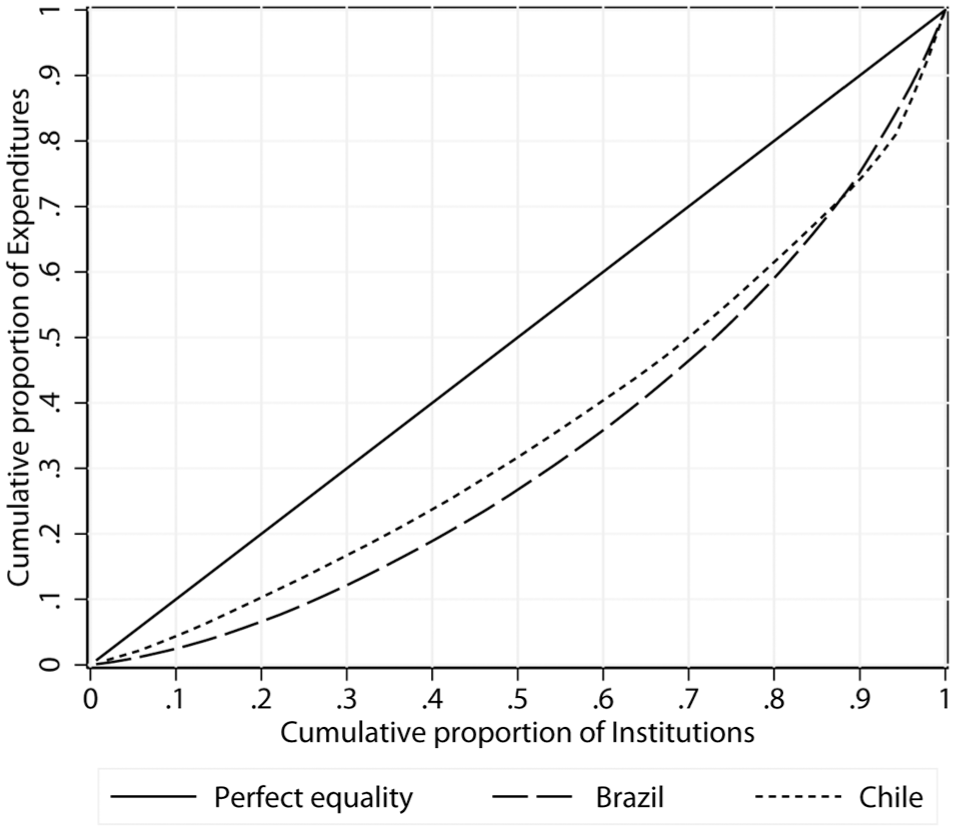
Lorenz curves of per-student expenditure.
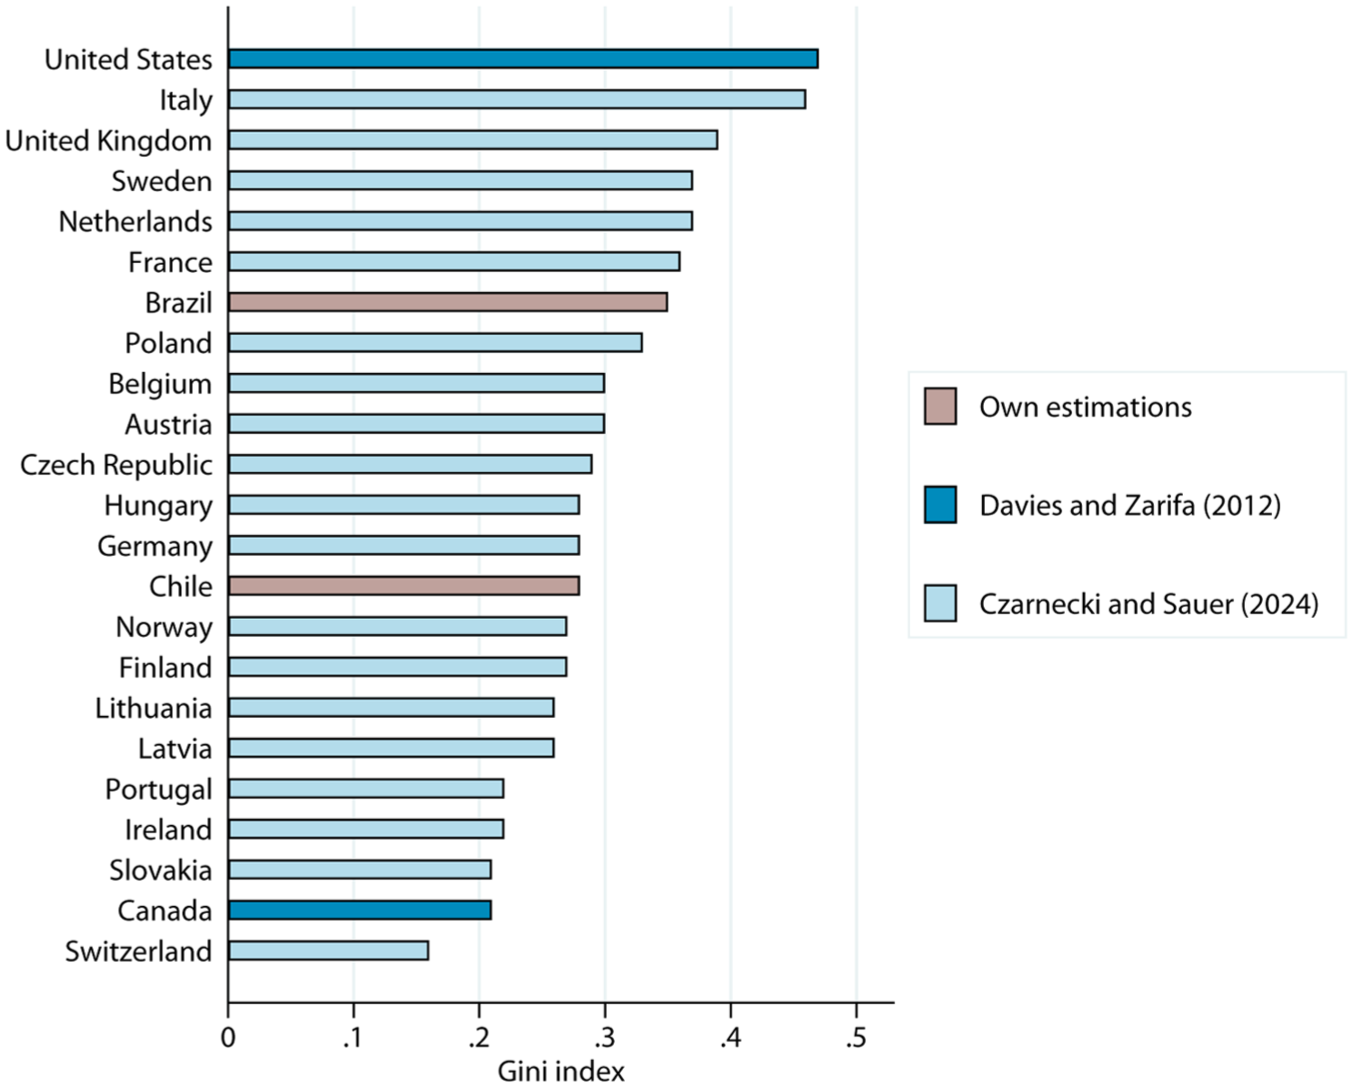
The Gini index is equal to 0.35 for Brazil and 0.28 for Chile. Figure 2 compares these values with Gini indices from Davies and Zarifa (2012) for the United States and Canada and from Czarnecki and Sauer (2024) for 21 European countries. These authors also focused on per-student resources in institutions offering bachelor’s degrees. Results for the United States and Canada consider universities’ expenditures in 1996 and 2006, respectively, while those for Europe use the average revenue in 2013–2017. For this last study, I consider their results for institutions that engage with research (see Table 2 in Czarnecki and Sauer 2024:15). Brazil is in the top third of this 23-country sample; Chile falls in the bottom half. Both countries’ indices are below those in the United Kingdom (0.39), Sweden (0.37), the Netherlands (0.37), and France (0.36), and are notably lower than those in Italy (0.46) and the United States (0.47). Despite Chile and Brazil having higher income inequality, they show more moderate inequality between universities in international comparison.
Comparison of the Gini index of per-student resources with previous studies.
Figure 3 shows the values of the Gini index within each sector (public/traditional and private) for both systems (Figure A6 in the Supplementary Material further shows the Lorenz curves for each sector). Despite the higher financial stratification in Brazil, within-sector disparities are similar across countries, with Gini indices ranging from 0.25 to 0.28. This suggests that differences in stratification levels between these countries stem from Brazil’s more pronounced public-private divide. This last result is supported when using the Theil index, which can be decomposed into inequality between sectors and within sectors. Based on this index, Table A9 in the Supplementary Material shows that 44 percent of per-student expenditure inequality in Brazil occurs between the public and private sectors, compared with 11 percent in Chile.

Gini index of inequality of per-student expenditure by sector.
Figure A7 in the Supplementary Material shows the Lorenz curves separately for federal and state public universities in Brazil and for state and traditional private universities in Chile. Federal universities in Brazil and state universities in Chile (Gini indices of 0.22) show lower inequality than the other subcategory (Gini indices of 0.29 and 0.31) within each sector.
Socioeconomic Segregation
In this section, I assess the socioeconomic segregation of students in their final year of higher education. Figure 4 examines the uneven socioeconomic distributions of universities using segregation plots (Elbers and Gruijters 2024). Universities with similar socioeconomic composition are grouped within “bins” without losing relevant information. Each bar represents the socioeconomic distribution of one bin, and the width of the bar is proportional to the bin’s enrollment size. Bars are ordered according to their percentage of high-income students and the rightmost bar, slightly separated from the rest, depicts the overall distribution of income groups.
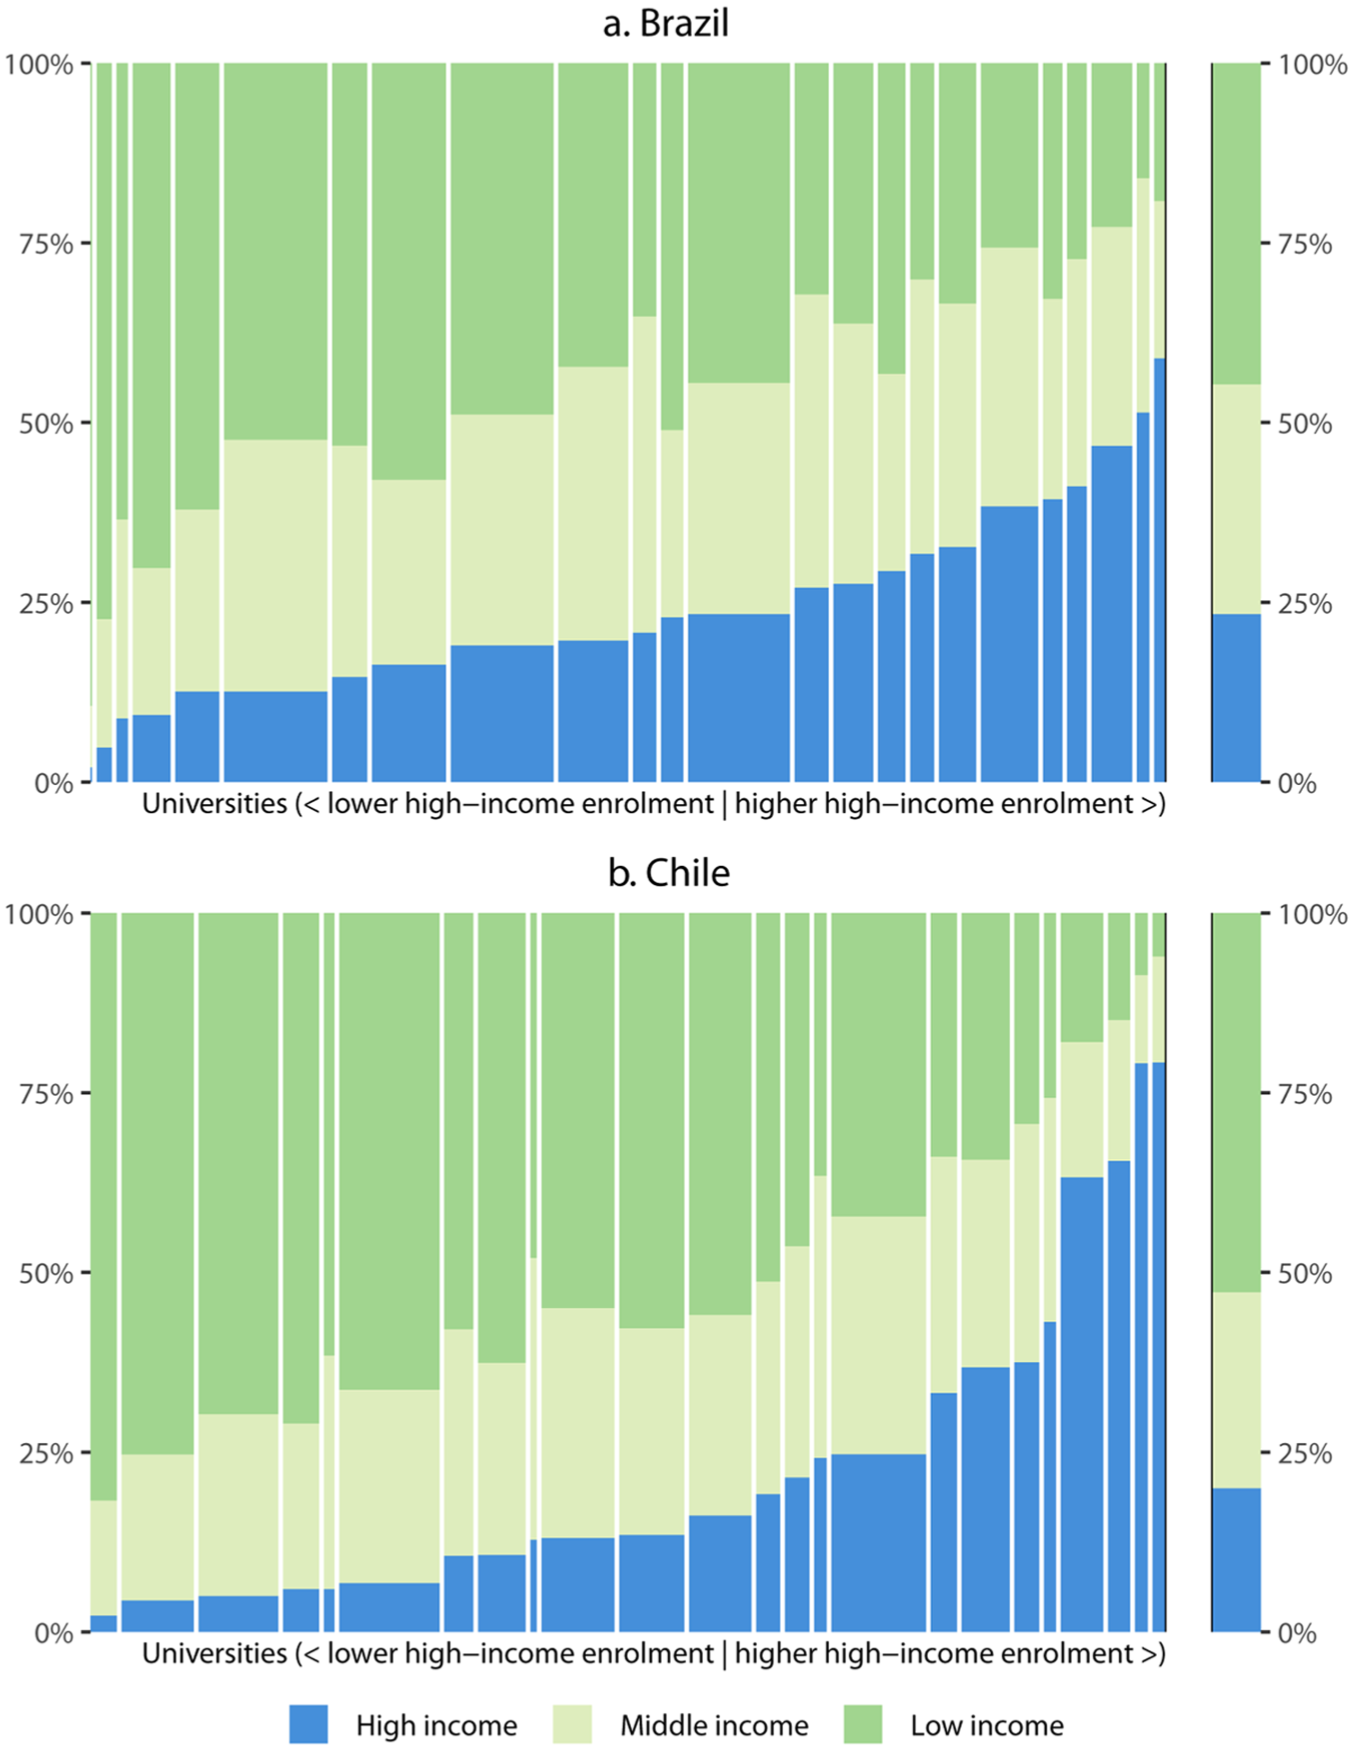
Segregation plots for visualizing socioeconomic segregation: (a) Brazil and (b) Chile.
High-income students represent about 5 percent of the enrollment in the universities on the leftmost side, which increases as we move to the right. This increase is more pronounced in Chile. While high-income students constitute about 60 percent of enrollment at the most segregated universities in Brazil, these students represent about 80 percent at the most segregated universities in Chile. Because the proportion of middle-income students varies less across universities, higher shares of high-income students come mainly from lower shares of low-income students. This result holds to a large extent when redefining the low-income group as those with less than U.S. $657 in Brazil (bottom 20 percent) and less than U.S. $724 in Chile (bottom 30 percent) (see Figure A8 in the Supplementary Material).
Figure A9 in the Supplementary Material replicates this analysis for the public/traditional and private sectors separately (Figure A10 further explores differences between the different types of public/traditional universities in each country). Each income group is equally represented across sectors, indicating that all segregation occurs within, rather than between, these sectors. In both countries, the more segregated universities are private, with a small number of institutions primarily catering to high-income students. This segregation of high-income students in the private sector is more pronounced in Chile.
As shown in Figure 5, the dissimilarity index is 0.42 for Chile, meaning that 42 percent of high-income students would need to change their universities to achieve an even distribution. Private universities in Chile show a higher dissimilarity index (0.46) than traditional ones (0.38), and among the latter, traditional private universities are more segregated (0.42) than state universities (0.34). In Brazil, the dissimilarity index is 0.25, which is similar across public and private universities (about 0.24–0.26). Within the Brazilian public sector, federal universities (0.23) are less socially segregated than state universities (0.32). These results are virtually unchanged when considering all universities in Brazil, rather than only those with financial information (see Table A10 in the Supplementary Material).
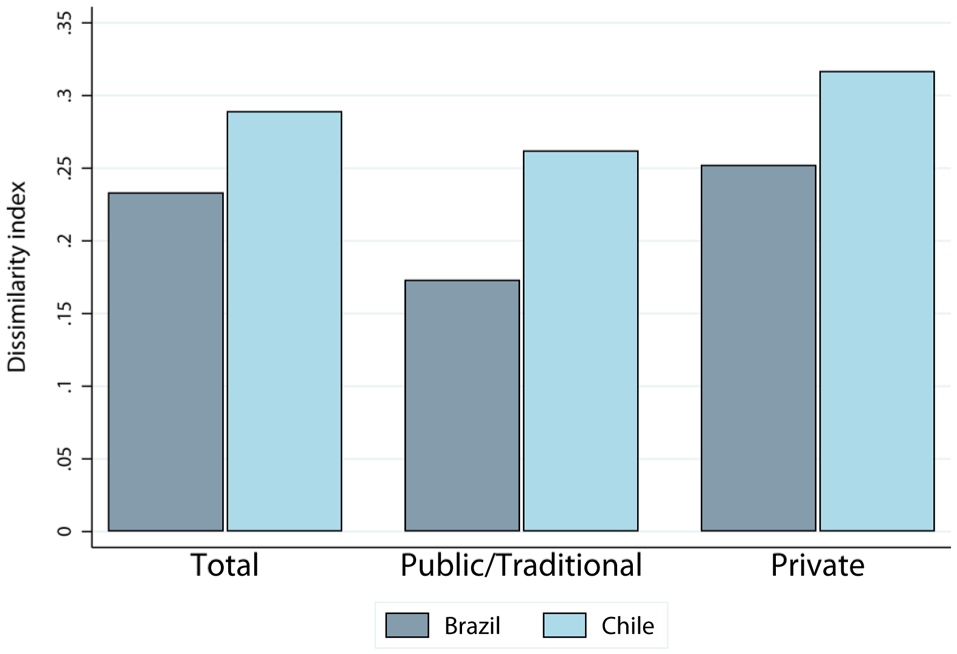
Dissimilarity index of segregation for high-income students.
Although segregation levels are lower when measured using mothers’ education, the overall pattern remains: universities in Brazil are less socially segregated than those in Chile (Figure A11 in the Supplementary Material displays segregation plots on the basis of mothers’ education). In Chile, the dissimilarity index for students with highly educated mothers is 0.29 overall, 0.26 within the traditional sector, and 0.32 in the private sector. In Brazil, these values are 0.23, 0.17, and 0.25, respectively (Table A11 in the Supplementary Material).
Socioeconomic Disparities in University Resources
Figure 6 presents scatterplots showing the relationship between per-student expenditure and the share of students from high-income families, with universities grouped into bins of similar values. The top-tier public and traditional universities stand out with significantly higher per-student expenditures, which also enroll a disproportionately high share of high-income students. In both countries, public/traditional universities at which more than 40 percent of students come from high-income families spend, on average, about four times more per student than institutions where only 10 percent of students are from such backgrounds. This gap is half as large in the private sector.
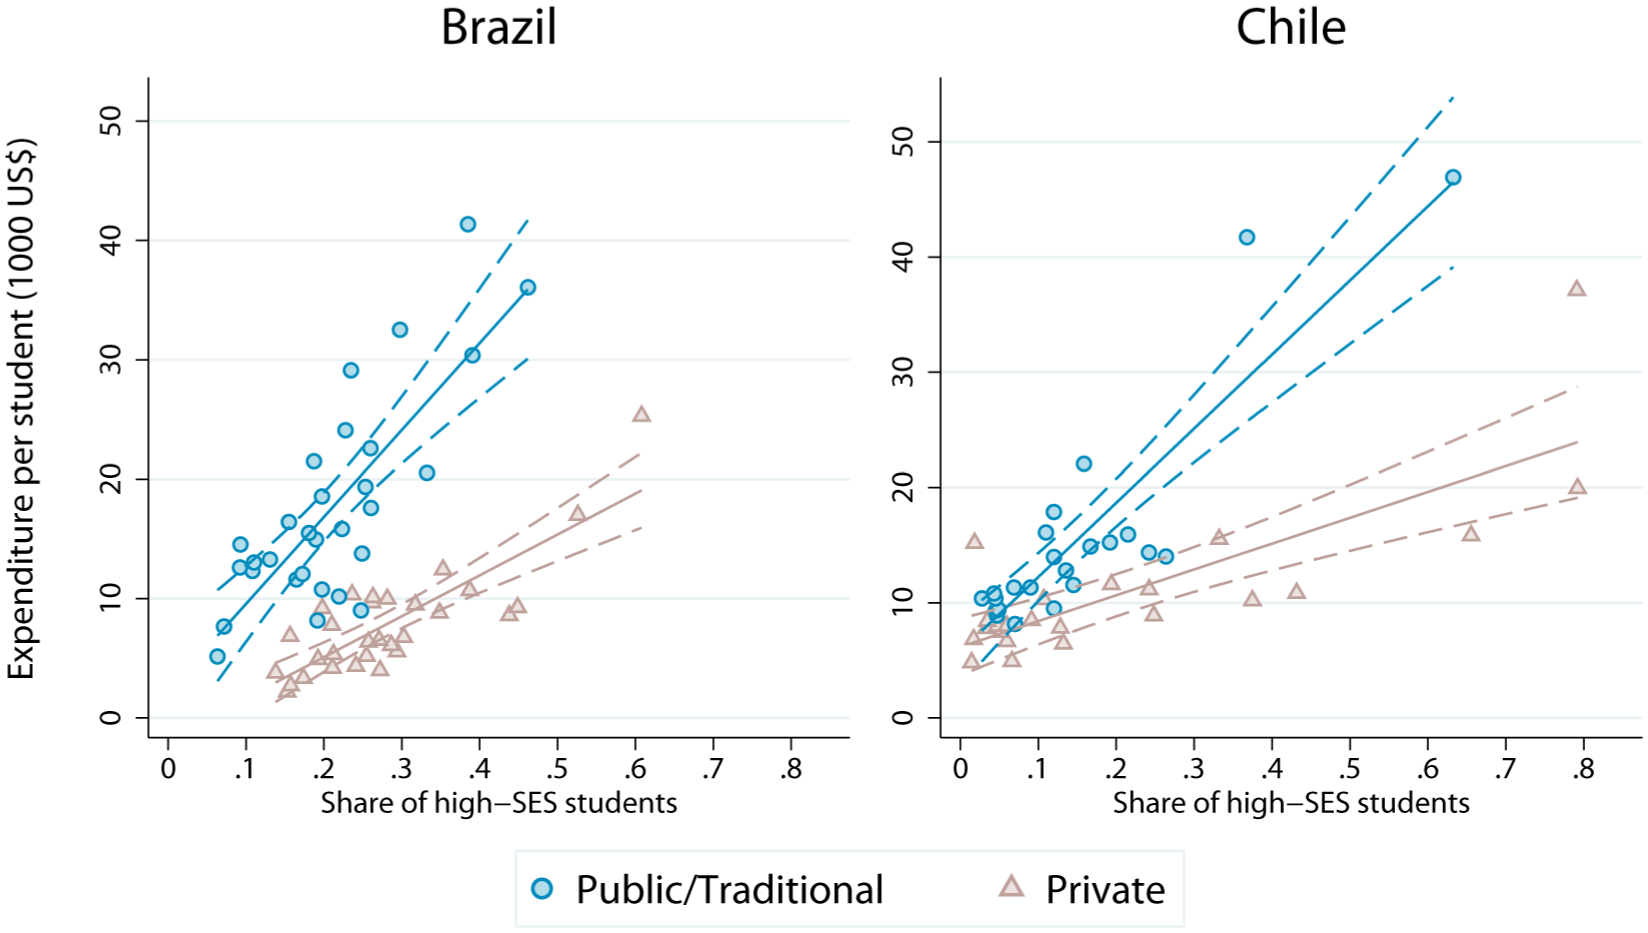
Per-student expenditure and percentage of students coming from high-income families.
These inequalities at the university level yield significant socioeconomic gaps at the student level. Figure 7 shows the differences between the average resources accessed by high-income and lower income students, which are calculated by weighting each university according to the proportion of students of each income group that attends it. Confidence intervals were calculated using 1,000 bootstrap repetitions. Chile shows a greater gap: high-income students enter universities with an average per-student expenditure $8,400 higher than that of low-income students. This gap is $3,000 in Brazil. When expressed as ratios, these results indicate that for every dollar potentially benefiting low-middle-income students in Chile and Brazil, high-income students get $1.70 and $1.30, respectively (see Figure A12 in the Supplementary Material).
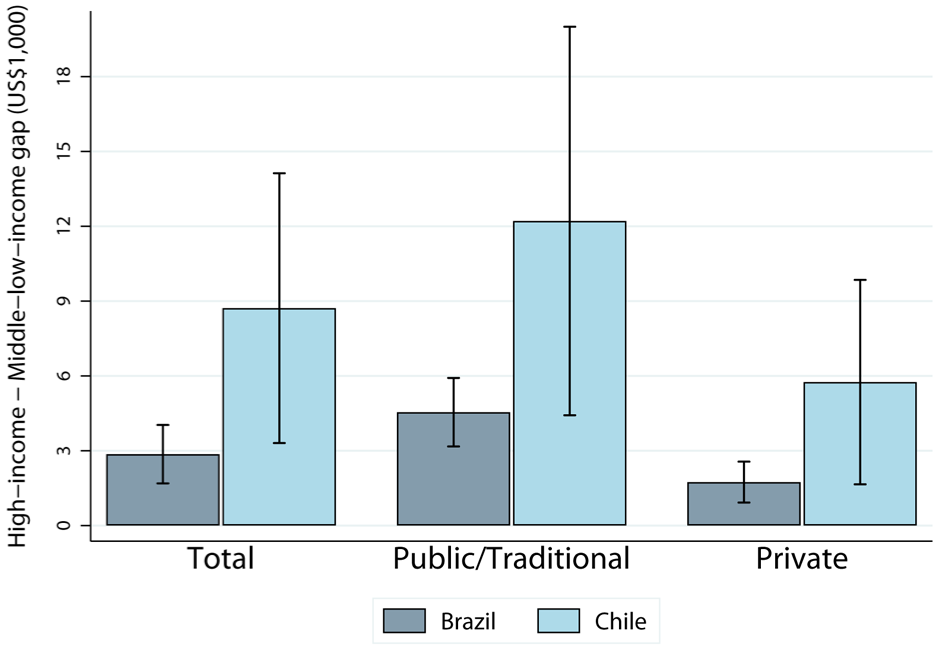
Socioeconomic gap in per-student expenditure.
In both countries, the socioeconomic gap in the public/traditional sector (nearly $11,700 in Chile and $4,500 in Brazil) is about twice as large as in the private sector. Within the Brazilian public sector, this gap is more pronounced among students in state universities ($5,700 compared with $3,600 among students in federal universities) (see Figure A11 in the Supplementary Material). Among Chilean traditional universities, this gap is larger for the traditional private group ($13,900 compared with $9,400 among students in state universities).
Mission Diversity, Research, and Socioeconomic Disparities in Resources
Last, I descriptively assess the institutional features that might mediate the association between socioeconomic composition and expenditures at the university level. Figure 8 presents the estimated
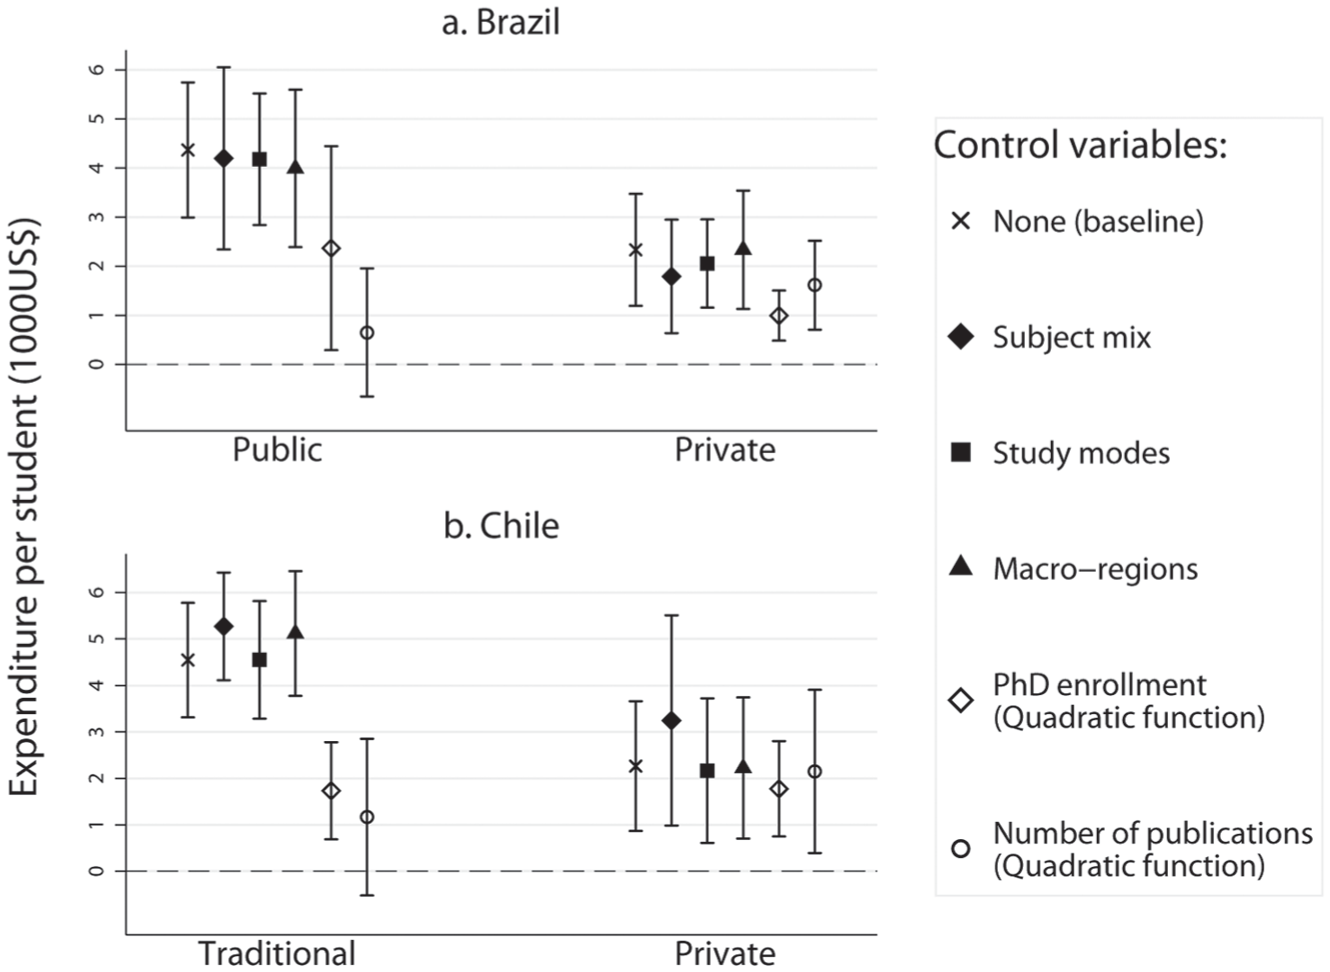
Per-student expenditure gap between universities with a 10-point difference in the share of high-income students: (a) Brazil and (b) Chile.
When covariates are added to the model, subject mix and location in Chile, and subject mix and study modes in Brazil, show a statistically significant joint association with per-student expenditures in the public/traditional sector (based on F statistics at the 95 percent confidence level; see Table A14 in the Supplementary Material). However, controlling for these variables has little effect on the estimated coefficients in Figure 8, indicating that they do not meaningfully account for the resource disparities between public/traditional universities serving different socioeconomic groups.
In contrast, the magnitude of the coefficients declines substantially (from 4.5 to 0.6 in Brazil and from 4.5 to 1.2 in Chile) after accounting for the number of publications. This suggests that socioeconomic gaps in university resources within the public/traditional sector are consistent with high-income students disproportionately entering well-funded universities with high research intensity. Conversely, in the private sector, these controls do not greatly change the estimated relationship between per-student expenditure and socioeconomic composition. After controlling for the postgraduate enrollment and number of publications, the coefficient associated with the share of high-income students among private institutions decreases from 2.3 to 1.6 in Brazil and from 2.3 to 2.2 in Chile, remaining equally significant.
These results hold when using cost-based groups of subject mixes (see Table A15 in the Supplementary Material), when considering socioeconomic groups based on mothers’ education instead of income (see Figure A14 in the Supplementary Material), and when using the number of publications in 2012–2016, before the expenditure window used in the analysis (see Tables A12 and A13 in the Supplementary Material). They also hold when separately analyzing each expenditure component: salaries and other operating costs (see Figure A15 in the Supplementary Material).
Socioeconomic Disparities across Revenue Sources
The Chilean data on universities’ financial statements breaks down university revenues into six categories: public transfers, fees, extension programs, nonteaching services, donations, and others. Table A1 in the Supplementary Material shows the distribution of these items, and Table A16 in the Supplementary Material replicates the previous estimations using these six different income sources. These results only consider Chile, as this information is unavailable for Brazil.
Traditional universities with a 10-point higher share of high-income students have significantly higher revenues across all revenue sources. This difference amounts to approximately $1,200 per student in public transfers and $2,300 in nonteaching revenues, together accounting for about 75 percent of the total disparity, with fees, extension activities, and donations explaining the remainder. These gaps decline considerably and are no longer significant once I control for research output. For instance, the coefficient for public transfers drops from $1,200 to $100, and the coefficient for nonteaching revenues decreases from $2,300 to $1,400 after controlling for research. In contrast, fees make up more than half of disparities in the private sector, and these disparities are not affected by adjusting for universities’ characteristics and research intensity. The coefficient associated with fees decreases modestly from $1,300 to $1,000 after controlling for research, and it remains equally significant.
Discussion
Two key insights emerge when comparing these findings with prior studies. First, despite Brazil and Chile’s high income inequality, university-level inequality in per-student expenditures is moderate by international standards (Czarnecki and Sauer 2024; Davies and Zarifa 2012). Second, student segregation across universities is considerably lower than in primary and secondary education (Kuzmanic et al. 2022). Murillo Torrecilla and Martínez Garrido (2017) found a dissimilarity index of 0.57 in Brazil and 0.60 in Chile for primary school students in the top 25 percent of the socioeconomic distribution, well above the 0.25 and 0.42 found here for university students in the top 21 percent to 23 percent of the income distribution. This suggests that higher education expansion may help mitigate overreaching inequalities in these countries.
Despite relatively moderate levels of stratification and segregation in Brazil and Chile, they yield non-negligible disparities in the resources available to universities serving different income groups. On average, high-income students access 1.3 and 1.7 times the per-student expenditure accessed by low-income students in Brazil and Chile, respectively. These disparities are more pronounced among public universities, raising concerns about the equalizing role expected from this sector. The positive correlation between universities’ resources and students’ family income in the public sector contrasts with the equity principles guiding school funding in many countries, including Chile, where more public resources are allocated to schools with higher shares of low-income students.
Public higher education is typically hierarchically structured, “with a few research-focused universities counterbalanced by many lower cost options in an effort to allocate resources efficiently” (Taylor and Cantwell 2019:72). Brazil and Chile follow this pattern but with contrasting funding models. Brazilian public universities are free for students and depend on performance-based government funds; Chilean traditional universities are more dependent on student tuition fees and other income-generating activities. However, both systems show similar inequality in per-student expenditure among public/traditional universities. Across these diverse funding models, the most research-intensive public institutions consistently secure a larger share of revenues, while others are currently facing severe underfunding, having to downsize their staff and operations (Campos 2024; Lopez 2025).
Resource inequality across public universities primarily affects low-middle-income students, who are more likely to enter financially struggling institutions. These social disparities in the public/traditional sector are more pronounced in Chile, where socioeconomic segregation is higher, potentially reflecting the differentiated impacts of the equity policies in each country. Although Chile has focused on addressing low-income students’ financial barriers and disadvantages in admission exams, Brazil directly targeted the social composition of federal universities through a quota policy. Further research is needed to assess and compare the differentiated impacts of these policies.
Private universities exhibit resource stratification similar to their public counterparts. Competition typically drives private universities to position themselves in specific resource niches, and this “institutional positioning occurs beyond academic and research dimensions” (Buckner and Gong 2022:1208). These universities often differentiate by promoting particular campus experiences and nonacademic services that resonate with the expectations and preferences of different income groups (Alter and Reback 2014; Jacob et al. 2018). As a result, private universities targeting high-income niches might charge higher tuition fees without necessarily resulting in a greater research capacity. The results from this study support these hypotheses: even controlling for research intensity, private universities with higher shares of high-income students exhibit significantly greater per-student expenditures and revenues.
The position of new private universities often results from the “deliberate and emergent management’s attempts to deal with the external competitive environment” (Fumasoli, Barbato, and Turri 2020:319). Accordingly, the more integrated competition between traditional and new private universities in Chile, compared with the deeper regulatory divide between sectors in Brazil, might have set the ground for some private universities to engage more strongly in a niche-building strategy based on the socioeconomic profile of their students (Villalobos Dintrans et al. 2020). This aligns with the significantly higher social stratification of private universities in Chile. Although this study cannot directly test this hypothesis, the findings highlight the need for further research to understand the features shaping social stratification across different higher education systems and its implications for equity.
This study focuses on the period immediately before the COVID-19 pandemic, which had lingering effects across Latin American countries (UNESCO 2022). Pandemic-related shocks likely altered patterns of access and persistence among students from different socioeconomic backgrounds (Funk 2021; Pinto 2021) and may have disproportionately affected underfunded institutions, which are less able to build financial buffers (Ingram 2023). More research is therefore needed to examine how these disparities have evolved. Future work should assess whether existing gaps in resources and student composition are widening, or whether higher education policies are effectively mitigating these inequalities across institutions and sectors.
Limitations
This study has three main limitations. First, the analysis relies on data from different sources in each country, which poses challenges for both sample representativeness and cross-national comparability. These challenges include timing asymmetry in measuring students’ family income and excluding 38 Brazilian institutions without financial information. Alternative analyses provide suggestive evidence that these limitations do not materially affect the main conclusions. However, some uncertainty remains about how much these data limitations might influence the magnitude of reported differences across countries. Second, the Chilean university system is relatively small, limiting the statistical power of some analyses for this country. Accordingly, results for Chile should be interpreted with caution, especially the null effects from sector-specific models. Finally, the analysis does not support causal claims. The association between expenditure, socioeconomic composition, and other institutional characteristics (such as research intensity) likely reflects mutually reinforcing processes, raising concerns about circularity and making it difficult to establish directionality. The findings should be interpreted as descriptive patterns of resource stratification and socioeconomic segregation.
Conclusion
The financial stratification of higher education usually benefits high-income students, who are more likely to enter well-funded institutions. This study finds a positive and significant correlation between universities’ resources and their students’ family income in Brazil and Chile, two countries with contrasting funding models for public universities but shared trends in the expansion of private provision. Socioeconomic segregation across universities is more pronounced in Chile, resulting in greater socioeconomic disparities in access to university resources. Yet the mechanisms underlying these disparities are similar across countries. In the public and traditional sectors, resource gaps across socioeconomic groups are driven largely by unequal access to research-intensive universities. In contrast, disparities in the private sector seem to stem from universities’ positioning within varying income market niches, with research playing a minor role in explaining socioeconomic differences in university resources.
Supplemental Material
sj-docx-1-srd-10.1177_23780231261451346 – Supplemental material for Resource Stratification and Income Segregation in Brazilian and Chilean Universities
Supplemental material, sj-docx-1-srd-10.1177_23780231261451346 for Resource Stratification and Income Segregation in Brazilian and Chilean Universities by Danilo Kuzmanic in Socius
Footnotes
Acknowledgements
I sincerely thank my supervisors, John Jerrim and Per Engzell, for their ongoing support. I also appreciate the Ministry of Education and Agencia de Calidad de la Educación of Chile for providing data for this research. The study’s findings are solely my responsibility and do not represent the views of the agency or the ministry.
Funding
The author disclosed receipt of the following financial support for the research, authorship, and/or publication of this article: This work was supported by Agencia Nacional Investigación y Desarrollo (basal funding for Project CIA250005 and grant Project 72230237).
Declaration of Conflicting Interests
The author declared no potential conflicts of interest with respect to the research, authorship, and/or publication of this article.
Supplemental Material
Supplemental material for this article is available online.
Author Biography
References
Supplementary Material
Please find the following supplemental material available below.
For Open Access articles published under a Creative Commons License, all supplemental material carries the same license as the article it is associated with.
For non-Open Access articles published, all supplemental material carries a non-exclusive license, and permission requests for re-use of supplemental material or any part of supplemental material shall be sent directly to the copyright owner as specified in the copyright notice associated with the article.