
Abstract
Young children are generally enthusiastic about digital technology, yet participation in early computer science pathways remains unequal. Because U.S. children often learn computing outside of school, field-specific knowledge within families may play a greater role than socioeconomic status (SES) in reproducing inequality. The authors evaluate support for the social reproduction and occupational inheritance models by examining middle school students’ interest in computing occupations. Although children’s interest in computing varies by SES, the domain-specific resources of parents who work in science, technology, engineering, and mathematics, such as digital skills and home learning practices, appear to have a stronger association with interest. These findings underscore the importance of familial transmission in the reproduction of occupational inequality and inform efforts to address stratification in digital learning.
Public awareness has grown regarding how digital technologies shape politics, commerce, and social life, yet efforts to diversify participation and representation in computing fields have proven difficult. Although tech jobs are lucrative, growing evidence suggests that strong academic performance in math and science is often not associated with interest in computing paths (Chen, Perez-Felkner, et al. 2024; Moote et al. 2020). The social reproduction model has historically provided a lens through which to understand how children develop interest in occupational pathways, suggesting that higher socioeconomic status (SES) background increases key resources that facilitate school success such as books, quality teachers, and technology (Mann and DiPrete 2016; Simpkins et al., 2006; Vincent and Maxwell 2016; Wang 2013). Some research also suggests that higher SES parents invest in the development of children’s learning skills to a greater extent than lower SES parents, boosting attitudes and practices that are advantageous in school (Calarco 2011; Lareau 2003).
Studies that have specifically addressed computing show patterns more consistent with a competing theory, occupational inheritance. Among different social strata, ownership and interpersonal exchanges of digital devices are widespread (Watkins et al. 2018), and children’s use of and enthusiasm toward digital technology are generally high regardless of social class (Rideout et al. 2022), but few families may have the specific knowledge or resources to focus, support and develop children’s enthusiasm for computer science (CS) paths while also guiding academic achievement (Bonanati and Buhl 2022; Moote et al. 2020). For example, parent SES is significantly associated with financial investments in children but not with time investments in children (childcare, play, teaching) (Schneider, Hastings, and LaBriola 2018). In addition, there does not appear to be a strong association between family income and interest in CS paths (Gallup and Amazon 2021). This suggests that SES may be connected with children’s interest in computing, but the cultural and structural factors outside of school need to be considered as well, such as those which promote learning at home. Children with parents who work in science, technology, engineering, and mathematics (STEM) fields may be advantaged over other children, but studies of early CS paths rarely distinguish between the mechanisms associated with SES and those associated with domain-specific resources.
To compare the effects of family SES and parent computer skill on children’s computing interest, we use a diverse dataset of 3,197 middle school children, a key period for academic paths. Our findings suggest that higher SES may boost student access to devices and interest in school generally, but that parent occupation and parent computer skill is more strongly associated with children’s enthusiasm for computing paths. Our contributions provide insight into the unique circumstances under which enthusiasm develops toward a field with substantial impact on social life, highlighting how digital inequality is reproduced not just as a product of resources but also with shared knowledge and enthusiasm.
Literature Review
SES and Social Reproduction
Children from higher socioeconomic backgrounds often possess more essential resources than those from lower SES backgrounds and are more likely to develop competencies in CS (Warner-Griffin et al. 2024). High-SES children tend to be advantaged by early preparation and access to school resources such as quality textbooks, lab equipment, and knowledgeable teachers (Xie, Fang, and Shauman 2015). Higher SES schools are more likely to offer computing courses that may increase student interest and enthusiasm in these paths (Gallup and Amazon 2021; Maltese and Tai 2011). Family SES is positively associated with parent investment in the development of children’s learning skills via educational materials in the home, higher quality schools, and enrichment activities after school (Chin and Phillips 2004; Kaushal, Magnuson, and Waldfogel 2011; Meier, Hartmann, and Larson 2018). Higher SES parents have more substantial family resources, providing educational materials, extracurriculars and visits to science museums (Archer et al. 2012; Moote et al. 2020; Starr, Ramos Carranza, and Simpkins 2022) which may foster enthusiasm toward computing.
For computing specifically, higher SES families may be more likely to afford fast and dependable devices (Gonzales, McCrory Calarco, and Lynch 2020; Kaushal et al. 2011) as well as enrollment in computer camps (Liu and Schunn 2020). With greater time investments, higher SES parents may more effectively encourage children to spend their time online or with computers in more human capital enhancing activities (Calarco 2011; DiMaggio et al. 2001). Parents with a college degree or higher appear more equipped to manage child tech use than other parents, for example (Archer et al. 2012; Barron et al. 2010; Mollborn et al. 2022). This parallels findings that children from higher socioeconomic backgrounds more often take disproportionate access to computers in the classroom and leverage the knowledge acquired from their families and communities (Margolis and Fisher 2003; Margolis et al. 2017). Higher SES children may also be shown more science content online (Hargittai et al. 2024) and then have a more diverse range of exploratory activities to further engage their interests such as home activities and internships (Grant 2023; Meier et al. 2018).
A body of scholarship now shows uneven support for the social reproduction model, especially as digital technology has grown more commonplace in daily life. Time has grown increasingly scarce for all parents, not just lower SES families. The SES gap in time spent with children has not increased alongside rising income inequality, unlike money spent on educational enrichment (Schneider et al. 2018). Although differential access to devices and high-speed Internet persists in the United States, potentially affecting how children develop enthusiasm for computing, skill sets and interest in tech classes appear to be more equally distributed, especially early in the life course. Digital devices are increasingly loaned via peer networks, schools and public libraries (Watkins et al. 2018), children’s interest in technology is generally high (Godec, Archer, and Dawson 2022; Livingstone and Pothong 2021), and the availability of low cost, out-of-school STEM education is increasing (Kitchen et al. 2022; Selwyn 2018; U.S. Department of Education 2022). Indeed, in a nationwide survey by Gallup, family income and parent educational attainment were not significantly associated with child interest in a computing field (Chen, Rothwell, and Maynard-Zhang 2024). And even though findings from the Programme for International Student Assessment (PISA) suggest that higher SES is associated with children’s demonstrated information and computer technology skills and computation thinking (Warner-Griffin et al. 2024), Puckett’s (2022b) study of eighth graders in Chicago (n = 897) and high school students in Boston (n = 1,285) showed that indicators of digital adaptability (e.g., being willing to try and fail, design logic, managing frustration) were not significantly differentiated by SES or race. In the past, exposure to occupational information was limited by family and school experiences, but media potentially exposes children to a wider range of occupations (Oyserman, Bybee, and Terry 2006; Steinke 2017). When it comes to child interest in tech occupations, the knowledge available in families could play more of a role than SES background.
Families and Occupational Inheritance
Research on occupational inheritance in the United States has increasingly suggested that parent occupation is associated with children’s early paths into STEM. Children with parents in STEM occupations appear advantaged in terms of their greater interest in high school STEM courses and STEM college majors (Hsieh and Simpkins 2022; Moakler and Kim 2014; Plasman, Gottfried, and Williams 2021; Riegle-Crumb and Moore 2014; Sax et al. 2017). The reproduction of advantage may also be associated with the ways that STEM families structure learning at home (Benner, Boyle, and Sadler 2016; Jonsson et al. 2009; Weeden and Grusky 2005). Interest and confidence in STEM subject matter are particularly beneficial in educational paths (Stearns et al. 2020) and appear to be facilitated by parent socialization (Simpkins, Davis-Kean, and Eccles 2010).
When it comes to computing interest, STEM parents may be better equipped to discern and facilitate children’s tech skills, efficacy and enjoyment. They may have more frequent and enriching conversations about the mechanics of everyday objects and the scientific reasoning behind natural phenomena (Dabney, Tai, and Scott 2016; Dou et al. 2019). Role models appear particularly important in computing paths (Gallup and Amazon 2021; Gallup and Amazon 2023) and STEM parents may have more supportive social networks relative to high-SES parents (Riegle-Crumb and Moore 2014), increasing the ability to identify, acquire and maintain effective digital technology for children. Given family rules around screen time and their implications, lower SES children may enjoy their time on digital devices to a greater extent than higher SES children (Rideout and Robb 2019), but be limited in the ways that they explore computing paths. STEM parents may be unique in their attitudinal framework, knowledge and access to key social and economic resources, but it has been difficult to disentangle the effect of SES and the effect of STEM-advantaged households when it comes to occupational aspirations.
STEM subject job aspirations are often aggregated in the scholarship, making it challenging to discern the importance and effect of domain-specific knowledge, but some evidence suggests that practices and dialogue about computing are particularly important for young people’s tech interests. For example, although family income and parent educational attainment are not significantly associated with child interest in computing jobs, parent information technology skill is (Chen, Rothwell, et al. 2024). Similar perhaps to math skills, parent tech skills may inform habits and practices with children around technology (Simpkins et al. 2010). Although higher SES children appear to have more perceived and demonstrated tech skills (Warner-Griffin et al. 2024), STEM parents may go beyond more superficial limitations around screen time to more nuanced aspects of tech adaptability and the importance of semiautonomous learning. When cultivated through practice and monitoring, the reciprocal relationship between perceived and demonstrated skills can support the development of metacognition, thereby enhancing children’s capacity to monitor their learning processes and regulate effort while engaging with digital technologies (Hohlfeld, Ritzhaupt, and Barron 2013; Mollborn et al. 2022). Popular misconceptions about the computing field are pervasive (Grønhøj, Wong, and Bundsgaard 2025; Grover, Pea, and Cooper 2014; Hansen et al. 2017), which can limit student interest in computing (Holmegaard et al. 2025; Holmegaard, Madsen, and Nielsen 2023), but families with substantial computer knowledge and enthusiasm may be better equipped to dispel them. For example, culturally shaped beliefs about computing skills and inherent ability can harm girls’ interest and motivation, interfering with their continued skill building (Master et al. 2023; Sun, Hu, and Zhou 2022) but parents aware of these issues may more successfully intervene.
This Study
Informed by evidence suggesting that children’s computing job aspirations may be uniquely shaped at home, this project evaluates support for the social reproduction and occupational inheritance models. The former supposes that CS aspirations are associated with resources and skills provided by SES background. In contrast, occupational inheritance may be connected to home learning and domain-specific knowledge. As such, we distinguish between home environments with high SES from those with parents who work in STEM fields, using a measure of tech learning at home. We examine students in middle school, a key period for academic pathways, when decisions are often made about course taking in high school (Legewie and DiPrete 2014). Our hypotheses are as follows:
Hypothesis 1: In constrained models, SES is significantly and positively associated with children’s interest in CS pathways, showing some support for the social reproduction model.
Hypothesis 2: In unconstrained models, children’s computer interest is more strongly associated with parent STEM status than SES, showing support for occupational inheritance.
Hypothesis 3: More challenging computer learning at home is likely to be associated with child interest in computing paths, and the relationship remains when parent computer skills are included in the model, thus showing more support for occupational inheritance than social reproduction.
Hypothesis 4: Child tech skills are more strongly associated with interest in computing paths than parent occupation or SES background.
In the analysis that follows, we assess the hypotheses with multivariate regression analysis. We evaluate hypothesis 1 by interpreting the effect of SES across the models. We assess hypothesis 2 by including parent STEM status. Hypothesis 3 is evaluated by adding our measure of computing learning at home and child-reported parent computer skills. Hypothesis 4 is evaluated by including child tech skills in the unconstrained model. We also include controls for grade level as interest may decline in the early teens (Ghasemi and Burley 2019; Google and Gallup 2017; Lofgran, Smith, and Whiting 2015).
Children’s interest in computing is based on data from the survey period (fall 2015 and spring 2016) and likely informs present and future social phenomena as well. Digital technology plays more of a role in our social interactions and social institutions than ever before, affecting how children become familiar and interested in computing. Children’s experiences learning computing at home likely vary as a result of culturally shaped beliefs and structural access. Although reports show that the proportion of middle schools in the United States that offer foundational CS courses has increased slightly since our surveying, most still do not (Code.org, Computer Science Teachers Association, and Expanding Computing Education Pathways Alliance 2023). When courses are offered, culturally shaped beliefs about traditional academic subjects tend to be emphasized over low-stakes, informal experiences and connected learning (Pascoe 2023; Rafalow 2020; Watkins et al. 2018). Although our data were collected prior to the COVID-19 pandemic, the present study can highlight the extent to which informal, out-of-school spaces are impactful and inform how schools and teachers might leverage child interest into computing paths.
Methods
Sample and Data Collection
This study reports analyses of a sample of middle school students in the southeastern United States. Our methodology has been published previously (Ashlock, Stojnic, and Tufekci 2022, 2023; Ashlock and Tufekci 2024) so we provide an abridged summary here. After focus groups and survey piloting in early 2015, the survey was administered in classrooms from fall 2015 through spring 2016, in a paper-and-pencil format, resulting in an initial sample of 5,235 students.
Respondents came from a stratified sample of middle school students in three school districts. We used a nonrandom sampling technique described by Cohen (1992), statistical power analysis, which places the focus on obtaining a sample that is diverse and large enough to allow sufficient statistical power in the analyses. The choice of schools was based on the proportion of children eligible for reduced lunch, as well as the proportion of White, Black, Latino, and Asian American students according to publicly available information. In total, permission was obtained from 15 schools, including 13 public schools (nonmagnet schools [those serving neighborhoods in a particular area] and magnet schools [those specializing in particular programs and attracting students from a large region]). The proportion of students surveyed in each school depended on the degree of access and resources of surveyors. The student response rate was high, in part because of institutional review board approval for an “opt out” form. We aimed for a near census of the schools, and according to publicly available information, we took an average sample of 83 percent of the school population. When we were unable to survey all students because of staffing constraints and other issues, a convenience sample was achieved, although a representative sample was made whenever possible. Five of the 15 schools were a convenience sample (consisting of about one quarter of the original sample), and 10 were representative, in that the proportions of White, Black, Hispanic, and Asian students surveyed at each school were very similar to the public information of each school’s demographics. 1
In the three counties surveyed, the gender difference in state accountability tests is −.05 to .05 SD units for math (with upper bounds for boys) and −.35 to −.25 SD units for English language arts (with upper bounds for girls), indicating that they are representative of most counties in the United States (Pope and Sydnor 2010). The proportion of respondents with parents working in a STEM field is higher than the national average, and thus the sample may be more knowledgeable of STEM fields than other children in the United States.
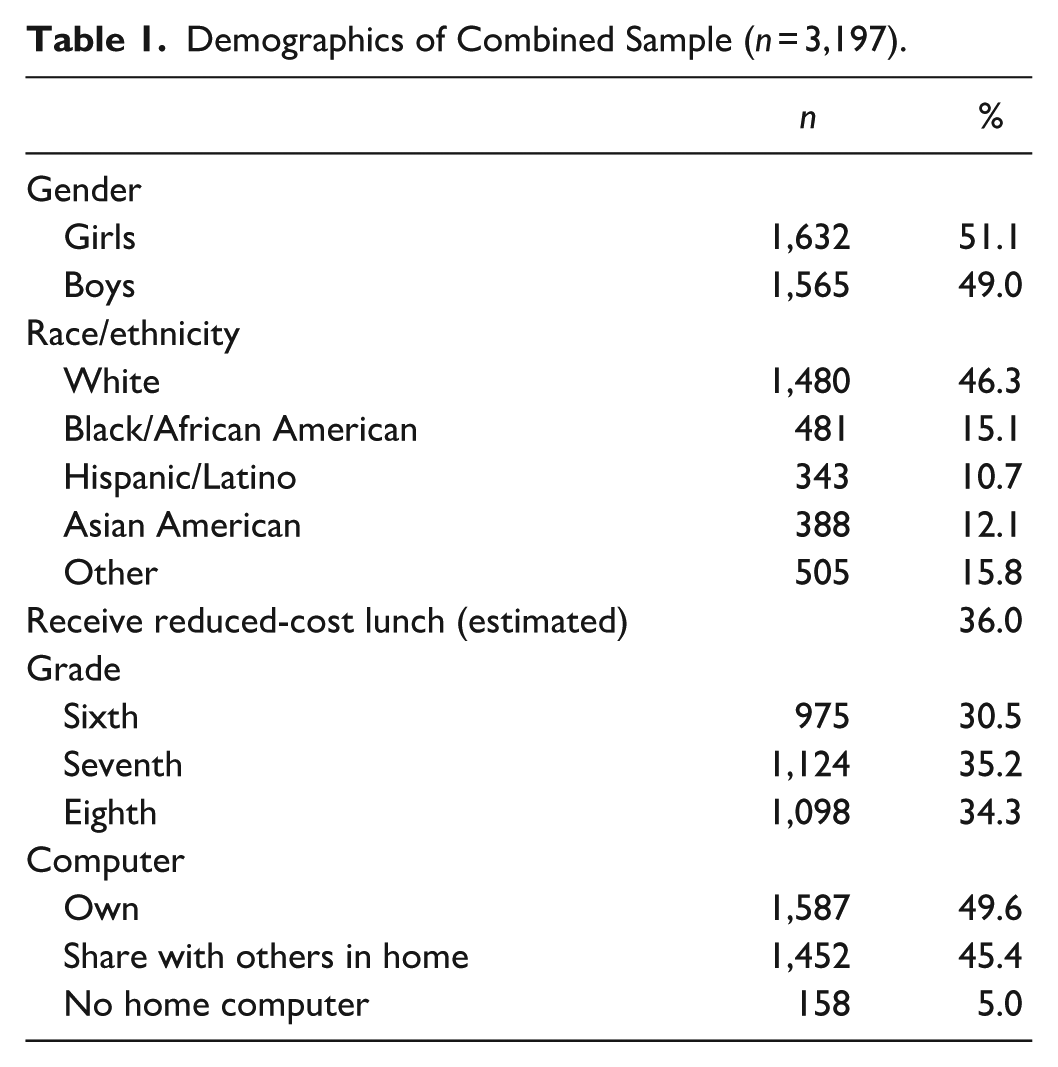
A consistent analytic sample was specified with information for all models. Demographic characteristics of the sample are described in Table 1. Overall, 36 percent of the sample is estimated to receive reduced-cost lunch. White students constitute 46 percent of the sample (1,480 respondents). Typically underrepresented in surveys of this kind, Black students constitute 15 percent of the dataset (481 respondents), Hispanic or Latino Americans approximately 11 percent (343 respondents), Asian Americans 12 percent (388 respondents), and multiracial children 16 percent (505 respondents).
Demographics of Combined Sample (n = 3,197).
Measures
Dependent Variable
Drawing from language and terms used by respondents in preliminary interviews, focus groups and questionnaire piloting, our measure of computing interest is “Are you interested in a career in technology where you would be developing software or designing or repairing computers?” on a scale of “very interested,” “somewhat interested,” “a little interested,” and “not at all interested” and then reverse coded such that higher values indicate more student interest. Our measure is similar to a survey item from Hill et al. (2017), which asked middle schoolers, “How much, if at all, do you want to be a scientist?” with response options on a scale of “a lot,” “some,” “a little,” and “not at all.” Although the question references aspects of digital technology that respondents spoke about in our preliminary research, it runs the risk of highlighting more masculine tasks associated with computing and is thus somewhat restrictive. Readers should take caution in this regard (Margolis and Fisher 2003). We did not ask about likelihood of becoming a computer scientist (Dou et al. 2020; Google and Gallup 2020) as this may be too restrictive or “intentions” (Mujtaba and Reiss 2013) as answers could be confounded by respondents’ perceived external constraints.
Social Reproduction Variables of Interest
SES is a composite adapted from the measure of SES in PISA (Programme for International Student Assessment 2014:16), a well-known cross-national comparison of 15-year-old student achievement. PISA combines parents’ highest education, highest occupation socioeconomic index, and an index of 23 household items intended to measure wealth, cultural possessions, and educational resources. The weights assigned to each component are empirical; they come from the principal component analysis. We emulate the PISA measure of SES, the only exception being that we use a different index in the place of home possessions. Although PISA uses items in the home such as dishwashers, televisions, and telephones, we expected that there would not be enough variance in these items to indicate the differences in wealth and resources across our sample. PISA also includes computers in their list of home possessions but, as an item of interest in our study, this item needed to be used separately in the analysis. Our modification for the purposes of this project was to use books in the home as a measure of human capital together with parental education (used by PISA as well as the Trends in International Mathematics and Science Study and the National Assessment of Educational Progress), as well as a measure of home crowding, a proxy for a household’s consumption capacity or a resource constraint. Other research has looked at number of siblings as a constraint on financial resources as well as parental attention (Cowan et al. 2012), but home crowding may better reflect the abundance or lack of resources across different outcomes of interest compared with home possessions. 2 Our SES composite measure explains more variation in respondent math grades than simple household size. 3 In the analytical sample, our SES variable has a mean of 0 and a standard deviation of 1 and ranges from −5.58 to 1.52.
Math grades are self-reported. Higher values indicate A’s, lower values indicate D’s, and so forth. Self-reported grades are adequate measures of academic performance as students tend to accurately respond to such questions in surveys. It should be noted that respondents may inflate their performance when such an item is sensitive, as in the case that they are lower performing (Rosen, Porter, and Rogers 2017). Readers are advised to take these issues into account.
The computer ownership measure is constructed from a question on the survey which asked respondents if they own a computer and if they have their own device, if they shared it with people in their family, or if they did not have the device. Answers were coded as “owning,” “sharing,” or “not having” and ambiguous answers coded as missing. We use only the computer ownership indicator in our analysis as the number of children without a computer in their household is small (n = 158) by comparison (see Ashlock et al. 2022 for more detailed analysis of this measure).
Occupational Inheritance Variables of Interest
Parent STEM occupation is derived from three open-ended questions on the survey: current job title, location, and tasks done on the job. Two raters independently read and reviewed all answers to determine placement into occupational categories. The general occupation schema for the survey reflects U.S. Department of Labor groupings and includes additional granularity in our specific areas of interest (see Appendix B for the schema). Ambiguous answers were coded as “unable to determine.” Preliminary coding and interrater reliability testing of the parent occupational data in the pilot study (n = 93) informed some modifications to the occupational schema, and then parent occupations were coded in the full sample (n = 5,235) independently by the two raters. The κ statistic for interrater reliability was .73 for fathers and .80 for mothers. The raters then reviewed all coding disagreements in person and together decided on proper designations. A dummy variable for STEM fathers and mothers was then constructed which aggregated the science, technology, engineering and math-related occupations and then an additional dummy (presented in the following tables) for STEM households. Children who reported two parents with neither in STEM fields were coded 0 and any parent in STEM as 1 (single parents are included). About half of the families in our analytical sample have at least one parent working in a STEM field (48.4 percent), much higher than national averages (Holian and Kelly 2020), likely because of the presence of several educational, technical, and medical organizations in the sampling area. Fathers are about twice as likely to be working in a STEM field in comparison with mothers (39.4 percent vs. 21.3 percent), and in the instance that both parent occupations are known, a significant proportion of students in the analytical sample have both parents working in a STEM field (15.6 percent).
Computer learning at home was measured by a question which asked respondents the extent to which they agreed with the statement “I use computers at home for more difficult things than at school,” with possible answers “not at all true of me,” “mostly not true of me,” “a little true of me,” and “very true of me.” This measure is similar to a survey item used by Simpkins et al. (2010), which reported frequency on a Likert-type scale of working with their child on the computer. Moote et al. (2020) and Archer et al. (2015) also used measures pertaining to participation in science activities outside of school, but not specifically about home use.
Parent computer skill (fathers and mothers) was measured using the question “How skilled is your father/mother when it comes to using the following technologies?” with response options for computers of “very unskilled,” “somewhat unskilled,” “somewhat skilled,” and “very skilled.” The questions about cell phones, tablets, and game systems were not implemented, as they were not correlated to the dependent variable or not intuitively connected to computing occupational interest. Other surveys have used parent self-reports of skill that have more internal validity (Chen, Rothwell, aet al. 2024). Readers are advised to take these issues into account.
Control Variables
As other research has shown declines in computing interest across the middle school grades (Google and Gallup 2017; Lofgran et al. 2015), dummy variables for grade level are also included, with sixth grade as the omitted category.
Gender is a dichotomous variable in which self-identified girls were coded 1 and self-identified boys were coded 0. A limitation of this measure is that respondents were restricted to binary gender categories, rather than a more expansive battery of questions that might have captured variation in gender identity and gender schemas. (Weisgram 2016).
Variables describing race and ethnic origins derive from an item on the survey, “What is your race or origin? Check all that apply,” with the following categories: “White,” “Black or African American,” “Hispanic/Latino/Spanish,” “Asian (including India/Pakistan),” “Native American,” and “Other. Specify.” Our measure is similar to the combined race and ethnicity question described in Krogstad and Cohn (2014). Only those respondents who placed themselves in the single-race category were coded as such. The “other” category was checked for answers consistent with multiracial identity. Children who indicated White and also reported European American lineage in the “other” section were coded as White. The “other” category consists of Native American and multiracial children. Readers thus need to be careful when interpreting this category or making comparisons with it. The race categories in all regression analyses are dummy variables. The omitted category is White.
Our task-based skill measure is a scale generated from a list of 12 tasks that students reported to have ever done on a computer (0–12). The raw score for this test was established by counting how many of the 12 items the participants checked off. Self-reported task familiarity constructs have good predictive power of actual skills completed in a lab environment (Hargittai 2005, 2008; Hargittai and Hsieh 2011; Hargittai and Kim 2010). Our task skill index consists of a battery of self-reported literacy items in using software, hardware, and the Internet and is similar to a more recent survey, the National Assessment of Educational Progress Computer Access and Familiarity Study (National Assessment of Educational Progress 2019:23). Specifically, respondents were asked to report whether they had ever done 12 tasks: downloaded a file from the Internet, attached a file to an e-mail, rebooted a computer, uploaded a video or photo to the Internet, cleared their browser history, adjusted privacy settings, installed a printer, disabled popups, connected to Wi-Fi, uninstalled programs, used Task Manager to stop a nonresponsive application, and operated a computer from its command line. Cronbach’s α for the tasks is .76. As self-reported tasks do not necessarily indicate actual skill, and our measures do not address digital adaptability (Puckett 2022a), readers should take caution when interpreting the results. Dummy variables for cell phone, tablet and game console ownership are also included in the models to distinguish students who own devices and are interested in computing paths to students who own devices but are not interested. The coefficients are not reported in the models as they are not statistically significant. A note is included in the table.
Missing Values
Stata applies listwise deletion to observations with at least one missing value in any variable. We identified a consistent analytic sample with information for all models. The following descriptive statistics, correlations and regression models include only those respondents who have nonmissing data across all models. Although this reduces our sample size overall by 39 percent (from 5,235 to 3,197), the substantive conclusions reached did not change. The decision was made against imputation because the missing data are likely not random and could lead to biased parameter estimates (Lodder 2014). A comparison of the full model demographics with the analytical model can be found in Appendix A, Table A.
Analytical Strategy
Our analysis takes place in two main parts. First, bivariate analyses evaluate the effect of parent STEM occupation across the dependent variable and variables of interest, and then a correlation matrix is presented. Second, multivariate analyses using ordered logistic regressions evaluate first the effect of SES, and then the variables of interest are added one by one to assess the role of parents and household characteristics net of the controls (gender, race, grade in school). As we are not making causal predictions and our dependent variable is categorical, we chose logistic regression over other methods such as path analysis. Conceptually our research questions are framed with the learning ecology perspective in mind and this indirectly influenced our choice of logistic regression (Ito et al. 2020).
Results
Bivariate Analyses
Table 2 shows bivariate results for all children, those with at least one STEM parent, and those with no STEM parent for the dependent variable and the major independent variables. The average child in the sample has somewhat low enthusiasm for computing occupations: 1.29 on a scale of 0 to 3, or leaning more toward “a little interested” (1) in comparison with “somewhat interested” (2), with a standard deviation of 1.01. The average child with at least one parent who works in a STEM field has significantly more interest in computing paths (1.41).
Bivariate Analyses for Dependent Variable and Major Independent Variables.

Note: SES = socioeconomic status; STEM = science, technology, engineering, and mathematics.
p < .001.
Compared with the average child in the survey, respondents with STEM parents appear to have significantly higher math grades (SD = 0.25), a higher rate of computer ownership (55 percent in comparison with 50 percent), and somewhat more computer skills (SD = 0.13). Children with parents in STEM are more likely than average to agree that they “use the computer at home for more difficult things than at school” (SD = 0.09). This group also perceives their parents to have more computer skills than the sample average.
Correlation Matrix
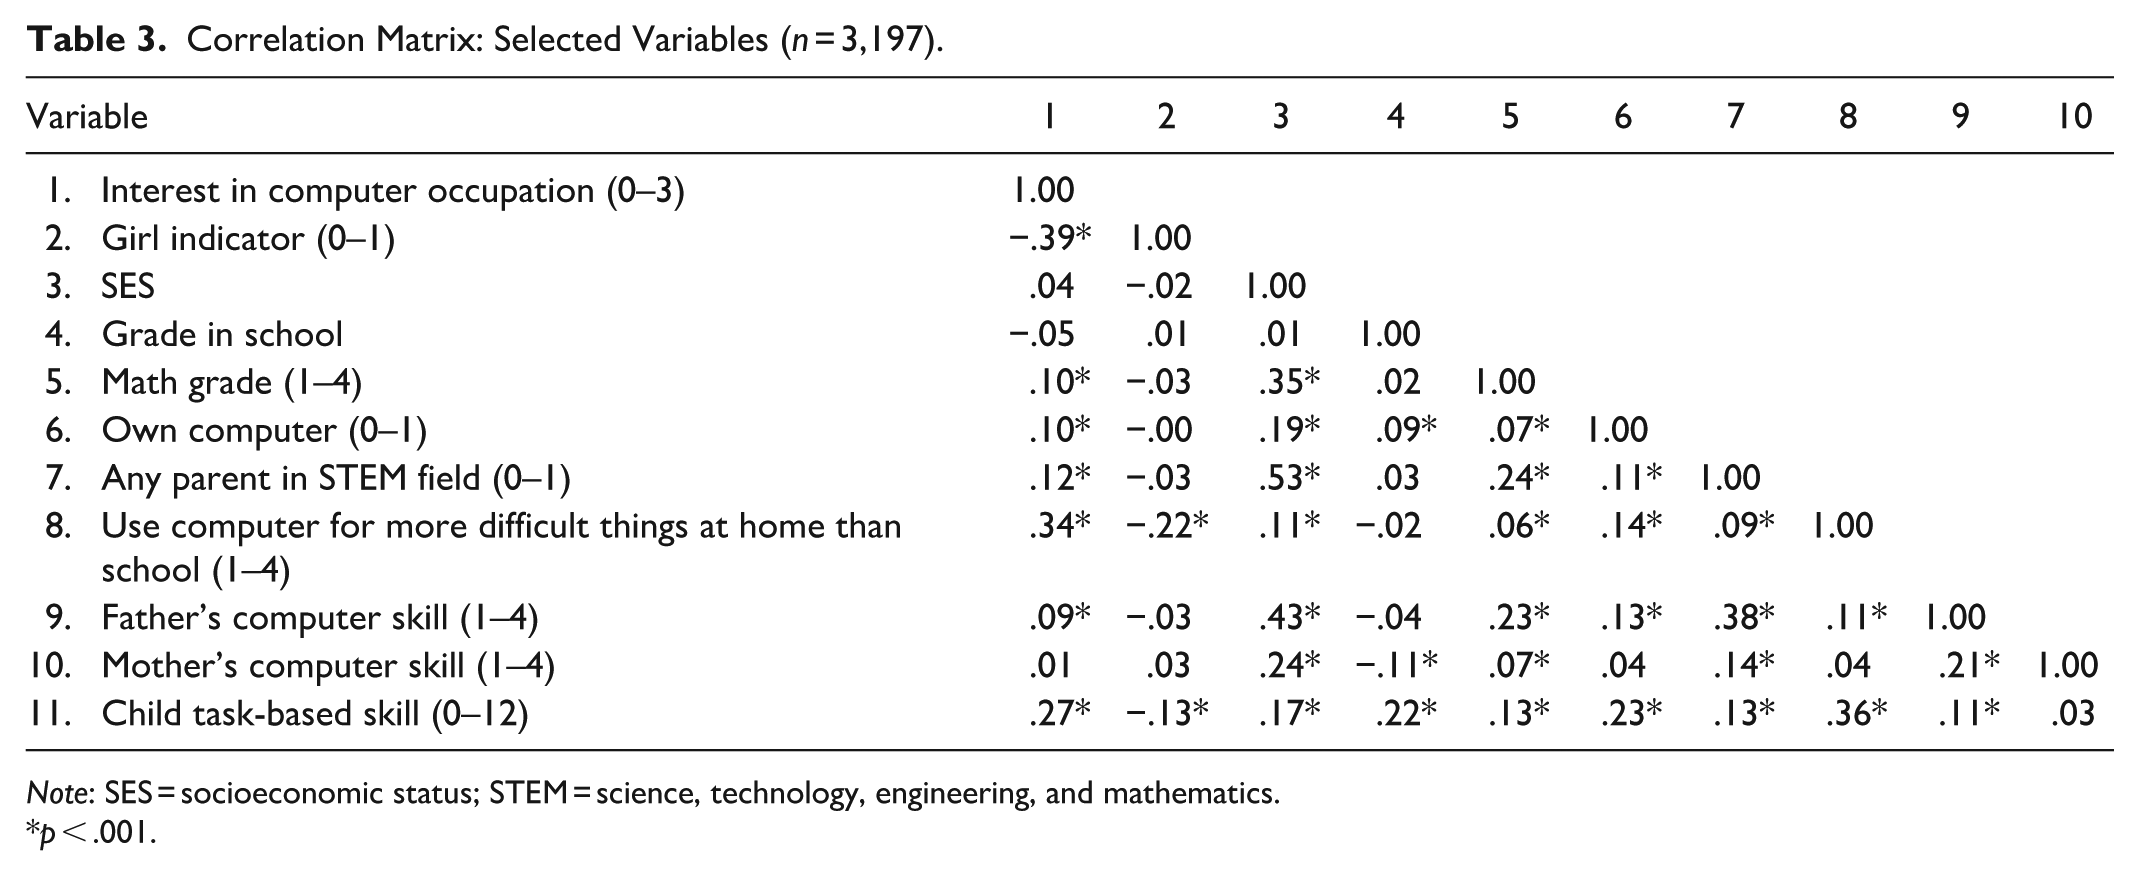
Bivariate correlations for the major variables of interest are shown in Table 3. Child interest in a computing occupation is positively correlated with SES (r = .04), but parent STEM status is more closely associated (r = .12). Challenging learning environments at home (r = .34) and student tech skills (r = .27) are more strongly correlated with the dependent variable than parent occupation. Father’s (r = .09), but not mother’s, tech skills are significantly correlated with child interest.
Correlation Matrix: Selected Variables (n = 3,197).
Note: SES = socioeconomic status; STEM = science, technology, engineering, and mathematics.
p < .001.
Interest in a computing occupation is significantly correlated with gender, math grades, computer ownership, having a parent in STEM, using the computer for more challenging things at home than school, father’s computer skill, and child perceived skill. Challenging computer learning in the home has similar correlation with SES (r = .10), parent STEM status (r = .09), and father’s tech skills (r = .11). In addition, our measure of challenging home learning environments is much more strongly associated with child’s perceived tech skills (r = .36) than with math grades (r = .06).
Multivariate Regressions
To evaluate how SES, parent computer knowledge, and home practices are associated with child interest in computing occupations, we use ordered logistic regression analysis (Table 4). In the constrained model (1), the independent variables account for 7 percent of the overall variance in child computing interest. SES is positively and significantly associated with interest in computing occupations before controlling for math grades and computer ownership, partially confirming hypothesis 1. When it comes to race, Latino and Asian American children show a greater interest in computing than White children, the referent category. Comparing models 1 and 2, the effect of SES is no longer statistically significant when variables are added that are typically associated with higher SES (math grades and computer ownership). Child computer ownership increases the odds of moving into a higher category of interest by 45 percent when the other variables in the model are held constant. Children with their own computers may engage in more self-directed learning and more use overall though it is perhaps similarly likely that parents respond to child interest in computers by lending or purchasing for this specific purpose. For every additional letter grade reported in math, the odds of having more interest increases by 20 percent.
Ordered Logistic Regression of Interest in a Computing Occupation.

Note: Odds ratios are presented. Interest in a computing occupation is coded 0 = “not at all,” 1 = “a little,” 2 = “somewhat,” and 3 = “very.” All models include controls for cell phone ownership, game console ownership, and school. SES = socioeconomic status; STEM = science, technology, engineering, and mathematics.
p < .05. **p < .01. ***p < .001.
Turning now to the effect of home environments, the parent STEM indicator is added in model 3 and increases the odds of additional child interest by 53 percent, confirming hypothesis 2, though notably the pseudo-R2 value remains low (.08). The effect of SES on the dependent variable is also now significantly negative. Higher math grades and computer ownership remain significant indicators of computer interest. In model 4, our measure of computer learning at home increases the chance of additional interest by 61 percent, and the pseudo-R2 value increases to .10. Tested separately (not shown), the effect does not differ by child gender. With the addition of child-reported parent computer skill in model 5, STEM status and learning computing at home continue to be significant indicators of child interest in computing. This confirms hypothesis 3. The child self-reported tech skills measure in the final unconstrained model is significant and does not substantially change the effect of the other variables pertaining to home environments and parent computer knowledge. This supports hypothesis 4. Notably, higher SES children in the final model are 17 percent less likely to report interest in computing, a finding which does not support hypothesis 1.
The explanatory power of the independent variables in the models remains somewhat low (11 percent). Measures that may have explained more of the variance in the dependent variable, the value that children place on various occupations or their exposure to occupational information, were not included in the survey (Wigfield and Eccles 2000). Perceived computer skill and attitudinal measures that tend to be associated with interest (confidence in ability to learn computing) explain an additional 6 percent of the variance in the dependent variable and do not significantly change the effect of the main variables of interest. (See Appendix A, Table C, for a model that includes these measures.)
The predicted probabilities for the unconstrained model were then assessed. With the rest of the independent variables held at their mean values, the probability of a child indicating that they are “very interested” in a computing occupation is 10 percent. Although having a STEM parent increases this probability to 11.7 percent, setting the home learning measure to the maximum value—that it is “very true” that they do more challenging things with a computer at home—increases the probability of answering “very interested” to 17 percent.
Discussion
The growing importance of digital technology and the persistence of unequal participation in CS motivated the present examination of child interest in computing paths. As tech learning takes place in both public and private spaces, we explored the degree to which interest is associated with SES, parents and home learning. Although our methodology does not allow causal inferences and we are constrained by single item measures, we find more evidence for occupational inheritance than social reproduction. Parent STEM status, child-reported parent computer skill and challenging tech learning at home appear to be stronger influences than factors associated with SES, academic performance in math and owning a computer, though each appear to provide additional beneficial conditions for increased computing interest. Although large gender differences remain, and our measure of child perceived tech skill is influential in the models as well, our results suggest that interest is associated with parents and home environments which facilitate tech learning beyond school.
Our results suggest that the domain-specific resources STEM parents possess have more influence on child computing interest than the resources SES alone provides. This supports other recent scholarship on home tech patterns (Casarez and Grant 2024; Mollborn et al. 2022; Steinberg, Mollborn, and Pace 2024) and extends work linking parents’ information technology skills and STEM employment to more supportive or informative activities (Chen, Rothwell, et al. 2024; Dabney et al. 2016; Dou et al. 2019). This could also entail exposure and investigation of occupational pathways, more plentiful and relevant out-of-school learning opportunities to scaffold and reinforce interest, and advanced technology, especially that which facilitates autonomous student learning at home.
As more challenging home computing practices may be motivated by prior student interest and our study is limited by self-reported measures of skill our results cannot rule out the possibility of reverse causality. It may be the students themselves, not parents, who are initiating, generating or engaging in computer learning practices that maintain interest. In this case, the advantage of STEM parents could be the discernment and validation of generative interests. Device use can appear to stem from private choices and affinities, making it difficult to anticipate child needs in the current environment. But a considerable advantage may be associated with parents who manage the fine line between tech monitoring, communication, and continual child learning. Although our data are limited by our measures of parent occupation, we speculate that children may also benefit from their parents’ social networks which facilitate access to role models and peers which may support enthusiasm (Gallup 2023; Riegle-Crumb and Moore 2014). Such environments may encourage children to spend their time in ways that are more generative in computing paths in comparison with other children. Resources associated with SES, such as academic performance and tech devices, on the other hand, may not translate into favorable conditions for the development of computing aspirations. Parents who have more familiarity with STEM and digital technology may be more likely to develop routines and habits that stimulate child interest in devices but also engage in patterns of discourse and interaction that build cultural capital, a significant advantage that signals authentic computing interest to others.
Our findings support scholarship by Jonsson et al. (2009) and others showing that social reproduction is structured more by the social circumstances associated with family background rather than human capital alone, or resources and cultural tastes associated with higher SES. Our results suggest that across social classes, few parents find themselves in the complex circumstances that facilitate device use that is generative in computing paths while also managing traditional coursework and the myriad of distractions that such technology can enable (Bonanati and Buhl 2022; Moote et al. 2020).
Notably, we find a negative relationship between SES and child interest in computing. Alongside resources such as income, devices, and time, the cultural aspects of class—attitudes and practices associated with class habitus—may play a significant role in computing interest (Bourdieu 1984). The enjoyment and enthusiasm for computing may be especially influenced by the attitudes and practices around digital technology in the home. Recent evidence suggests that idealized parenting discourse leads families across social strata to adopt screen-time rules but that the meaning of such limits varies considerably (Grant 2023, 2024; Steinberg et al. 2024). When middle and upper class parents implement screen-time rules, they may engage in more intensive monitoring of child screen time (Grant 2023, 2024). Children in such circumstances may have less independence using devices which could bring less enjoyment, engagement and interest in computing. Some forms of device sharing in the home may also develop uses and play that facilitate conversations and closer relationships (Grant 2024), and device sharing may be more common in lower SES families when technology is limited.
In addition, robust family communication patterns are linked to more frequent STEM-related conversation during childhood and, in turn, stronger child identification as a STEM person, regardless of SES background (Cian et al. 2022; Dou et al. 2025). Similar processes could be at work when it comes to computing. Some of the digital monitoring practices in middle-class families may stress relationships between parents and children and lower enjoyment of digital activities (Steinberg et al. 2024). For example, in comparison with lower SES children, higher SES children report lower levels of enjoyment when engaging on social media and playing games on consoles (Rideout and Robb 2019).
If the present study were done again today, we may not find the same distinction in home practices among non-STEM families and STEM families. Our data were collected in 2015 and 2016, prior to the large language models and artificial intelligence (AI) we know today. Although more likely to be confined in families, subcultures and schools in the period of study, computing interest may be facilitated by the curated curriculum that some AI offers such as more personalized learning experiences, continually adapting to student needs, learning styles and information. Students in well-resourced schools may be more likely to access AI curricula that incorporate ethical and societal implications as well (Zhang et al. 2023). Although the implementation of surveillance systems aimed at limiting certain kinds of AI use could also make school more punitive for some students (Tufekci 2022), the lifelong learning companions and virtual mentors perhaps more readily available in higher SES families may connect all levels of schooling in and beyond the classroom, thus unlocking information and skills sets (Bankins et al. 2024; Hasse et al. 2019). Future work evaluating how AI affects child learning ecologies and digital divides would be well served (Joyce et al. 2021).
The gender difference in computer aspirations did not change substantially with the inclusion of the various measures of advantage in our study. As Steinberg et al. (2024) found, gendered logics around family screen-time implementation can advantage boys in terms of their tech confidence. Such efficacious orientations benefit boys’ motivations and learning in tech paths over those of girls. This is congruent with ongoing research showing that despite more high schools offering foundational CS courses, the gender difference in enrollment has remained substantial, with boys currently twice as likely as girls to take them (Code.org et al. 2023; Klein 2023).
Our results suggest that child enthusiasm toward digital technology is generally high regardless of social class and perhaps associated with different mechanisms. This highlights the importance of school cultures that have broader definitions of digital literacy, as they may emphasize the meaningful student tech experiences that come from different learning spaces. Like some parents, some teachers and administrators routinely assert the message that some forms of digital play are irrelevant or in conflict with academic paths. Consequently their students may learn to see such practices as separate from their academic progress and be denied transformative cultural capital. Children who develop habits at home have the potential to engage other students who have less generative experiences. As Rafalow (2020) pointed out, digital creativity is a portal into student lives that can be leveraged to benefit all students, especially as efficacious learning is essential as technology advances. In the current landscape of near ubiquitous technology yet limited formal tech curricula, exposure, experimentation, and assistance with effort regulation may be a considerable advantage (Grant 2023; Mollborn et al. 2022; Puckett 2022a). Instead of school districts exercising top-down decision-making, more equitable school technology plans have the potential to engage the community in more democratic dialogue about what tech means, how it is used, who it serves (Chang 2019).
Limitations and Future Work
Although our study may shed light on the relationship between computing interest, SES and home learning environments, there are likely several additional influences. All respondents in our study had basic computer classes available to them at school, but we are not able to account for access to out-of-school opportunities such as after school clubs, summer camps or participation in makerspaces. Some research has shown that greater availability of computer classes is associated with stronger interest and some of the students in our survey likely had more options than others (Gallup 2023; Gallup and Amazon 2021). Perhaps not surprisingly, recent evidence suggests that computing classes outside of school are influential in STEM paths more broadly (Caspi et al. 2023; Chen, Rothwell, et al. 2024; Liu and Schunn 2020). This prevents us from distinguishing between the more domain-specific resource advantages and cultural advantages that may shape interest in computing.
Student-reported measures such as those included in our survey are subject to potential biases. For example, less skilled students may not focus on core computing skills and may thus over- or underestimate the extent to which their parents possess them. There is also some evidence that mothers more often monitor child use of digital devices and screen time than fathers, especially those who practice intensive parenting (Casarez and Grant 2024; Mollborn et al. 2022; Steinberg et al. 2024). If this is the case, any relationships affected by the tensions which emerge around screen time could potentially affect child estimation of parent skill. Fathers who do not monitor child use may be subject to less scrutiny of their tech skills overall in comparison with mothers. Including parent self-reports and concrete measures of parent skill would likely provide more accurate data on the relationship between parent skill and child tech practices.
We evaluate only conscious interest and do not have the measures needed to assess student knowledge of computing occupations. Research that further identifies and discerns the processes by which children develop and sustain interest in computing would provide an improved understanding of the current computer education learning ecology in the United States.
Conclusion
Motivated to better understand the process by which children develop interest in computing paths, in this study we compared the effect of SES background and domain-specific knowledge on middle school students’ enthusiasm for computing jobs. Although children from higher SES backgrounds appear advantaged in terms of academic performance and access to computers, child interest in computing pathways is associated with learning computing in the home and parent skill. Parent occupational knowledge appears correlated with more generative home learning practices, perhaps a unique limitation given the socially embedded characteristics of the digital divide. As humans and digital technology become more intertwined in socialization, communities, politics and the economy, the need grows for more voices and perspectives in the rooms where critical decisions are made about design and implementation. To this end, research should continue to evaluate efforts that bring relevant and engaging computer learning to more children.
Supplemental Material
sj-docx-1-srd-10.1177_23780231261415954 – Supplemental material for Unequal Pathways: Family Background and Youth Computing Aspirations
Supplemental material, sj-docx-1-srd-10.1177_23780231261415954 for Unequal Pathways: Family Background and Youth Computing Aspirations by Jennifer M. Ashlock and Zeynep Tufekci in Socius
Footnotes
Acknowledgements
We are extremely grateful to Miodrag Stojnic for significant contributions to this project. We also wish to thank the editor and the three anonymous reviewers whose comments and suggestions helped to improve and clarify the manuscript.
Authors’ Note
Any opinions, findings, and conclusions or recommendations expressed in this material are our own and do not necessarily reflect the views of the National Science Foundation.
Funding
The authors disclosed receipt of the following financial support for the research, authorship, and/or publication of this article: This study is part of a larger project, “Beyond the Deficit Model: Gender Schemas, Computing Preferences and I.T. Career Choices,” funded by the National Science Foundation (grant 1203234).
Supplemental Material
Supplemental material for this article is available online.
1
See Appendix A, Table B, for more information.
2
A basic advantage over other measures, when children are respondents, is that responses should be less prone to error. Our home crowding measure is a summary measure consisting of number of people per bedroom, per bathroom, and shared bedroom or not. The weights for these components are determined through principal components analysis.
3
Additional information about the construction of the SES measure is available upon request.
Author Biographies
References
Supplementary Material
Please find the following supplemental material available below.
For Open Access articles published under a Creative Commons License, all supplemental material carries the same license as the article it is associated with.
For non-Open Access articles published, all supplemental material carries a non-exclusive license, and permission requests for re-use of supplemental material or any part of supplemental material shall be sent directly to the copyright owner as specified in the copyright notice associated with the article.