
Abstract
Student visa holders reflect a large and growing share of the higher educated immigrant population. Although historically considered legally protected, student visa holders’ current precarity raises important theoretical questions about their incorporation. Yet we know very little about student visa holders’ legal status trajectories over time, which is important if we are to understand their opportunities for social and economic incorporation. Using longitudinal data from the National Survey of College Graduates, and multidecrement life table methods, the authors find that half of foreign-born students remain in the United States after 10 years. Yet students have limited transitions to lawful permanent residence. Indian student visa holders are among the least likely to transition to permanent residence. The authors attribute this pattern of “delayed legal status incorporation” to immigration policies, which increase permanent residence wait times for individuals from high-sending countries such as India. More broadly, the authors argue that these results reflect a mismatch between the policy intentions of the “temporary” student visa program and students’ real intentions to stay in the United States long term. The authors discuss the implications of this mismatch for this growing share of young people who are in high demand in the high-skilled labor market, but who face limited pathways to permanent residence.
International students have historically been considered a relatively privileged migrant group. Unlike undocumented immigrants, who have faced punitive enforcement policies since the 1980s, international students have been welcomed to study in the United States since 1952. In fact, a record high of 1.5 million students received F1 visas in 2023. Unlike undocumented immigrants, international students are granted one to three years of work authorization after graduation; they are permitted to bring dependents with them; and they are not barred from pursuing pathways to citizenship. But unlike immigrants with employment visas, family reunification, or humanitarian claims, international students lack a direct pathway to citizenship themselves. This is because students are legally considered “temporary nonimmigrants,” and they are expected to return home after their studies have concluded. But a recent estimate indicates that nearly half (41 percent) of international students stay in the United States (Economic Innovation Group 2024). Among those who stay, there is large variation in their legal status attainment, whether they marry U.S. citizens or permanent residents and stay in the United States through family reunification or they transition to temporary employment visas with the hope of later acquiring employment-based permanent residence (Hazen and Alberts 2006; Jacobs 2019; Van Hook and Zhang 2011). The ability to acquire permanent residence, otherwise known as a “green card,” is vital for immigrants to secure opportunities across educational, labor market, political, social, and marital domains of life (Asad and Clair 2018; Cebulko 2014; Kreisberg 2023). And more generally, immigrants’ own legal status attainment (e.g., progressing from a visa to a green card and then citizenship) influences their socioeconomic and political incorporation, as well as the incorporation of future generations (Grogger and Hanson 2011; National Academies of Sciences, Engineering, and Medicine 2015; Patler and Pirtle 2018; Glick and White 2003).
Yet to date, we lack much of any research on student visa holders’ legal status trajectories once their student visas lapse. This is a critical omission for several reasons. First, sociologists have long been concerned with structural constraints to immigrant integration (Hsin and Reed 2020; Lai, McAvay, and Safi 2024; Naseh et al. 2023). International student visa laws could represent one kind of structural constraint on immigrant integration (Economic Innovation Group 2024; Ruiz and Budiman 2018). In addition, this is important for U.S. higher educational institutions, who rely on international students for their tuitions; as well as for the labor market, given that science, technology, engineering, and medicine (STEM) industries rely on international student graduates to obtain worker visas and fill jobs in highly specialized fields (Association of American Universities 2024; Boundless 2025). Finally, this is critical in 2025 more than ever given the fact that student visa holders find themselves at the center of anti-immigrant policies targeting them for deportation, arrests, and new visa denials.
In this study, we use longitudinal, restricted data from the National Survey of College Graduates (NSCG) to ascertain student visa holders’ legal status trajectories over time. Using multidecrement life table methods, we confirm that as many as half of foreign-born students stay in the United States for 10 years or more, consistent with prior research (Economic Innovation Group 2024). Despite this, relatively few transition to permanent residence, or green cards. Indian student visa holders, a group that makes up a larger share of student visa holders than students from any other country, are among the least likely to transition to permanent residence. We call this pattern “delayed legal status incorporation,” and we suggest that delays among Indians can be attributed to immigration policies which increase permanent resident wait times for individuals from the highest-sending countries. In other words, there is a mismatch between the policy intentions of the “temporary” student visa program and students’ own tendencies to stay in the United States long term. Given that these results precede the presidential administration in 2025, we can speculate that delayed legal status incorporation will only increase under subsequent historical moments of legal and social precarity. We discuss the implications of this structural barrier to legal status incorporation for a growing share of young people, who are in high demand in the high-skilled labor market, but who face limited pathways to permanent residence.
The Role of Law in Immigrant Incorporation
The immigration literature has long sought to explain variation in immigrant incorporation, or the ability for immigrants (and their descendants) to create a fulfilling life in their resident society, including but not limited to their social, cultural, and political inclusion, as well as their socioeconomic, residential, and health mobility (Bolt, Özüekren, and Phillips 2010; Derose, Escarce, and Lurie 2007; National Academies of Sciences, Engineering, and Medicine 2015). Of course, there are myriad constraints immigrants face when it comes to incorporating into their host countries. One major constraint is the role of immigration law. This is because immigration laws sort immigrants into certain legal status categories, which directly dictate immigrants’ rights to access institutions which affect incorporation, such as work, educational, and health care rights (Derose et al. 2007; Gonzales 2011; Kreisberg 2019).
Because of this legal status variation, immigration scholars typically compare inequality in incorporation across several broad legal status categories, including “lawful” but not yet permanent residents, permanent residents, citizens, and undocumented immigrants. This is because, broadly speaking, immigrants’ rights are stratified according to these broad categories (Joseph 2025; Kreisberg 2019). But there is also variation among lawful but not yet permanent residents: between those who are considered “permanent immigrants” and those who are considered “temporary nonimmigrants.” Whereas “permanent immigrants” have pathways to permanent residence because they are presumed to stay in the United States permanently, “temporary nonimmigrants” lack those pathways because they are presumed to leave the United States after a short period of time. We explain these two categories, and the subsequent disconnect between presumptions about their permanence and immigrants’ realities on the ground, below.
Permanent Immigrants
First, since the Immigration and Nationality Act of 1965, lawful immigration to the United States has been allocated into four permanent pathways of admission: family reunification, employment, the diversity visa (which operates on a lottery to encourage migration from underrepresented countries to the United States), and humanitarian pathways. Crucially, these four pathways are the only means through which immigrants can acquire permanent residence and then later citizenship. And once immigrants acquire permanent residence, their rights and resources change dramatically. They have a much lower likelihood of deportation, they can sponsor relatives from abroad, and after five years, they can apply for citizenship. Of course, permanent residence is precarious since the criminalization of Latin American migration in the mid-1990s increased their deportation (Asad 2020). As Cebulko (2014) noted, “Although less precarious than an undocumented or liminally legal status, legal permanent residence is still precarious” (p. 159). Nonetheless, permanent residents still have better outcomes than undocumented immigrants across educational, labor market, political, social, and marital institutions (Asad and Clair 2018; Kreisberg 2023; Menjívar 2006; Menjívar and Abrego 2012).
Temporary Nonimmigrants
Those considered “temporary nonimmigrants,” by contrast, were not merged into the 1965 Act preference system at all. By legal definition, nonimmigrants lack a pathway to permanent residence. International students fall into this “nonimmigrant” category. The intention behind these “nonimmigrant” visas was for individuals to migrate to the United States temporarily, either for school or work, and then return to their home country. This is of course problematic given that individuals with nonimmigrant visas actually stay in the United States. For example, 60 percent of F-1 visa holders seek other nonimmigrant statuses once their studies conclude, the majority for H-1B employment visas (USCIS 2019). Furthermore, the U.S. Department of Homeland Security Yearbook of Immigration Statistics reveals that just over half (52 percent) of all lawful permanent residents (LPRs) in 2023 were already present in the United States when they adjusted status (U.S. Department of Homeland Security, Office of Homeland Security Statistics 2024).
Even though student visa holders are considered “nonimmigrants,” there is a burgeoning body of work examining their immigrant incorporation. Students have restricted work opportunities as a function of immigration law, which can affect their networking, work experience, and economic incorporation (Im, Cahn, and Mukherjee 2025; U.S. Immigration and Customs Enforcement 2024a). Besides these legal constraints, student visa holders often face social isolation because of language barriers, culture shock, and discrimination (Lee and Rice 2007). These hardships can have implications for students’ mental health, as social support satisfaction and social connectedness are found to be predictors of acculturative stress among international students (Yeh and Inose 2003).
Meanwhile, the sociological research that measures the legal status incorporation of students, or how many students stay in the United States and on what kind of visa, is thin. Current data show that 41 percent of bachelor’s, master’s, and doctoral degree graduates combined remain in the country long term, even though they are on nonimmigrant visas (Economic Innovation Group 2024; USCIS 2025). These estimates preclude understanding of what legal status those 41 percent of students hold after their original visas lapse. In addition, these estimates rely on cross-sections of immigrants, preventing us from understanding how real cohorts of immigrant students progress over time in terms of their legal status, if indeed they stay in the United States at all (Institute of International Education 2024; USCIS 2024a). Analyzing student visa holders’ legal status trajectories therefore illuminates the possibility of a mismatch between the intentions of the student visa program and students’ real intentions on the ground.
Why the Student Visa Policy-Reality Mismatch Matters
Illustrating the disconnect between the intention and reality of the student visa program is important for several reasons. First, even though student visa holders are intended to be temporary, our analysis can reveal how many foreign-born students stay, with what status, and from which countries. Immigration policies currently place caps on the numbers of LPRs the United States can allocate per year per country of origin (7 percent per country). This policy places a high burden on immigrants from countries which send large numbers of immigrants, such as Mexico, China, and India. Immediate relatives of U.S. citizens are exempt from this cap. But everyone else, even individuals who have a path to a green card, must wait anywhere from 1 to 15 years to get their green card approved (Bier 2017, 2019; Roberts 2021; U.S. Department of State, Bureau of Consular Affairs 2024; Vijayakumar and Cunningham 2019; World Population Review 2025). Given that there are direct associations between a green card status and access to immigrant incorporation across outcomes, our knowledge on the prevalence and progress of students to acquire green cards, by region of origin, has huge implications for understanding these broader policy constraints. Also, there is an increased reliance by the state on other precarious nonimmigrant statuses, from Temporary Protected Status to Deferred Action for Childhood Arrivals (Orrenius and Zavodny 2025). As such, the trajectories of student visa holders can help illuminate the study of other immigrants in legal liminality (Menjívar 2006).
Analyzing student visa trajectories is also important because any disconnect between the intention and reality of the student visa program has practical implications on the enrollments, and solvency, of higher education. The majority of students on F-1 visas attend colleges for bachelor’s and master’s programs, with smaller shares pursuing doctorates and professional degrees, and one-fifth engaging in practical training programs after graduation (Wilson 2025; U.S. Immigration and Customs Enforcement 2024b). Although China and India have long been the two countries sending the largest shares of student visa holders, constituting more than half the total, over the past few decades, the composition of international students has shifted. Indian students have recently grown to the largest share of international enrollments in the 2023–2024 academic year, surpassing Chinese students for the first time since 2009. These student enrollments are vital to maintaining the solvency of higher education, as they pay higher tuitions and contribute billions to the U.S. economy (Association of American Universities 2024).
Evaluating the disconnect between policy intentions and students’ realities also has implications for U.S. employers, which would benefit from fewer barriers to hiring students after graduation. As previously mentioned, international students do not have their own unique pathway to permanent residence. Instead, students are largely limited to adjusting to permanent residence via family reunification claims or employment visas (Jacobs 2019; Jasso et al. 2005; Hazen and Alberts 2006; Wadhwa, Saxenian, and Siciliano 2012). Although temporary work visas hold opportunities to become permanent, they are often initially tied to single employers, and immigrants who hold them have lower wages than their comparably trained permanent resident and citizen peers (Hira 2018; Huang and Anderson 2019; Lowell and Avato 2014; Orrenius and Zavodny 2015). Employers face real financial and administrative barriers when attempting to hire foreign-born students without green cards. And students themselves feel a high amount of “visa stress” when attempting to transition their student visas into temporary employment visas (Jacobs 2019; Jasso et al. 2005). Of course, these estimates are limited to cross-sectional data and particular industries. But for employers who regularly call on the state to increase foreign labor certifications—and call on the media to lobby for more international worker talent more generally—their legal status trajectories have huge implications for the labor market and broader economy.
To be clear, foreign students have always faced uncertainties in their status. They have been more vulnerable than green card holders and citizens because of their temporary status and individual responsibility over deciding how to stay in the United States long term. Yet this point has become especially salient in recent months as the rules for living and working the country have changed overnight (Chishti and Bush-Joseph 2025). More than half of U.S. states are revoking student visas, and student visa deportations are highly mediated in the U.S. news (Mowreader 2025). And as of September 2025, companies considering hiring students for new high-skilled work visas (called the H-1B) will now face a proposed $100,000 fee, compared with a fee of between $2,000 and $5,000 prior to the administration’s proclamation. Of course, there have always been uncertainties between presidential administrations, especially given the increased reliance on nonimmigrant categories of admission, which makes immigrants in these categories particularly vulnerable to changes brought about through rapidly changing executive orders (Orrenius and Zavodny 2025). This legal uncertainty only amplifies the need to understand student visa holders’ legal status trajectories once those visas lapse.
Methodology
Data and Sample
We use data from the 2010, 2013, 2015, 2017, 2019, and 2021 panels of the NSCG, a biennial, nationally representative survey by the National Science Foundation; 2021 was the latest data year available at the time we performed the analysis. Combined across years, the sample includes 111,715 noninstitutionalized, college-educated participants residing in the United States. Although the NSCG’s questionnaire focuses on people with education and/or employment in science or engineering, its occupation- and field-stratified design includes representative samples of nonscientists and nonengineers with bachelor’s degree or more to allow comparisons across fields. The NSCG is well suited for our analysis because its sample includes foreign-born student visa holders, and it collects retrospective information about visa status and the timing of visa status transitions among those who remain living in the United States. Furthermore, NSCG respondents are followed longitudinally, which allows us to track visa changes prospectively. A prospective analysis can provide a more complete depiction of visa status transitions because it captures changes in visa status even for those who later leave the United States. Longitudinal linkage ID variables, necessary for following individuals prospectively, are available only in the restricted-use NSCG, which we use for the present analysis.
The analytic sample was confined to foreign-born college graduates who first arrived in the United States on nonpermanent student visas at 18 years or older, were living in the United States during the reference week, were 20 to 64 years old, arrived in the country in 2000 or later, and attained at least one U.S. degree (n = 21,594). Because our goal is to examine the transition from student to other statuses, we further confined the sample to those who were enrolled as a student as of their first interview (n = 9,200).
We linked the individuals in our sample across all the survey years in which they appeared (a maximum of four times, or as long as seven years, e.g., 2010–2017), and reshaped the records into person-years, with one record for each year the respondent spent in the United States (n = 32,700 person-years).
Measures
For each person-year, we constructed a time-varying indicator of visa status on the basis of retrospective reports on year of arrival, as well as prospective reports on year of completion of schooling (i.e., year of highest degree), year attained LPR status (if this occurred), and current visa or citizenship status. We classified individuals as occupying one of three statuses: student visa, other temporary visa (e.g., a temporary visa for work), and LPR or naturalized citizen. Unfortunately, we are unable to tell in the data if a person transitions from one student visa to another student visa.
We also attempted to identify those who left the country. The NSCG follows up on respondents up to four times. We treat those who are interviewed four times as right-censored in the year following the fourth interview, but we classify those who are interviewed less than four times as having left the country in the year following the interview. We recognize that this leads to an upper-bound estimate of the number who leave the country, as some people we classified as emigrants may have dropped out of the sample for other reasons. Nevertheless, our estimates align with reports by the Office of Homeland Security Statistics, which calculates that half of foreign students remain in the country after 10 years of residence (Schachter and Rukh-Kamaa 2024). Our estimate is very similar: 51 percent.
We also measured several demographic and socioeconomic characteristics that are hypothesized to be associated with foreign students’ legal status trajectories, including age at arrival (continuous), marital status at first interview (married, single), sex (men, women), highest attained degree as of the last interview (BA, MA, or PhD or professional degree), whether the individual’s highest degree was in a STEM field, 1 and country or region of birth (China, India, other Asia, Canada, Europe, South America, Africa, and Central America and the Caribbean).
Multistate Life Tables
We first assessed whether and how long it takes for student visa holders to transition to LPR status. We also estimated the share of student visa holders who hold other temporary visas before transitioning to LPR status and how long they remain on those temporary visas. To do this, we created multistate life tables. These life tables follow a synthetic cohort of student visa holders for up to 10 years as they move from one status to another. Life tables model transitions from a student visa to another temporary status (s→t), from a student visa to LPR (s→r), from another temporary status to LPR status (t→r), and from all three of these statuses to out of the country (s→o, t→o, r→o), as shown in Figure 1. If a person remains on a student visa for the entire observation period, they are treated as right censored (i.e., as if they never make a transition during the time we observe them).
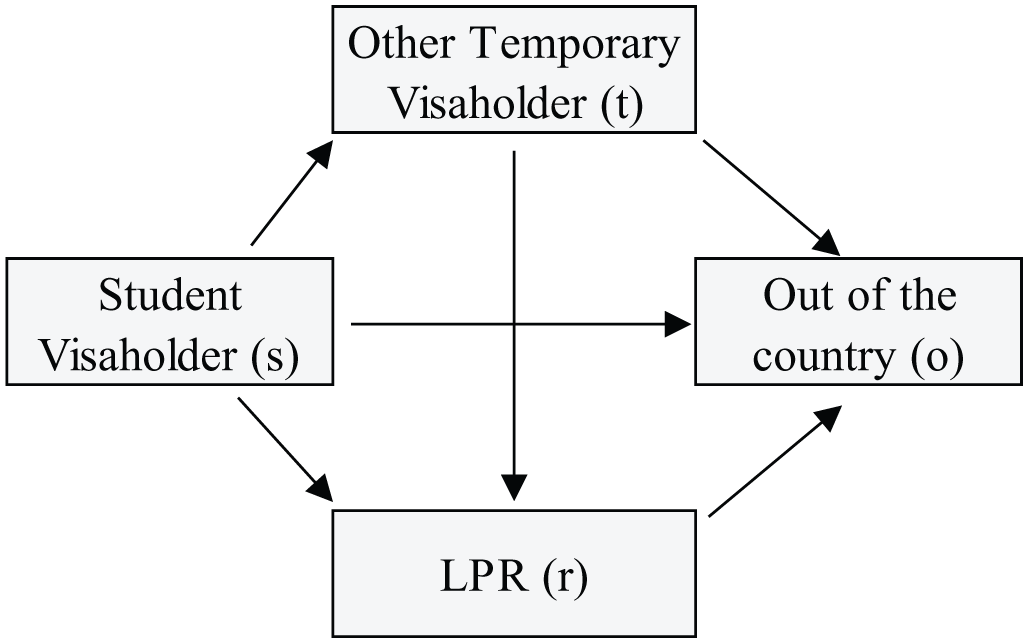
State diagram depicting legal status transitions for foreign students.
The multistate life tables are generated from a set of conditional probabilities of making each of these transitions. We used discrete-time event history models to estimate these conditional probabilities. These models predict the odds of each transition as a function of years in the United States and years squared (to account for nonlinearity) and the demographic factors listed above. We estimated these models only on the person-years when individuals were at risk for making the transition (Allison 2014). For example, for the transition from a student to another temporary visa, the model is as follows:

where pit = 1 if person i has a temporary visa at year t and 0 otherwise, YrsUSit is the number of years spent in the country by person i in year t, and the
Of key importance for our study is that the predicted probabilities generated from these models are equal to the annual probability a person will make the transition, conditional on not having made it in an earlier year. This is directly analogous to the qx function of a life table (Allison 2014). We used Stata’s margin command to generate these probabilities by duration of residence, first for the entire sample while holding the other factors at their means, and then for each group of interest (e.g., women, men, married people, single people) by setting the group indicator to 1 and all other factors at their means. Finally, we used the predicted probabilities as estimates of the qx columns to generate the multistate life tables, following standard demographic methods (Schoen 1988). We produced life tables for all groups combined (see Table A1 in the Appendix) and separately by country or region of birth, highest degree, STEM degree, gender, and marital status. To examine Asian students’ trajectories in more detail, we also generated life tables separately for students from India, China, and all other regions by gender, marital status and STEM degree.
To summarize the life tables, we reported the percentage of foreign students who are modeled to have ever attained LPR (pr), ever held a temporary visa (pt), and were still living in the United States (pUS) after 10 years of U.S. residence. Expressed in life table notation,


and

where l0 is the radix of the life table, that is, the size of the synthetic cohort upon entry to the United States (in our life tables, this arbitrary value is set to 1,000), and d is the number of people in the synthetic cohort making the specified transition between x and x + 1 years in the country. For example, d5,s→t is the number transitioning from a student to temporary visa between five and six years in the United States. Note that pt + pr ≠ pUS, because many people who possess temporary visas and some who attain LPR status subsequently leave the country.
We also reported the average person-years (e) lived in each status within 10 years of first arriving in the United States:


and

where Lx is the number of person-years lived by the synthetic cohort in the specified status between x and x + 1 years in the country. For example, L5r is the number of person-years lived by the synthetic cohort in LPR status between five and six years in the United States, whereby L5r = (l5r + l6r)/2, and l5r and l6r are the number of people in the synthetic cohort with LPR status at five and six years of United States residence, respectively.
It is important to recognize that the temporal patterns depicted in our life tables are derived from models that use a quadratic term on duration of residence (duration and duration squared) to predict transitions to and from each visa status category and out of the country. We selected the quadratic specification because of its ability to parsimoniously capture curvature in the hazard functions. We tested alternative nonparametric models that use single-year duration of residence dummy variables, which yielded substantively similar results in terms of the percentages who held a temporary work visa, attained a green card, or had left the country after 10 years of U.S. residence. Nonetheless, the nonparametric models also show “break points” in which the share in a student visa drops around 2, 4, and 8 years of U.S. residence, likely corresponding with completion of master’s, bachelor’s or professional programs, and PhD programs, respectively. Unfortunately, we were unable to estimate nonparametric models for all subgroups because of limitations in sample size. We therefore opted to present results derived from the quadratic models for both the overall sample and all subgroups. But we return to the discussion of legal status incorporation by degree type (e.g., bachelor’s or PhD) in the discussion.
Results
We begin with a description of our analytic sample in Table 1. Among the international students in our sample, there are more men (60 percent) than women (40 percent) and more married (53 percent) than single individuals (47 percent). Among both men and women, a larger share is married than unmarried. The largest share of students come from India, followed by China, Europe, 2 and Canada. The majority of the sample’s highest degree is a master’s degree (65 percent), and more than half of the sample have STEM degrees (55 percent). Overall, a larger share of individuals had transitioned to a temporary status (62 percent) than to lawful permanent residence or a green card (46 percent) within the 10 years following their arrival to the United States. Keep in mind that many of those who obtained temporary visas, and even some who attained green cards, subsequently left the country.
Descriptive Statistics for the Analytic Sample.

Source: National Survey of College Graduates, 2010, 2013, 2015, 2017, 2019, and 2021.
Note: The sample was restricted to foreign-born individuals who arrived at ≥18 years of age from 2000 to 2021 on student visas and who attained at least one U.S. degree. LPR = lawful permanent resident; STEM = science, technology, engineering, and mathematics.
These legal status transitions can be visualized in Figure 2, which shows the number of people in each legal status category based on the life table’s lx column as well as the remaining size of the synthetic cohort after x years in the country (Table A1). Figure 1 shows that large shares of foreign-born students remain living in the United States for prolonged periods of time. As many as half stay for 10 years or more, far longer than it takes most to complete their studies. Despite these long durations of stay, it is rare to transition to permanent residence, showing evidence of a delay in legal status mobility. By year 5, for example, the share of individuals who remain on student visas is 35 percent, 41 percent have transitioned to different temporary visas (e.g., a temporary visa for work), and only 6 percent have acquired permanent residence. Even after 10 years in the United States, a remarkably small share of students have acquired green cards. Four percent of individuals are still on student visas, 28 percent are on different temporary visas, and about 18 percent have acquired permanent residence.

Visa status by year of U.S. residence among foreign students, life table estimates 2010-2021.
We refer to this pattern as one of “delayed legal status incorporation.” Contrary to common policy rhetoric, which often assumes students return to their home countries for work, these life table results demonstrate that a sizable share of students stay in the United States for prolonged periods of time, simply without the stability of permanent residence. As such, they live in the United States for an extended period of time without the same opportunities for immigrant incorporation in other domains of life as those immigrants on “permanent immigrant” visas that have direct pathways to permanent residence. It is important to note that there is variation in students’ length of stay in the United States by region of origin. For example, students from Central America and the Caribbean, Europe, and South America stay in the United States at high rates, while students from India, China, elsewhere in Asia, and Africa stay at more moderate rates, and students from Canada stay at the lowest rates.
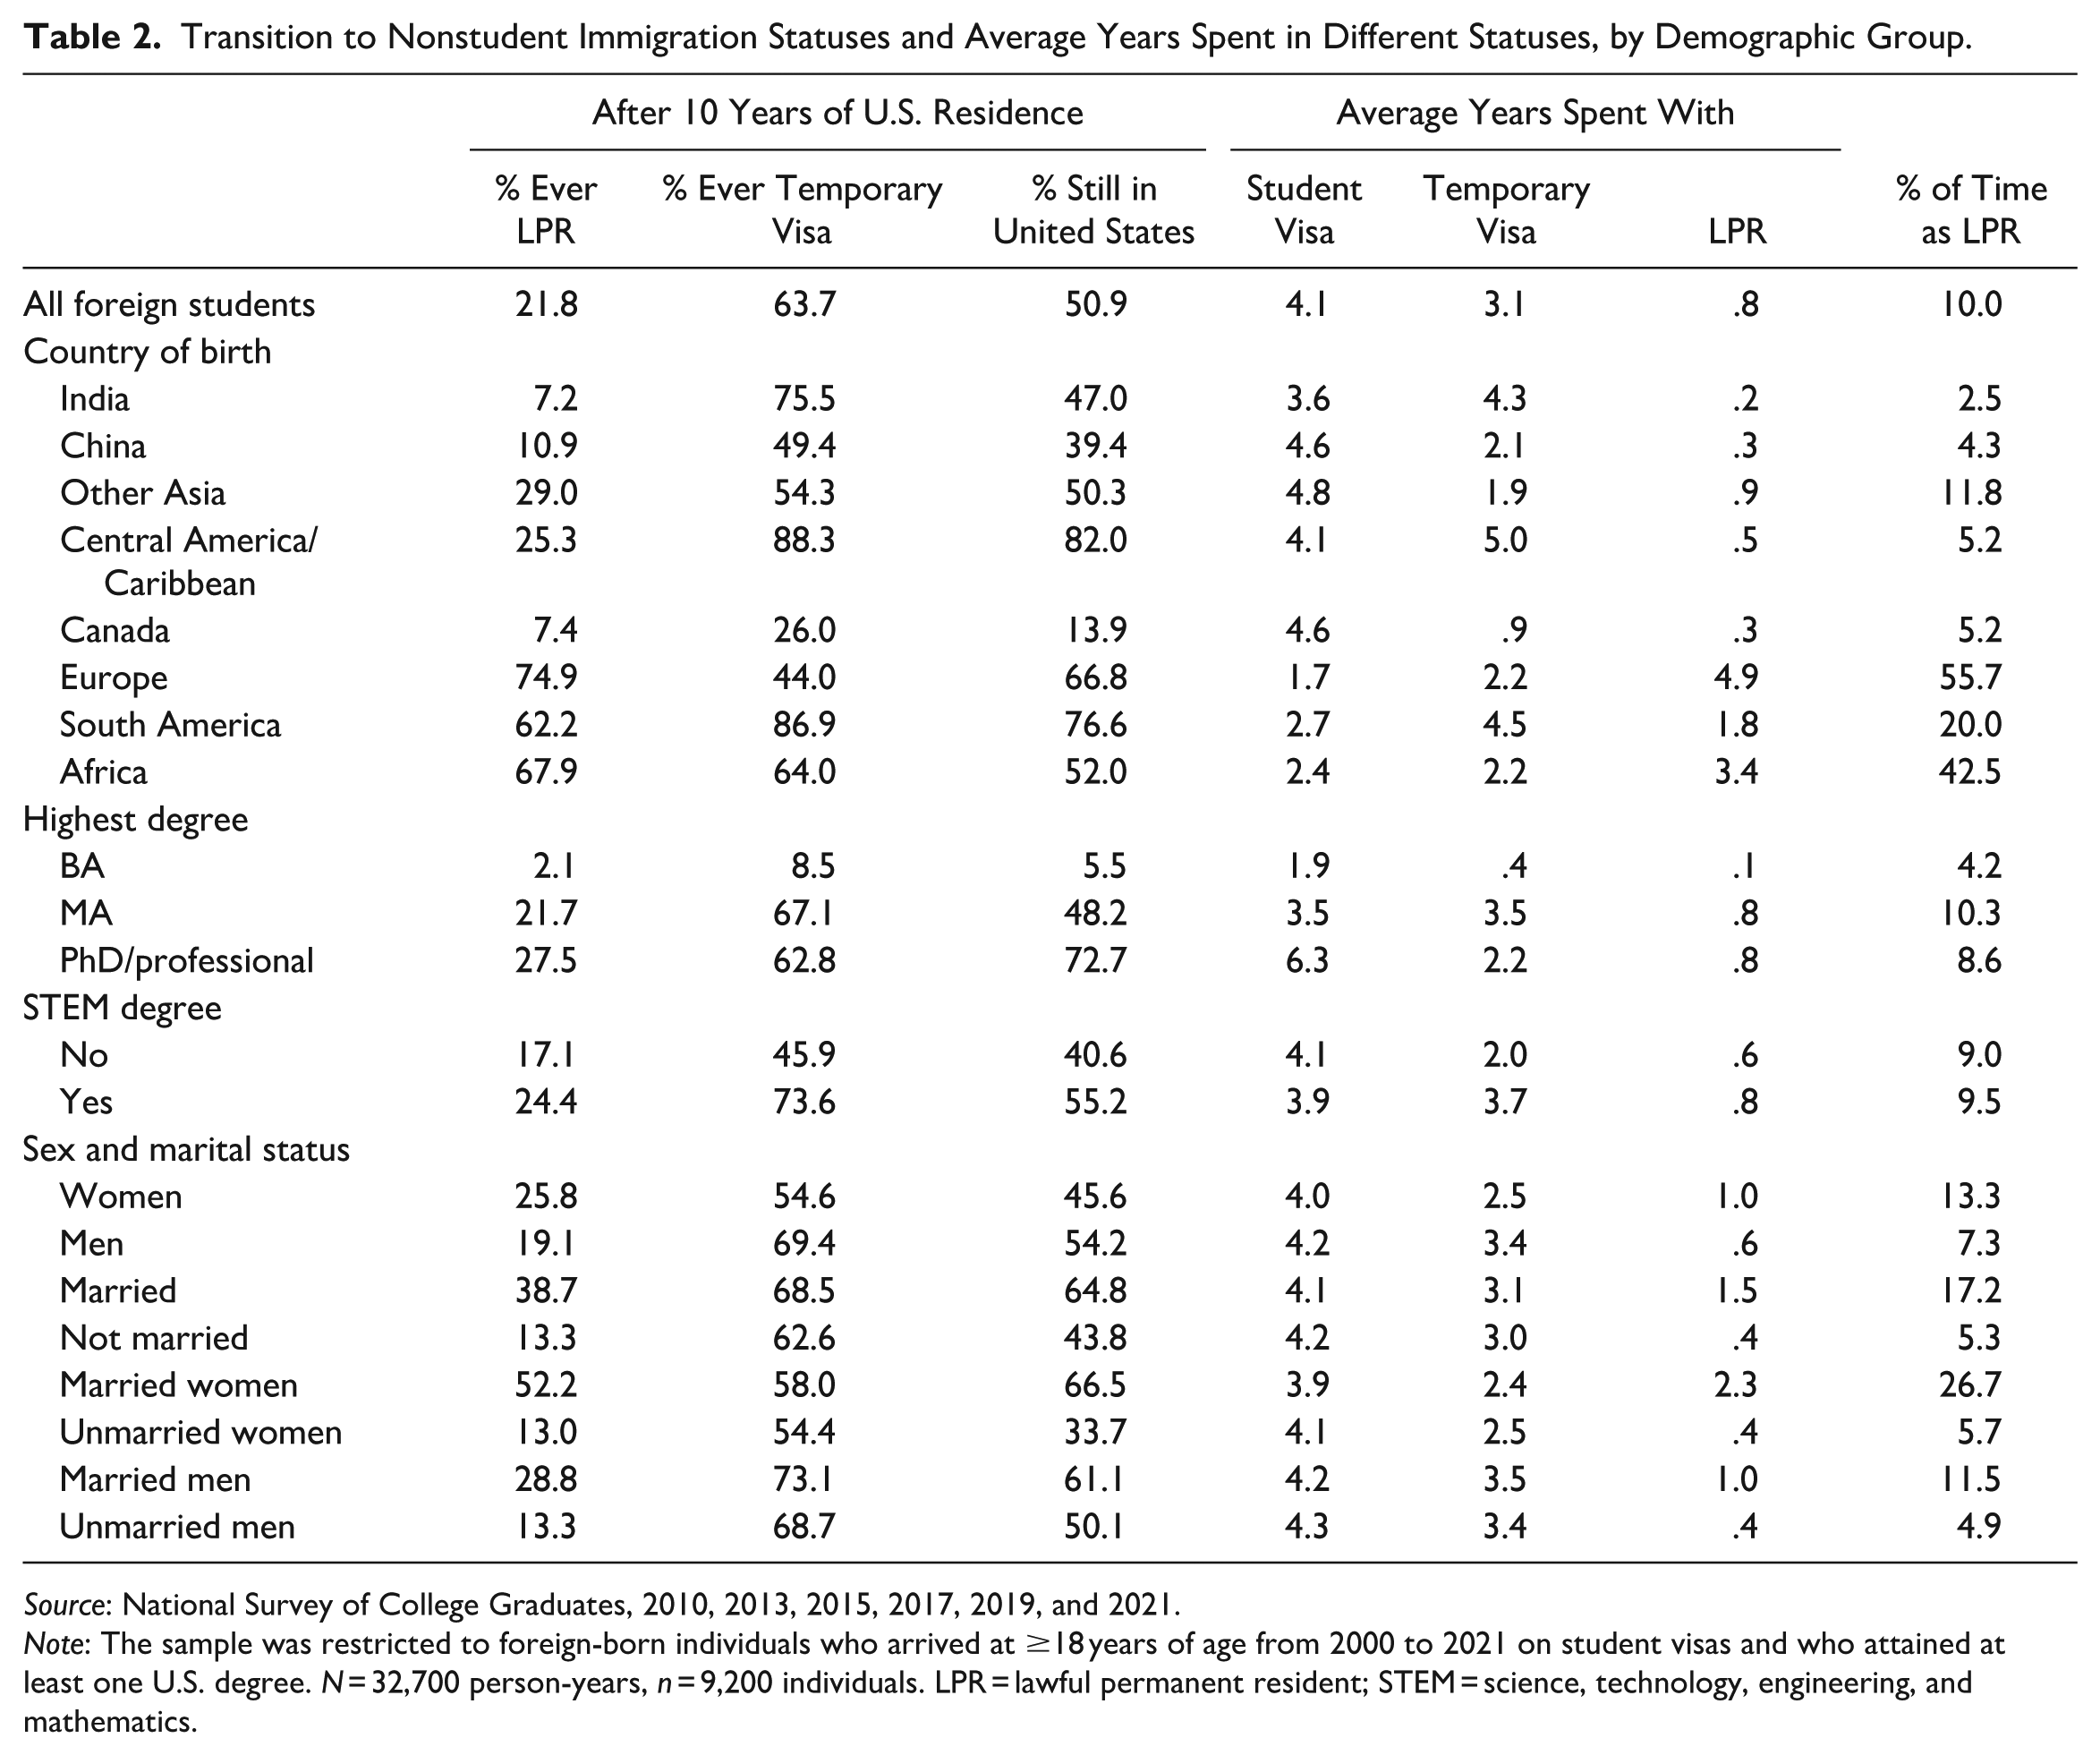
Yet net of this variation in length of stay in the United States, students from Asia, Central America and the Caribbean, and Canada tend to rely much more heavily on student and temporary visas than students from other parts of the world. As shown in Table 2, students from Asia, Central America and the Caribbean, and Canada had even lower rates than average of obtaining permanent residence after 10 years in the country (<30 percent) than those from Europe, South America, and Africa (all >60 percent). And across all groups, Indian students are the least likely to get permanent residence (7 percent) while European students are the most likely (75 percent). Additionally, Indian students spend an average of 0.2 years in permanent residence, or 2.5 percent of their time in the country. By contrast, Europeans spend 4.5 years, or 55.7 percent of their time in the country, in permanent residence. Put differently, even though both Indian and European students stay more than 8 years in the country, Indians are much more likely to hold a temporary work visa (76 percent for Indians vs. 44 percent for Europeans).
Transition to Nonstudent Immigration Statuses and Average Years Spent in Different Statuses, by Demographic Group.
Source: National Survey of College Graduates, 2010, 2013, 2015, 2017, 2019, and 2021.
Note: The sample was restricted to foreign-born individuals who arrived at ≥18 years of age from 2000 to 2021 on student visas and who attained at least one U.S. degree. N = 32,700 person-years, n = 9,200 individuals. LPR = lawful permanent resident; STEM = science, technology, engineering, and mathematics.
As we previously mentioned, green card wait times vary considerably by country of origin. The patterns seen by country or region of birth in Table 2 may therefore be attributable to the fact that high-sending countries such as India experience high demand in the U.S. labor market, yet they also face longer wait times for green cards than low-sending countries. We note that Canadians may be an exception to this pattern. 3
In addition to variation in legal status incorporation by country or region of origin, we also find heterogeneity by educational and marital status. First, those who obtained higher degrees and degrees in STEM fields are more likely to remain in the United States on temporary visas. The ease with which higher educational degree holders, such as master’s over bachelor’s degree holders, transition to work visas could reflect both selection and structural effects. Many master’s students pursue careers in the United States with intentions to stay after graduation (Economic Innovation Group 2024). And employers may favor master’s graduates because of their skill sets, networking skills, and workforce readiness (Mowreader 2025). Even net of degree level, however, there is also variation by degree type. For example, nearly 75 percent of STEM students transitioned to temporary visas compared with just 46 percent of non-STEM students, a 29-point gap. This could reflect the additional 24 months of time that STEM graduates are eligible for to work under what is called “optional practical training,” or the ability for students to work legally off campus in their fields (Wilson 2025). But even given this variation in training extensions, there was less variation in transitions to permanent residence. For example, there was only a 7-point gap in LPR status (24 percent among STEM students vs. 17 percent among non-STEM students). Finally, married women are more likely to transition to permanent residence than singles, a pattern that likely reflects family reunification claims to green cards. As we previously mentioned, one pathway to permanent residence is through marriage, wherein someone on a temporary visa can apply for permanent residence if they marry someone else already living in the United States with existing citizenship or permanent residence.
In sum, we find that Indian students (and to a lesser extent other Asian and Latin American students), non-STEM students, and unmarried students who remain in the United States for at least one decade experience a pattern of “delayed legal status incorporation,” whereby they are dependent on other temporary visas to remain in the United States. We attribute at least part of this delayed pattern to structural constraints that make individuals from countries with the highest flow wait the longest time to adjust their status.
However, visa wait times might not be the only explanation for the low transition to a green card among Indian students specifically, and Asian students generally. For example, it could be the case that Indians are less likely to be married to U.S. citizens, which grants them fewer opportunities for family reunification claims. We assess this possibility descriptively in Table 3, in which we estimate life tables on samples of students from India, China, and other regions separately. We find that Indian married women remain almost as unlikely (14 percent) to ever obtain green cards compared with unmarried women (9 percent). Their low likelihood also holds whether they have STEM degrees (8 percent of STEM graduates ever obtain green cards, compared with 44 percent of STEM students from other regions) or not (19 percent of non-STEM graduates ever obtain permanent residence, compared with 42 percent of non-STEM students from other regions). On the other hand, temporary visa use is especially prevalent among Indian students, with more than 80 percent of unmarried women and married men having held one. We therefore speculate that this pattern of delayed legal status incorporation is one not of demographic composition but of structural constraints, which fail to account for the high demand of student talent amidst our increasingly global exchange of labor.
Transition to Nonstudent Immigration Statuses and Average Years Spent in Different Statuses, by Gender, Marital Status, and STEM Degree, by Country of Birth.

Source: National Survey of College Graduates, 2010, 2013, 2015, 2017, 2019, and 2021.
Note: The sample was restricted to foreign-born individuals who arrived at 18 years of age from 2000 to 2021 on student visas and who attained at least one U.S. degree. N = 32,700 person-years, n = 9,200 individuals. LPR = lawful permanent resident; STEM = science, technology, engineering, and mathematics.
Discussion
These results show that transitioning to a green card for student visa holders is rare. Yet for Indians, who make up the largest share of student visa holder recipients, the transition to a green card is almost impossible. Of course, many Indians still receive permanent residence. From 2013 to 2022, about 10 million individuals were granted permanent residence. Of these, 7.2 percent were born in India. This makes India the third largest group of new-arriving permanent residents (Greene 2024). But it is important that for Indians who first came to the United States on student visas, the likelihood to transition to permanent residence is rare. This low likelihood holds for STEM and non-STEM degree holders alike, as well as for men and women, regardless of marital status. By contrast, Indians rely much more heavily on temporary visas, largely temporary visas for work. We call this pattern one of “delayed legal status incorporation,” and we attribute the delay to structural constraints which, ironically, punish those students most in demand when attempting to stay in the United States permanently (Roberts 2021; Vijayakumar and Cunningham 2019). We suggest that this pattern has important implications for the study of immigrant incorporation, educational and labor market institutions, and immigration policy.
First, this pattern is important for our study of immigrant incorporation because it reveals an inherent discrepancy between the intention of immigration law and the reality of immigrant behavior on the ground. Indeed, immigration law is a major factor in the incorporation of U.S. immigrants. But too often, empirical studies emphasizing this finding rely on categories of “permanent immigrants,” not “temporary nonimmigrants.” Unlike “immigrant” categories of admission, “nonimmigrant” visas are issued to foreign-born residents to enter the country for a specific, short-term reason, such as to study or work temporarily. In accordance with this stated purpose, the U.S. government requires visa applicants to demonstrate an intent to return to their countries of origin at the end of their visit. Yet the foreign-born student visa program clearly functions differently on the ground. It serves both as a recruitment tool for U.S. employers seeking foreign talent, and as a first step in a protracted settlement and legalization process for prospective immigrants. As our analysis shows, even though half of foreign-born students remain in the United States for a decade or more, far longer than it takes most students to complete their degrees, most remain on temporary work visas and relatively few obtain permanent residence or citizenship. The disconnect between the original design of the policy and its current function is manifested by the pattern of delayed legal status incorporation we observe among foreign-born students, particularly those from numerically large national origin groups that tend to exceed the per-country annual caps on green card issuances imposed by the 1965 Immigration Act. This finding is important because it indicates that our current set of laws does not allow the possibility of “nonimmigrants” to stay permanently in the United States. This suggests that our framing of the ways in which legal status shapes inequality needs to account for the many ways in which even “nonimmigrants” are incorporating. And in addition, this suggests scholars need to cast a broader light on the other ways that structural constraints limit immigrant incorporation into the future.
Of course, it is possible that some of the variation in length of stay derive from factors that are unrelated to U.S. immigration policy and its per-country caps. For example, in India and China, return migration has been motivated as a strategy for national development, as governments encourage “reverse brain drain” through entrepreneurship programs, research funding, and incentives such as housing to increase skilled nationals educated abroad (Marini and Yang 2021; Zweig, Fung, and Han 2008). Some of these policies may derive from India and China aspiring for world-class academics while breaking into global influence (Liu et al. 2024; Oxford International 2023). By contrast, European countries rely more on individual choice within free-movement regimes (Weber and Saarela 2023). Researchers have also found that Chinese students in the United States experience shifts in their political ideologies, with many international Chinese students maintaining their nationalism while adopting liberal views (Pan and Xu 2018). Europeans and Canadians, by contrast, often pursue mobility for personal, intellectual exchange and cultural, or professional experiences (ICEF 2024; Yu 2023). Future research can further investigate variations by sending regions in the tendency for students to return home versus remain in the United States.
In any case, it is important for educational and labor market institutions that student visa holders have such a rare opportunity to adjust to a green card. Even though students rely on temporary visas for work, the labor market could suffer without having a matched supply for their demanded jobs. Indeed, employers do not always have access to temporary employment visas because of high sponsorship costs, administrative burdens from the state, or information asymmetries. These constraints are purported to only increase into the future given that the second Trump administration has proposed to dramatically increase the sponsorship costs for high-skilled visas. Also as of 2025, students particularly from South Asia have come under political attack and are targeted for deportations. It is too soon to tell how these new constraints will shape delayed legal status incorporation. Nonetheless, if students only have access to other temporary visas, rather than a unique pathway to permanent residence, we can speculate that this pattern will only become exacerbated.
Finally, these findings have important repercussions for immigration policy. As we noted, there is significant heterogeneity in legal status attainment by country of origin. Indian (and to a lesser extent Chinese and Central America and the Caribbean) students experience evidence of delayed legal status incorporation. Despite their relatively long duration of stay, they are far less likely to acquire green cards from student visas more than 10 years in the United States compared with Europeans, South Americans, and Africans. We speculate this pattern is due to visa wait times. But this analysis does not permit a formal test of the mechanisms explaining this discrepancy. One might imagine several hypotheses. First, it could be the case that Indians are less likely to acquire family reunification paths to permanent residence than European, South American, or African migrants. This could be because Indians are getting married to other Indian nonimmigrants, rather than to individuals with permanent residence or citizenship. But net of marital patterns, it could also be the case that there are country of origin hiring preferences in the labor market, such that European and South American students are more likely to receive employer-sponsored permanent resident visas compared with Indian (and Chinese and Central American and Caribbean) students, who are more likely to receive temporary employer-sponsored visas. Although these data do not permit us to answer these questions, it would behoove future scholars to unpack the black box of employer hiring and visa adjudication decisions. Answering these questions is pivotal for immigration policy-makers to improve the student visa program.
Ultimately, these results cast a new light on the legal status trajectories of student visa holders in the United States. Even though common parlance and immigration law treats international students as sojourners en route to intellectual development and production for their host countries, we demonstrate that, in reality, student visa holders are more “immigrants” than “non.” This mismatch between policy and practice is particularly problematic amidst presidential administrations which drastically change how they treat student visa holders in this country. As a result, researchers and policymakers alike must recognize their long-term stays in the United States, whether under student, work, or other visas.
Footnotes
Appendix
Multistate Life Table of Transitions among Visa Statuses among Foreign Students, 2010 to 2021.

| Cohort Size (lx) | Cohort Size (lx) by Status | Transitions (dx) | Average Person-Years Lived from Duration x within First 10 Years (ex,10) | ||||||||||
|---|---|---|---|---|---|---|---|---|---|---|---|---|---|
| Duration lived in US (x) | Student (lxs) | Temporary Visa (lxt) | LPR (lxr) | Student to Temporary Visa (dx,s→t) | Student to LPR (dx,s→r) | Temporary Visa to LPR (dx,t→r) | Student to Out of United States (dx,s→o) | Temporary Visa to Out of United States (dx,t→o) | LPR to Out of United States (dx,r→o) | Student (exs,10) | Temporary Visa (ext,10) | LPR (exr,10) | |
| 0 | 1,000 | 1,000 | 0 | 0 | 101 | 9 | 0 | 17 | 0 | 0 | 4.1 | 3.1 | .8 |
| 1 | 983 | 873 | 101 | 9 | 103 | 10 | 1 | 23 | 2 | 0 | 3.2 | 3.1 | .8 |
| 2 | 957 | 737 | 200 | 20 | 99 | 10 | 3 | 30 | 6 | 1 | 2.5 | 3.0 | .8 |
| 3 | 920 | 599 | 290 | 32 | 90 | 9 | 7 | 34 | 12 | 1 | 1.9 | 2.8 | .8 |
| 4 | 873 | 465 | 361 | 47 | 76 | 8 | 12 | 36 | 19 | 2 | 1.4 | 2.6 | .8 |
| 5 | 817 | 345 | 407 | 65 | 60 | 7 | 17 | 34 | 25 | 3 | 1.0 | 2.3 | .8 |
| 6 | 755 | 244 | 424 | 86 | 45 | 5 | 23 | 29 | 31 | 4 | .6 | 2.0 | .7 |
| 7 | 690 | 165 | 414 | 111 | 31 | 4 | 28 | 23 | 35 | 6 | .4 | 1.5 | .6 |
| 8 | 626 | 107 | 382 | 136 | 20 | 3 | 30 | 17 | 36 | 8 | .2 | 1.1 | .5 |
| 9 | 565 | 67 | 336 | 161 | 13 | 2 | 30 | 12 | 35 | 10 | .1 | .5 | .3 |
| 10 | 509 | 41 | 284 | 183 | |||||||||
Source: National Survey of College Graduates, 2010, 2013, 2015, 2017, 2019, and 2021.
Note: The sample was restricted to foreign-born individuals who arrived at ≥18 years of age from 2000 to 2021 on student visas and who attained at least one U.S. degree. N = 32,700 person-years, n = 9,200 individuals. Estimates are modeled using life tables and do not represent individuals in the data. LPR = lawful permanent resident.
Acknowledgements
We would like to thank the Socius reviewers and editors, as well as the Migration Diversity Initiative and the Population Research Institute at Penn State, for useful feedback which improved the development of this article.
Funding
The authors disclosed receipt of the following financial support for the research, authorship, and/or publication of this article: We gratefully acknowledge support from the Migration Diversity Initiative and the Population Research Institute, which is supported by an infrastructure grant from the Eunice Kennedy Shriver National Institute of Child Health and Human Development (P2C HD041025).
1
Where the respondent’s field of study for their highest degree is in any of the following: computer and information sciences; mathematics and statistics; agricultural and food sciences; biological sciences; environmental life sciences; chemistry; earth, atmospheric, and ocean sciences; physics and astronomy; other physical sciences; economics; psychology; aerospace; aeronautical and astronautical engineering; chemical engineering; civil and architectural engineering; electrical and computer engineering; industrial engineering; mechanical engineering; other engineering; health; science and mathematics teacher education; technology and technical fields; and other science- and engineering-related fields (i.e., where the variable NDGMENG has a value of 11–41, 43, or 51–64).
2
Most (two thirds) of European student visa holders come from seven sending countries: Russia and the former Soviet Union, Germany, France, the United Kingdom, Italy, Spain, and Romania.
3
Canadians are similar to Asians in that only 7.4 percent ever hold permanent residence, and they spend only 0.3 years in permanent residence (5.2 percent of their time). However, Canadian students stand apart because they are also the least likely to remain in the United States (13.9 percent) and the least likely to ever hold a temporary visa. This is somewhat surprising given their unique position under the North American Free Trade Agreement (now USMCA), which offers a special nonimmigrant work visa called a TN visa (![]() ). Their low rates of acquiring temporary work visas (despite their availability) and high rates of return suggests that demand for permanent residence in the United States may be relatively low among Canadian students.
). Their low rates of acquiring temporary work visas (despite their availability) and high rates of return suggests that demand for permanent residence in the United States may be relatively low among Canadian students.