
Abstract
The authors analyze the relationship between social class and the various levels of digital inequality, such as Internet access, inequality in digital skills, and online behavior. Two unique databases from Hungary are used. First, digital activity and digital skills are studied on a 10 percent random sample from the 2022 Hungarian census. Second, to analyze online behavior, a donation-based digital behavioral dataset is used, which is linked with a representative survey of the Hungarian Internet user population. There has been a notable decline in research activity regarding the first level of the digital divide, but these results indicate that the access level of the digital divide persists in Hungary, particularly among unskilled workers. In addition to the anticipated finding that individuals belonging to higher social classes are more likely to engage in digital activities and possess advanced digital skills, the analyses revealed that social class also influences social media use. Although a considerable proportion of the unskilled workforce lacks Internet access, those who are connected demonstrate the highest levels of digital engagement, posting the most often and spending the most time on Facebook. However, on average, the upper classes write longer posts and comments.
The concept of the digital divide is based on inequalities in access to and use of the Internet. Different levels of this divide are defined according to the type of inequalities users have to overcome in the digital domain. The first level of the digital divide is usually defined as inequality of access to the Internet and information and communication technology (ICT) tools (Hargittai 1999; Rogers 2001; Warschauer 2004). The second level is defined as inequality in digital skills and the quality and effectiveness of use (DiMaggio et al. 2020; Gran, Booth, and Bucher 2021; Maceviciute and Wilson 2018), including social media use habits (Gran et al. 2021). The third level of the digital divide encompasses the overall benefits and risks, as well as the tangible outcomes that an individual may or may not realize through their online activity (Gran et al. 2021; Van Deursen and Van Dijk 2014).
As Internet penetration and digital literacy become more widespread, new levels of the digital divide may emerge alongside a decline in the relevance of the first levels. In the majority of Western countries, the proportion of the population with access to the Internet exceeds 90 percent. The average was 90.2 percent in the European Union in 2019 (Gomes and Dias 2025) showing that the first level digital divide affects a relatively small proportion of Western societies in the present era.
Different levels of the digital divide may be influenced by a multitude of factors, including age, gender, education, municipality, and social class. In their analyses of data from 2017, Gomes and Dias (2025) found that nonusers, who had never shown any online activity, were predominantly 65 years or older and had completed their education prior to the age of 15 years, and 59.2 percent of them were women. Consequently, individuals with higher levels of education who reside in larger urban centers are more likely to be online, whereas older individuals and those belonging to less affluent social classes are more prone to lacking access to the Internet and ICT devices (DiMaggio et al. 2020; Norris 2001; Yates, Kirby, and Lockley 2015). Although at the turn of the millennium men were more prevalent in online spaces, after 2020, this trend reversed in most Western countries, with women now demonstrating a greater propensity for online activity than men (Acilar and Sæbø 2023; Norris 2001).
Sociodemographic factors play a role in the second level of the digital divide as well, including participation in social media and online behavior. In general, women are slightly more active on social media platforms than men. As age increases, social media use declines, metropolitan populations demonstrate greater social media activity than rural populations, and households with rising incomes use social media more (Hruska and Maresova 2020; Koiranen et al. 2020). Gender also plays a significant role in the second and third levels of the digital divide, as women often possess less developed digital skills than men, and have difficulty leveraging their skills for personal and professional benefit (Acilar and Sæbø 2023; Hargittai and Shafer 2006).
It should be noted that these results are based largely on self-reported data to examine individuals’ digital activity, which is more capable of measuring attitudes than real behavior (Kmetty, Stefkovics, et al. 2024; Máté et al. 2023). Self-reported data are frequently subject to bias, with respondents often unable to recall their own habits and actions with precision or unwilling to share certain information. Nevertheless, our donation-based data collection enables us to examine social media behavior on the basis of information captured by social media platforms.
In response to calls for research into the replication and creation of social inequalities in the digital space from a classical sociological approach to stratification (e.g., Ragnedda and Muschert 2013), this study focuses on a single factor: the question of how social class is associated with the different levels of the digital divide. Specifically, it considers how social class influences access and relates to skills and social media use. First, our work aims to contribute to a systematic exploration of how class inequalities are present or even reproduced in the online space and what kind of role they play in the first two levels of the digital divide. Second, our contribution introduces a novel component compared with previous research as it is based partly on the observation of individuals’ actual digital behavior.
With regard to the first, most basic level of digital divide, following the spread of easily accessible Internet, it was predicted that the socioeconomic divide of Internet access would become less pronounced, and a higher level of digital divide would emerge (Rogers 2001). The international consensus that the first-level divide is no longer significant in Western countries is illustrated by the fact that the majority of recent literature focuses mainly on the second and third level (e.g., Acilar and Sæbø 2023; Gran et al. 2021; Lybeck, Koiranen, and Koivula 2024; Mahdiloo et al. 2023). Although the problem of access is becoming less relevant as more individuals gain access to the Internet and ICT tools, prior research indicates that the characteristics of those excluded could be explained effectively in terms of social class (Yates et al. 2015; Zillien and Hargittai 2009).
Research on the relationship between class position and social media use is diverse and not uniformly conclusive (Schradie 2020; Van Deursen and Van Dijk 2014; Willekens, Siongers, and Lievens 2022; Yates et al. 2015; Yates and Lockley 2018). However, although few researchers use rigorous theoretical class structures in their studies, there is extensive literature on the relationship between social media and various indicators of social groups and positions. Our research is based on two well-established frameworks applicable to the field, active and passive social media use (Burke, Marlow, and Lento 2010; Cheng, Nguyen, and Nguyen 2024; Oberoi and Singh 2024) and restricted and elaborated codes (Bernstein 1971, 1975; Catone and Parziale 2022). The specific mechanisms driving the differences by social class are not tested in this study, but our assumptions regarding the quantitative measures of social media behavior are based on these theories.
Active social network use is typically characterized by the creation of content and interaction with it, whether through nontextual actions such as liking or textual interactions such as writing comments or posts (Burke et al. 2010; Cheng et al. 2024; Oberoi and Singh 2024). In contrast, passive social network users, or “lurkers,” only scroll through the platform and consume content without reacting to it (Cheng et al. 2024). Depending on the theoretical background of the categorization, sharing content can be part of active or passive behavior (Cheng et al. 2024; Oberoi and Singh 2024). On the basis of the findings of Ozanne et al. (2017), that sharing information on social media is perceived as a form of self-presentation conveying personal values and opinions, we define sharing and reposting as active social media use.
According to Bernstein (1971, 1975), inequalities between social classes are shaped, among other factors, by the different ways in which language is used. He stated that members of the working class use only “restricted code” because it is the only code they know, whereas the middle and upper classes use “elaborated code,” a more sophisticated form of language. The middle class, however, knows both codes and can use them. Those who use the restricted code prefer to interact with people similar to themselves in terms of social and cultural background, values and lifestyle. This is a horizontal mode of communication. In contrast, the elaborated code is more sophisticated and less particular, associated with a universalistic mentality (Catone and Parziale 2022). On the basis of studies of social media behavior, it has been found that social groups from underprivileged backgrounds, on the basis of occupational status and education level, tend to find and trust information on social media more than groups from more privileged backgrounds. This is because the form of information on social media responds to the restricted code and horizontal mode of communication that these groups use (Catone and Parziale 2022).
By focusing on the relationship between class and the different levels of the digital divide, we hypothesize that contrary to the optimistic expectations associated with the widespread use of the Internet (Schradie 2020), traditional, offline class inequalities are reproduced in the online space. Namely, although access to digital tools is becoming more widely available, we assume that class position still significantly explains access and that who is excluded from the online space (hypothesis 1). Our second hypothesis is that class position also affects the way in which social media is used (hypothesis 2). We focus on three specific aspects of social class behavior in relation to social media use: social media adoption, the diversity of platforms used, and behavior on these platforms in terms of activity.
In terms of social media adoption, Rogers’s (2001) diffusion of innovations theory provides an insight to the gradual process that is present in a society when learning about an innovation. The theory identifies five groups on the basis of the rate of adoption of new technology, starting with the Innovators group, who are more educated, possess higher socioeconomic status and income levels than later adopters (Dearing and Cox 2018; Rogers 1995, 2001). In light of this theory, we hypothesize that the adoption of social media as an innovation commenced earlier in the upper social classes in Hungary, and other classes followed later (hypothesis 2.1).
With regard to the use of social media platforms, extant research suggests that older people tend to engage with a single platform or none at all. Users with higher levels of education are more likely to use a greater number of platforms (Hruska and Maresova 2020), but lower socioeconomic groups use fewer platforms and are less likely to use ones with a primary focus on professional content (Yates and Lockley 2018). No specific hypothesis has been formulated regarding the relationship between the use of different social media platforms and social class in Hungary. It is assumed that different social classes do not use the same number and type of social media platforms (hypothesis 2.2). In this regard, our study is exploratory in nature.
As our study is explorative in nature using a unique donation-based database containing a vast number of possible indicators, first we applied a quantitative approach to measure human behavior on social media, on the basis of the frequency of likes, comments, and shares or posts, which is the most common approach among the related research (Trunfio and Rossi 2021). The most commonly used signal is the “like,” which requires very little effort yet can convey a lot. It can be a simple expression of approval when a user finds content entertaining or relatable. However, it can also be used to share information, primarily for self-presentation, namely showing one’s values and interests, or to fulfil social obligations, such as expressing solidarity or raising awareness. Finally, a “like” can be used for impression management, whereby a user protects a socially desirable personal image by only “liking” certain content instead of sharing it (Ozanne et al. 2017). This shows that a “like” is considered less serious than a “share.” This notion is supported by Kim and Yang’s (2017) findings that liking is affectively driven and commenting is cognitively driven, whereas sharing can be driven by either of these factors, or by both. However, although these behaviors are sometimes conscious and curated, users often do not think through such detail before pressing the “like” button (Ozanne et al. 2017).
Earlier results on active and passive social media behavior indicate that in general, social media activity can be divided into three levels: consuming, contributing, and creating (Muntinga, Moorman, and Smit 2011; Schivinski, Christodoulides, and Dabrowski 2016). These reflect different levels of activity and require different amounts of cognitive effort (Piolat, Olive, and Kellogg 2005). The lowest level of social media activity is the consumption of content, while it requires more cognitive effort to react or contribute to a piece of content. The creation of content necessitates the greatest expenditure of cognitive and psychological effort. The application of these concepts to communication on Facebook—the platform on which we will test our hypotheses—reveals that the three levels correspond to three distinct forms of behavior: liking, commenting and posting (Kim and Yang 2017). The cognitive effort required to like content is significantly lower than that required to comment on or share it, as liking is more of an affective behavior than a cognitive one, whereas commenting is more cognitive and sharing can be either. Furthermore, the act of posting and sharing content requires a greater degree of commitment than that which is required for a comment. A post or share may be considered an extension of the user’s offline self-representation (Ozanne et al. 2017), whereas a comment represents a less cognitively demanding contribution to existing content (Kim and Yang 2017). In light of these results, we hypothesize that members of the upper social classes as contributors and creators tend to post and comment more (and longer) than members of the lower classes, while liking and other activities requiring less cognitive effort are more typical of the lower classes (hypothesis 2.3.1).
Nevertheless, activity on social media can not only be measured by its level, but also in terms of its quantity. Prior research suggests that people in different social positions use social media to different extents. Those in higher social positions have access to a greater variety of leisure activities, spend more time outdoors and have a larger social network. The maintenance of these diverse and active leisure habits requires more time, which can create leisure time pressures that limit the amount of time spent on social media. Furthermore, social media is frequently perceived as an unproductive use of time. In contrast, lower social classes are more likely to engage in “home-based” leisure activities, primarily watching TV. They are also less likely to experience leisure time pressure than higher classes and therefore are likely to have more time available for social media use (Glorieux et al. 2010). Van Deursen and Van Dijk (2014) discovered that highly educated people tend to use the Internet for shorter periods of time than those with lower levels of education. Additionally, excessive engagement with social media can turn into overuse, which became an emerging dimension of the digital divide. Results indicate that lower educated, younger age groups and particularly women are more susceptible to digital overuse. Those who communicated the most frequently online were also more likely to report experiencing overuse (Gui and Büchi 2021). On the basis of these findings we hypothesize that lower social classes spend more time on social media, might even in the form of overuse (hypothesis 2.3.2).
Data and Variables
Data
The analysis was conducted on two special, and not linkable databases. Digital activities and digital skills were analyzed on a 10 percent sample of the 2022 Hungarian census. The 2022 Hungarian census is a mandatory survey that was conducted between October 1 and November 28, 2022. Although selection biases cannot be ruled out even in the case of a survey in which participation is obligatory, it is the best data source for the Hungarian population and, within it, for hard-to-reach social groups. We used a 10 percent random sample derived from the 2022 Hungarian census, which contains nearly 1 million respondents. 1
For the separate investigation of social media use, we used a unique data donation database (Kmetty, Koltai, et al. 2024), which contains data on observed digital behavior based on observation rather than self-reporting. This hybrid data collection method is based on a sample representative for the population of Hungarian Internet users 16 years or older by gender and age. Data were collected between February and June 2023. Participants were recruited using an online market research company’s (NRC) online access panel. Initially, participants completed an online survey that contained detailed questions about the participants’ social status, employment, financial situation, and various sociodemographic characteristics. Subsequently, a special data donation technique was applied (Boeschoten et al. 2022; van Driel et al. 2022), when researchers ask participants to share their data stored by online platforms. This technique is legally based on the European Union’s General Data Protection Regulation, which states that large platforms must provide the possibility to their users to access and download the historical data stored about them (covering all types of data such as behavioral, textual, media, and location) in the form of data download packages (Boeschoten et al. 2022; van Driel et al. 2022). Consequently, participants were asked to download their comprehensive data packages from Facebook and Google and then upload these to a platform created by the researchers, along with their consent to the anonymized processing and analysis of their data. (In this study, only Facebook data of the participants are used.) It is important to mention that although in some countries Facebook use is declining, particularly among younger generations, in Hungary, Facebook remained highly popular with 7.43 million users (Medve 2024) out of the country’s 8.56 million Internet users (Kemp 2022) in 2022, being the most popular social media platform in Hungary (Medve 2025). This data collection complied with European and Hungarian privacy regulations and received approval from the Ethics Committee of the HUN-REN Centre for Social Sciences (resolution number 1-FOIG/130-37/2022). The hybrid approach enabled the collection of detailed information on both the participants’ social class (from the survey data) and their observed online behaviors.
To correct for sampling biases, individual weighting on the basis of the 2022 census was used to align the sample distribution with the population distribution of sociodemographic variables. The weights were computed using iterative proportional fitting (Bishop, Fienberg, and Holland 2007). Consequently, the weighted distributions closely matched the population distributions within an acceptable margin of error. The population, to which the weights were calculated, is defined as Hungarian Internet users who use chat or e-mail for communication and are 16 years or older. The weighting dimensions included gender, age, education, type of settlement, and geographical regions. The distribution of these variables in the census and in the data donation survey is presented in Appendix A (Table A1, Figure A1).
Measures
Social class is a key variable of this study. Following the tradition of empirical class analysis, we measure this on the basis of the individuals’ occupation and other labor market characteristics. More specifically, we rely on aggregated (five- and nine-category) versions of the Hungarian Socio-Economic Classification developed by Bukodi and Záhonyi (2004). This categorization is based on the Erikson-Goldthorpe-Portocarero (Erikson and Goldthorpe 1992; Goldthorpe 2007) scheme, the European Socio-Economic Classification (Rose and Harrison 2014), as well as on previous Hungarian occupational classifications (Ferge 1969). The operationalization of the scheme was based on four-digit occupation codes, and for respondents who were out of the workforce at the time of the survey (e.g., pensioners, unemployed people), their last occupation was considered. The validity of the scheme has been tested several times and it is part of the official statistical data releases in Hungary (Bukodi and Záhonyi 2004; Huszár et al. 2015, 2018). Appendix A presents the occupational classes and the distribution of the scheme in the 2022 census and in the data donation survey as well.
The 2022 census included a detailed block of questions on the digital activities and digital skills of respondents. A series of questions were asked on whether they do various activities. On the basis of the respondents’ answers an ordinal variable was created by the Hungarian Central Statistical Office (the institute responsible for the 2022 Census) on digital skills and activities. The higher the value of the variable, the higher and more complex the digital skills and activities of the respondent. The variable takes the value of 0 for those who do not engage in any digital activity at all, while the others are divided into three groups with basic, intermediate, and advanced level digital skills. 2
In examining Facebook adoption over time to test hypothesis 2.1, the observed behavioral data were used. The registration dates were derived from the Facebook data that participants shared during the data donation process, providing precise evidence on how the number of Facebook registrations increased over time. To test hypothesis 2.2, the survey data were used, where respondents were queried regarding the frequency of use of different social media platforms.
We used multiple digital indicators to investigate the social media behavior of individuals, which were created from the Facebook data of the data donation participants. According to our hypothesis 2.3.1, we created indicators measuring the engagement and activity of the data donation participants in Facebook communication and activities, including attributes of the texts they posted or commented. To test hypothesis 2.3.2, we created indicators measuring the time spent on Facebook. All indicators used were calculated on the basis of participants’ Facebook activities since July 1, 2018 (or if the registration date was later, then since the registration date). The reason for this cutoff is that we analyze the relationship between class-position and digital behavior, and we assumed that earlier behavioral data might not describe the class measured in 2023 that well. The three groups of indicators are presented in Table 1.
Indicators Measuring Social Media Behavior of Individuals According to Facebook Data.

Source: Data donation database.
The indicator was normalized by the number of months spent on Facebook since July 1, 2018, to control for different registration dates and thus time spent on the platform.
For the following indicators, we use the natural logarithm of the variables in the subsequent analysis: use frequency, number of reactions, number of posts, number of comments, indicators measuring the average character length of posts and comments. We applied logarithmic transformation because of the long-tailed distribution of the variables with the aim of reducing the impact of extreme outliers. The use span related indicator was used in its original form. The original distribution of the used indicators is presented in Appendix B (Figures B1, B2, and B3).
Results
In what follows we first focus on how class position relates to digital activities and digital skills on the basis of census data, and then on social media use by using our data donation survey. As the two databases are not linkable, two separate analyses were conducted.
Digital Activity and Digital Skills
Our first question is how deep the basic level of digital divide is in Hungary and how it is shaped by social class. According to hypothesis 1, we expect that although the problem of access and lack of digital skills is becoming less relevant, exclusion from the digital space, and low digital skills can be explained well in terms of social class. Figure 1 shows the relationship between occupational class and digital skills.

Digital skills by occupational class, 2022 (percentages).
According to Figure 1, a significant proportion of the Hungarian society, more than 90 percent, have access to digital tools and are engaged in at least some basic digital activity. However, it can also be noted that only a relatively small proportion of the Hungarian society (12 percent) has advanced digital skills. Furthermore, class is strongly correlated with digital activity suggesting that hypothesis 1 can be accepted.
As we expected, in the managerial and professional occupational classes, digital activity is widespread and these occupational classes also have the highest proportion of people with advanced digital skills. In lower occupational classes, such as farmers and unskilled workers, the proportion of people with no digital activity is much higher. In the lowest occupational group, the share of people with no digital activity is 23 percent.
Although seemingly small, it is remarkable that 9 percent of the population is completely inactive in the digital space. The prediction that the first level of the digital divide will become insignificant is therefore only partially correct, as there are social groups excluded from digitalization, especially in the lower occupational classes.
In the following, we use binary logistic regression models to investigate how class position affects digital skills while controlling for other sociodemographic variables. Here, we separately examine whether one performs a digital activity, and whether one has advanced digital skills. Table 2 shows the average marginal effects obtained from the regression analysis. For the selection of such measure of the effects instead of the traditional coefficients, we had two reasons. First, in case of such a large sample size (almost 600,000 respondents), many statistical tests are more likely to show significant relationships independently from the effect size (Lin, Lucas, and Shmueli 2013). Therefore, we wanted to use a measure which shows the size of the effects in a more interpretable way than traditional coefficients on the basis of log odds. Average marginal effects can be interpreted as the following: if the value of the independent variable increases with one unit, with how many percentage points does the probability of the dependent event change (increases or decreases) (Williams 2012). Our second reason was that although regression coefficients in logistic regression are not comparable across models, average marginal effects are (Mood 2010). Accordingly, we can compare the effects of the same independent variables on digital activity and on advance digital skills and have an understanding of the potentially different cleavages in the two dimensions.
Logistic Regression Models of Digital Activity and Digital Skills, 2022, Average Marginal Effects.
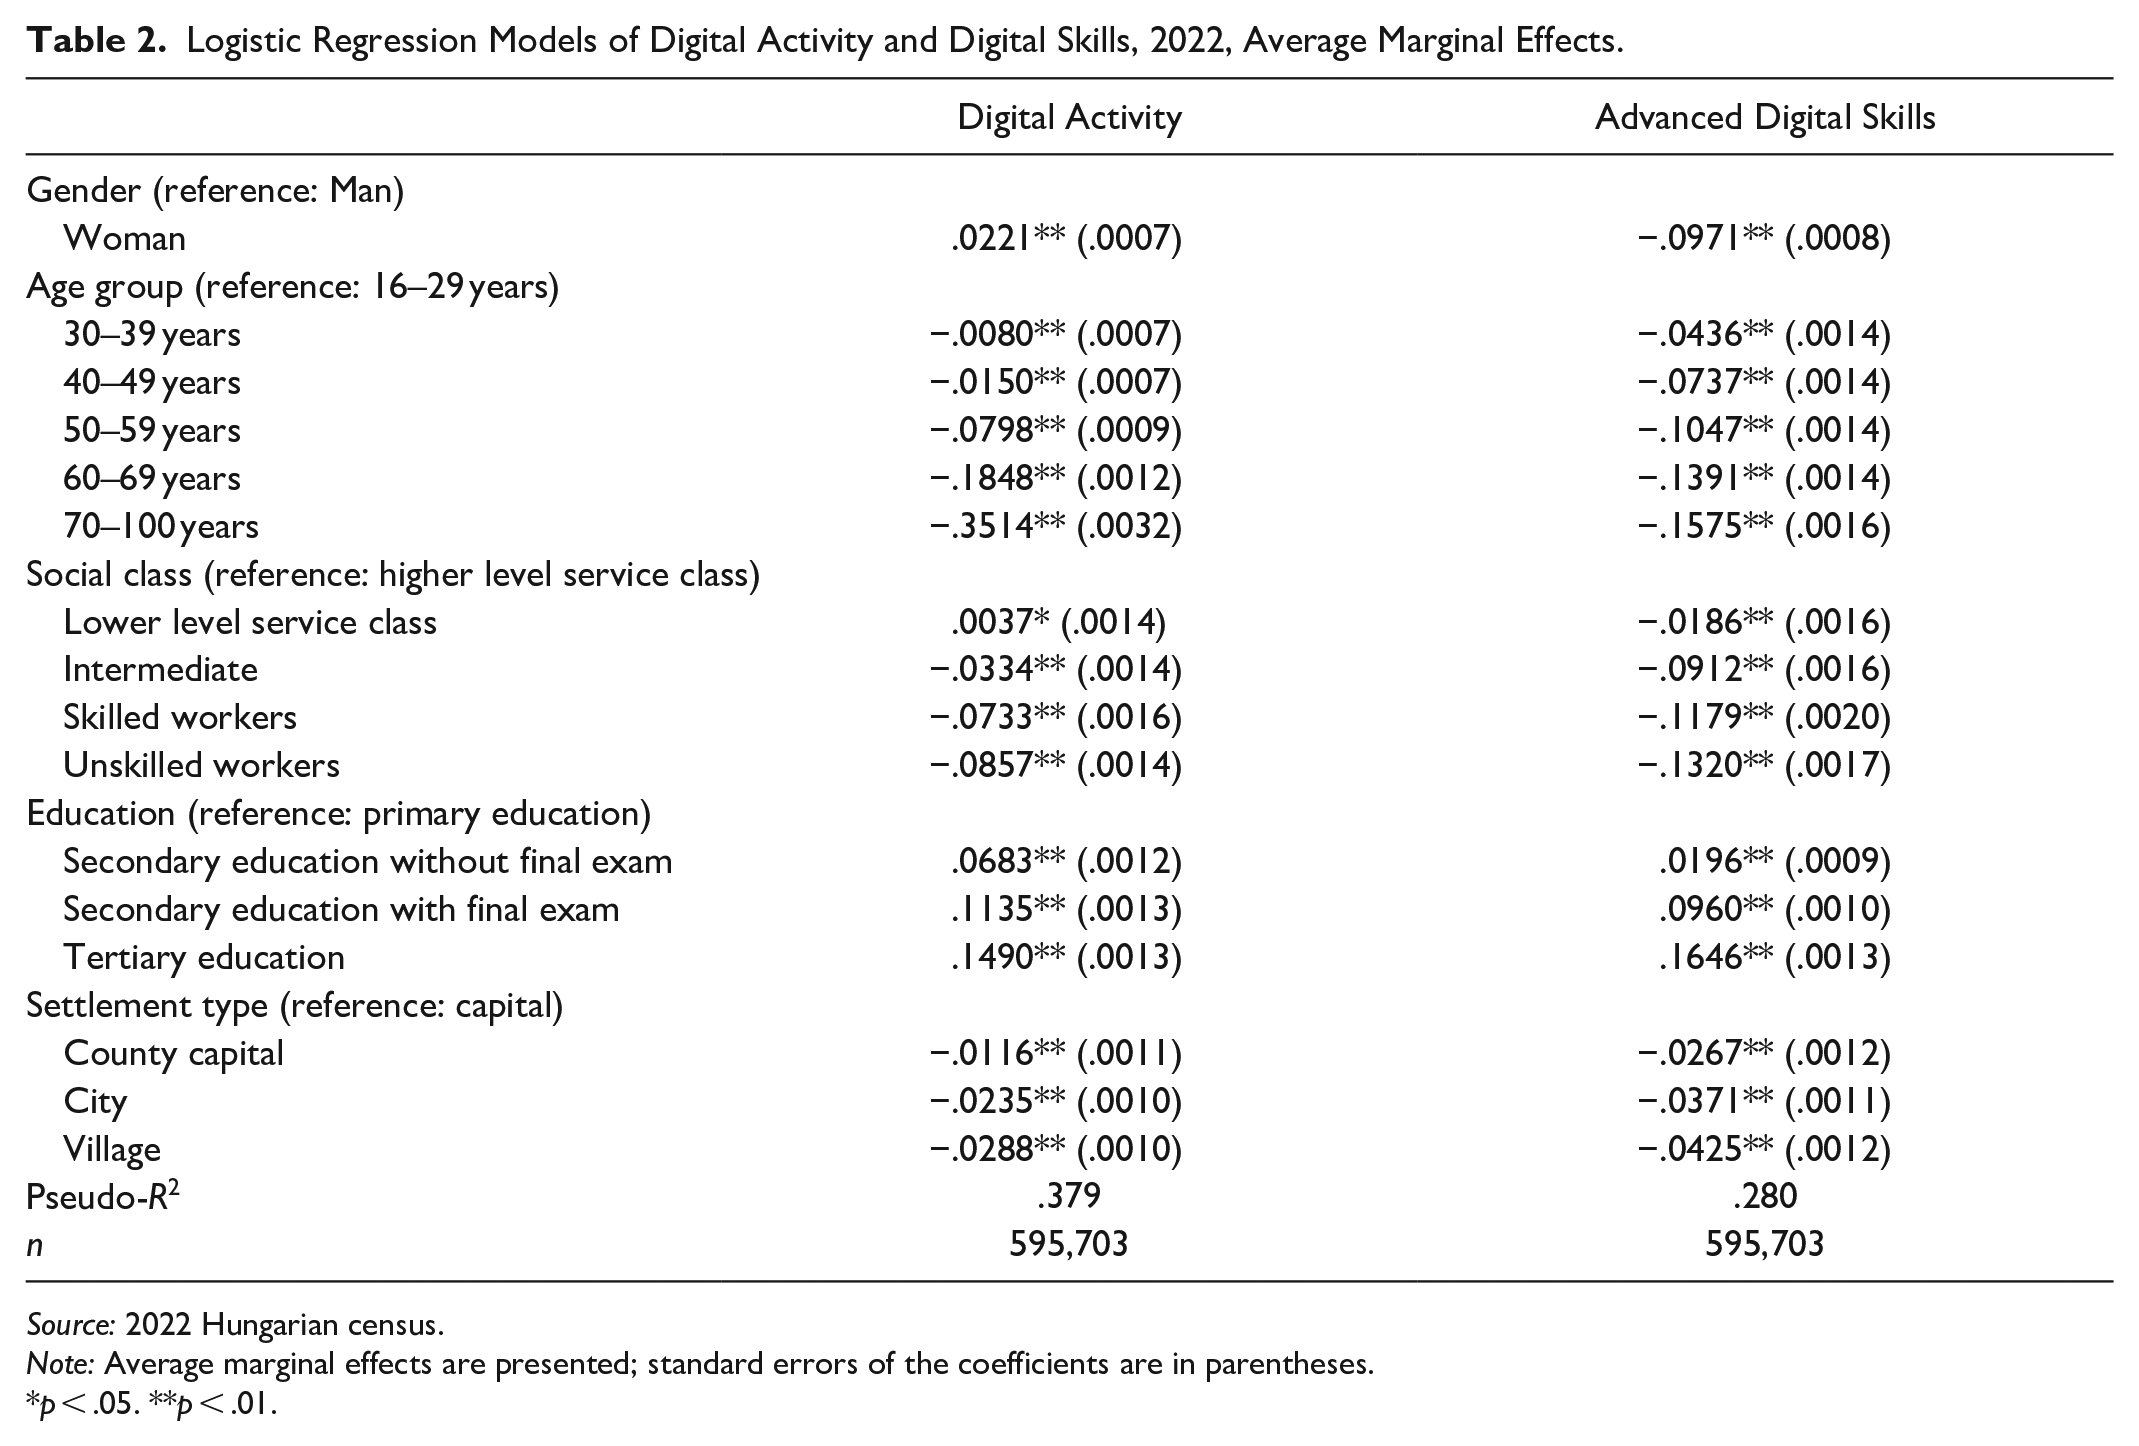
Source: 2022 Hungarian census.
Note: Average marginal effects are presented; standard errors of the coefficients are in parentheses.
p < .05. **p < .01.
We can conclude that class position has an independent effect on both dependent variables even when controlling for respondents’ sociodemographic characteristics, including educational attainment. The strength of the parameters also shows that the role of social class is stronger for the first dependent variable (i.e., whether someone is engaged in digital activities at all). For the second dependent variable (i.e., whether someone has advanced skills), the effect of education is stronger.
We found that all the other independent variables included were significantly associated with both the performance of digital activities and the possession of advanced digital skills. That is, the older someone is, the less likely they are to be active in the digital space or to have advanced digital skills. Similarly, digital activity and advanced digital skills are less common in smaller towns and villages compared with the capital. As for gender, even the direction of the association is not the same for the two dependent variables. On the one hand, women are more likely to be engaged in at least some basic digital activity. On the other hand, men are more likely to have advanced digital skills. Independently of the p values (see our foregoing concerns), the size of the effects seems meaningful, especially between higher and lower classes, education level and age. This is also supported by the values of the pseudo-R2 values that suggest convincing explanatory power.
These results strengthen the acceptance of hypothesis 1 and reflect earlier research results cited earlier on the links of demographic characteristics and the digital divide. An important addition is that advanced digital skills are more prevalent among men, probably because of traditional gender roles: interest in computers and the popularity of information technology and engineering jobs among men (Acilar and Sæbø 2023; Hargittai and Shafer 2006).
Social Media
In the previous chapter, we concluded that class plays a significant role in the characteristics of the first and also in the second levels of the digital divide. In the following, relying on data from the data donation research described earlier, we examine what differences in social media use can be observed by the participants’ class positions.
Regarding the specificities of the data, it should be remembered that the data donation participants were recruited among those with at least basic digital skills, as the respondents had to be Facebook users and were required to have a Gmail account. Participation in the data donation research project is therefore in itself linked to class and education. The participants of the data donation survey are on the technologically equipped, and digitally linked side of society according to the first levels of the digital divide. Accordingly, our main question (and related hypotheses) was, what further differences can be identified by class regarding social media use.
Our first hypothesis regarding social media use (hypothesis 2.1) was focusing on adoption. Figure 2 shows that the Facebook registration dates follow the theory of diffusion of innovations by Rogers (2001). As we assumed, members of the upper classes were early adopters, they signed up to Facebook slightly earlier and the lower classes followed a few years behind. These results provide evidence for the acceptance of hypothesis 2.1.

Distribution of Facebook registration date over time by occupational classes (percentages).
The second hypothesis regarding digital behavior focused on class differences in platform use. Participants of the data donation survey were asked how often they use different social media platforms. The results suggest that there are no significant differences between the occupational classes in the case of Instagram, YouTube, Twitter, and TikTok use, as shown in Table 3. Facebook use is 100 percent in all classes, as Facebook use was an essential requirement for participating in the data donation research. YouTube use is also close to 100 percent in all classes. Instagram, Twitter, and TikTok have lower use in every class, but there are no statistically significant differences in the use between classes. LinkedIn and Spotify, however, are platforms that are used significantly more frequently by the upper classes. These results suggest that we do not have to reject hypothesis 2.2 as different classes use different platforms with varying proportions. Reflecting on the exploratory nature of this hypothesis, we can nevertheless conclude that we only found two platforms by which class differences were detected: LinkedIn, which is a platform used mainly by white-collar workers, and Spotify, which requires a regular monthly subscription fee for convenient use. Thus, both platforms have inherent characteristics, which can explain their stronger relationship with class position. Instagram, Twitter, and TikTok have lower use in every class, but there are no statistically significant differences in the use between classes.
Social Media Platform Use by Occupational Classes, 2023 (Percentages).

Source: Survey data of the data donation research.
p < .05. **p < .01.
Finally, we examine our data donation Facebook data to see if there are differences in Facebook activities between social classes. We use the digital indicators presented earlier to explore the behavioral differences on the platform.
On the basis of three forms of Facebook communication, posts, comments, and likes (Kim and Yang 2017), our expectation was that people in lower social positions would be more active in terms of likes and therefore show signs of passive social network use, while people in higher social positions would give relatively fewer likes but would be more active in terms of comments and posts, which would indicate active social media use (Cheng et al. 2024). With regard to the Facebook text features, we hypothesized that users in higher social positions write longer posts and comments, which could indicate the use of elaborated code (Bernstein 1971, 1975) (hypothesis 2.3.1). In terms of differences in time use, we expected that users in higher social positions spend less time on Facebook, as they may experience a greater leisure time pressure, limiting their social media engagement (hypothesis 2.3.2).
Relying on the presented indicators, we used analysis of variance to test whether there are differences between social classes in terms of activity in Facebook communication, and Facebook text features, as well as in use time. The mean value of the presented indicators by occupational class, the common p value of the F test, and the sample size are summarized in Table 4.
Facebook Indicators by Occupational Classes, 2023 (Means).

Source: Observed digital behavioral data of the data donation research.
p < .10. **p < .05. ***p < .01.
In terms of activity (i.e., engagement in Facebook communication), the results did not meet our earlier expectations. Contrary to what we hypothesized, unskilled workers appear to be mostly active social media users and contributors, as they are the most active posters and commenters. They also have the highest average number of reactions among all classes, but there are comparable active groups at the upper part of the class structure as well. On the basis of these results, we must reject the part of hypothesis 2.3.1 that assumes that members of the upper classes are more likely to be contributors and creators in their activity, namely in the number of their posts and comments. Nevertheless, in terms of both post and comment length, the results suggest that the upper classes post and comment longer on average than the different working-class groups. These results thus suggest that the part of hypothesis 2.3.1 that assumes that higher classes tend to create longer text in their social media posts and comments can be accepted.
The results regarding time use also met our earlier expectations. Both the use frequency and the use span seem to be higher for people from lower social positions, although we do not see a statistically significant difference for the latter indicator. In terms of use frequency, people in the higher level service class use Facebook significantly less frequently than unskilled workers.
Conclusion and Discussion
The objective of our study was to answer how acute different levels of digital divide are in Hungary. To this end, we examined how class position relates to different forms of digital behavior. Our study is based in part on a sample of 10 percent of the 2022 Hungarian census, which represents an essential data source as it includes information on social groups that are difficult to reach, enabling us to make precise estimates of the relationship between class position and different digital activities. In addition, we relied on a special data donation research project, which provides an exceptional opportunity to examine the observed social media activity of respondents. Previous research has predominantly used self-reported data to examine individuals’ social media activity. However, this data collection methodology enables the examination of social media behavior on the basis of information captured and stored by social media platforms. Accordingly, using census data, we examined the relationship between class position and access, digital activity, and the level of acquired digital skills. The data donation survey was used to examine the social media (Facebook) activity of respondents, by relying on quantitative indicators.
The results demonstrate that although a considerable proportion of Hungarian society, exceeding 90 percent, engages in some kind of digital activity, the most basic level of the digital divide persists. Hypothesis 1 was confirmed, as the sociological profile of those excluded from the digital world is quite clear, as it mainly concerns those living in smaller settlements, the elderly, and those with low educational attainment and from the lower social classes. These findings are consistent with those of previous studies that have identified comparable patterns (Acilar and Sæbø 2023; Gomes and Dias 2025; Norris 2001).
The role of class is of particular importance in influencing whether an individual engages in any digital activity at all, and, moreover, whether they possess advanced digital skills. These findings indicate that both access and skill level are key issues in the use of digital tools. Approximately a quarter of unskilled workers are completely excluded from the digital world, thus confirming hypothesis 1. The fundamental elements of class inequalities are therefore strongly reproduced in the digital space.
Regarding the use of social media, our study identified further differences by social class. The adoption of Facebook exhibited a class-specific dynamic, with members of the upper classes registering first and those in the lower classes following slightly behind. This result not only suggests the acceptance of hypothesis 2.1 but also exemplifies Rogers’s (2001) theory on the diffusion of innovations. Furthermore, our findings indicate that Instagram, YouTube, Twitter, and TikTok use does not differ among social classes, but LinkedIn and Spotify are used more by the upper classes and less by the lower classes. The latter result suggests that hypothesis 2.2 (that different social classes do not use the same number and type of social media platforms) can be accepted. These findings can be attributed to the intrinsic characteristics of these platforms, namely LinkedIn is a platform designed for higher status work positions, whereas Spotify is a platform that requires a paid subscription for optimal use. These two characteristics are strongly correlated with higher class positions, which can explain the observed class differences in use.
Upon examination of engagement in Facebook communication, the results did not entirely align with our initial expectations. In contrast with the expectations based on the amount of cognitive effort required for actions on social media, unskilled workers are predominantly active social media users and contributors, and they write the most posts and comments on average. Although they also have the highest average number of reactions, similarly active groups can also be found at the upper levels of the class structure. These results indicate the rejection of that part of hypothesis 2.3.1, that compared with lower classes, people in higher class positions are more likely to be creators in terms of their number of posts and comments. Nevertheless, the part of hypothesis 2.3.1 that focuses on the length of posts and comments is acceptable, as the results indicate that on average the upper classes tend to write longer posts and comments compared with the lower working class groups, that is in line with Berstein’s theory on restricted and elaborated codes.
In terms of use frequency, our findings indicated that users of lower social positions tend to use Facebook more frequently than those in higher social positions. This observation aligns with our previous hypothesis (hypothesis 2.3.2) that lower social classes spend more time on social media. This lends support to the explanation that social media plays a more significant role in the leisure activities of those in the lower social classes than in those in the upper classes (Glorieux et al. 2010).
Analyzing social media data brings up the question how freely users can communicate on such a platform. With the rise of social media, the notion of censorship has also undergone a significant transformation. While in the past, state intervention was the main barrier to freedom of expression, today it is increasingly the global platforms that have their own community policies, algorithms and content moderation practices that determine what content can remain accessible (Gyetván 2024; Koltay 2021). According to Koltay (2021), the exercise of freedom of speech on social media platforms depends much more on the rules established and applied by the individual platforms than on state’s regulation. In Hungary, although content moderation is present as in every other country, the available empirical research, such as the study by Kmetty et al. (2022), does not show any evidence that the social media platforms in Hungary are more censored by the government than in other countries. This article provides a detailed analysis of online political discourse on Facebook in the lead-up to Hungary’s 2022 parliamentary elections. According to the article, comments supporting the opposition parties far outweighed pro-government comments in political content on Facebook—51 percent versus 21 percent—and this pattern did not change significantly during the campaign period. This suggests that there was no significant shift in political opinion on the platform in favor of the governing party and that users enjoyed relative freedom to share political opinions. Although there have been individual cases of platform moderation—for example, the removal of Mi Hazánk’s (the far right party) official social media page (hvg.hu 2020) or the Pesti Srácok channel (an extreme progovernment channel) (Füssy 2020)—these do not indicate systemic and state censorship. The same is true for the campaign video of the minister heading the prime minister’s office in 2018, which Facebook first removed for inciting hatred then reinstated for reasons of political interest (Mrav and Pálfy 2018). These cases reflect the frequently automated and context-independent moderation practices of global platforms, similar to those experienced in other countries. All of this suggests that Hungarian social media data, such as Facebook data, can be used reliably for analytical purposes, as moderation practices do not differ significantly from those observed internationally.
It is important to note that this study is not without limitations. First, the fact that the data donation sample was homogenized, with one of the conditions for inclusion being Facebook registration, may have an impact on the results. The present study was based on respondents’ Facebook activity over the past five years (to ensure that digital activity for the class position measured in 2023 is relevant), therefore it is possible that the activity of those in the upper classes, who typically registered earlier, has decreased over time, or that the way they use the platform has changed along with the platform. Second, because of the particularities of the data collection process, those who have already decided to terminate their Facebook account after early registration are also excluded. It is important to consider these limitations when interpreting the results, as they could potentially affect the study. Third, the data donation as a data collection technique has multiple limitations. On the basis of its goal to collect observed digital behavioral data, it automatically excludes those who do not use digital services at all (i.e., almost a fifth of the lower classes). Additionally, the likelihood for data donation is not randomly distributed within the society: it depends on multiple economic, social, and psychological factors (Baumgartner et al. 2023; Keusch et al. 2024; Kmetty, Stefkovics, et al. 2024; Skatova and Goulding 2019; Strycharz et al. 2024). A recent review (Xiong, van der Wal, and Beyens 2025) based on 31 scientific articles about data donation practices highlighted the importance of some individual characteristics such as age, digital savviness, and education level in the decision on whether someone donates their data or not. Older, less educated people with less digital skills tend not to donate their data (Xiong et al. 2025). Accordingly, the composition of the sample, even if we make every effort to make it representative, will be somewhat biased. Nevertheless, even with these limitations, the use of observed behavioral data instead of self-reported surveys for the measurement of social media activity renders the analysis a valuable contribution to the field.
Facebook, like other social media platforms, has a history of its own, and different stages of this history might be linked in different ways to other inequalities between social classes. It is therefore an important goal to pursue a dynamic investigation of social media behavior among individuals from different social classes to identify changes in activity. Another potential further direction is to examine how cultural and lifestyle differences between social classes are reflected on Facebook, and what kind of social milieus can be identified on the basis of the qualitative characteristics of pages followed, the events to which individuals are invited, the videos watched or other content shared. The donation of data for research purposes, which provides information on the actual digital behavior of respondents rather than self-reporting, offers an excellent opportunity to conduct these analyses in the future.
Footnotes
Appendix A
Distribution of Key Sociodemographic Variables in the 10 Percent Sample of the 2022 Hungarian Census and the 2023 Data Donation Survey (Percentages).

| Census, ≥16 Years | Census, ≥16 Years with at Least Basic Digital Skills | Data Donation Survey, without Weights | Data Donation Survey with Weights | |
|---|---|---|---|---|
| Gender | ||||
| Man | 47.5 | 47.3 | 39.8 | 47.2 |
| Woman | 52.5 | 52.7 | 60.2 | 52.8 |
| Total | 100.0 | 100.0 | 100.0 | 100.0 |
| n | 811,377 | 534,171 | 758 | 758 |
| Age group | ||||
| 16–29 years | 18.0 | 23.3 | 22.0 | 19.8 |
| 30–39 years | 15.3 | 19.1 | 27.8 | 24.3 |
| 40–49 years | 19.3 | 22.6 | 22.3 | 23.9 |
| 50–59 years | 16.0 | 16.7 | 14.1 | 14.5 |
| 60–69 years | 15.1 | 12.1 | 10.8 | 14.0 |
| ≥70 years | 16.3 | 6.2 | 3.0 | 3.5 |
| Total | 100.0 | 100.0 | 100.0 | 100.0 |
| n | 811,377 | 534,171 | 758 | 758 |
| Education | ||||
| Primary education | 18.2 | 9.0 | 4.5 | 9.0 |
| Secondary education without final | 25.7 | 22.4 | 13.2 | 22.4 |
| Secondary education with final exam | 33.5 | 37.6 | 43.5 | 37.7 |
| Tertiary education | 22.6 | 31.0 | 38.8 | 30.9 |
| Total | 100.0 | 100.0 | 100.0 | 100.0 |
| n | 811,377 | 534,171 | 758 | 758 |
| Settlement type | ||||
| Capital: Budapest | 18.0 | 21.1 | 22.2 | 21.8 |
| County capital | 20.8 | 22.0 | 24.3 | 21.6 |
| City | 32.0 | 30.7 | 33.6 | 30.6 |
| Village | 29.2 | 26.2 | 19.9 | 26.0 |
| Total | 100.0 | 100.0 | 100.0 | 100.0 |
| n | 811,377 | 534,171 | 758 | 758 |
| Region | ||||
| Central Hungary | 31.5 | 35.3 | 34.0 | 35.3 |
| Transdanubia | 30.3 | 29.6 | 28.8 | 29.6 |
| Great Plain and North | 38.2 | 35.1 | 37.2 | 35.1 |
| Total | 100.0 | 100.0 | 100.0 | 100.0 |
| n | 811,377 | 534,171 | 758 | 758 |
| Occupational class | ||||
| Higher level service class | 9.3 | 11.6 | 13.0 | 11.1 |
| Lower level service class | 19.8 | 24.1 | 32.7 | 28.7 |
| Intermediate | 31.6 | 33.3 | 33.7 | 32.1 |
| Skilled workers | 9.1 | 7.3 | 3.8 | 5.6 |
| Unskilled workers | 30.2 | 23.7 | 16.9 | 22.4 |
| Total | 100.0 | 100.0 | 100.0 | 100.0 |
| n | 595,704 | 534,171 | 702 | 702 |
Appendix B
Authors’ Note
Számel and Huszár contributed equally to this work.
Funding
The author(s) disclosed receipt of the following financial support for the research, authorship, and/or publication of this article: This work was supported by the Hungarian Academy of Sciences Lendület Program (grant LP2022-10/2022).
Ethical Considerations
This data collection complied with European and Hungarian privacy regulations. The ethics committee of the HUN-REN Centre for Social Sciences approved our data collection plans (1-FOIG/130-37/2022) on December 13, 2022.
Consent to Participate
Respondents gave written consent for review before starting the survey.
Data Availability
The publicly available datasets, without sensitive data, generated and analyzed during the current study are available in the repository of the HUN-REN Centre for Social Sciences Research Documentation Centre (![]() ). Repository access is limited, access details are available from the corresponding author on reasonable request.
). Repository access is limited, access details are available from the corresponding author on reasonable request.
The availability of the Hungarian census data of 2022 is restricted by the Hungarian Central Statistical Office (HCSO). The authors had access to a 10% sample of the census data in an offline research room of the HCSO, therefore we are unable to provide the full database we worked with, but a 1% sample is publicly available on the website of the HCSO: ![]() [click on the last column of the row ‘Népszámlálás 10%-os minta’].
[click on the last column of the row ‘Népszámlálás 10%-os minta’].
2
The following activities were listed. Basic digital skills included browsing the Internet and chatting online. Intermediate digital skills included using a text, spreadsheet, video, or image editing program; solving technical problems independently (e.g., reinstalling a program, checking Internet connection); and saving files to an external storage device or to an Internet storage site. Advanced digital skills included using database management, graphics, architectural design, or other programs requiring complex knowledge; programming using a programming language (e.g., Java, SQL, PHP, C#); building an information technology network; and developing, operating, or maintaining a server or application.