
Abstract
In this study, the authors examine whether and how city-level socioeconomic and political context shape racial classification practices in U.S. Black-White families. The authors link IPUMS 2012–2022, American Community Survey population estimates, and presidential election voting estimates to create a dataset that has 19,907 children across 1,135 Public Use Microdata Areas. Results from multilevel multinomial logistic regression models show that although overall parents are most likely to classify their multiracial children as Black and White, parents are more likely to classify their children as a single race in certain sociopolitical contexts: compared with parents in wealthier areas, parents in disadvantaged areas are more likely to classify their children as only White. Compared with parents in predominantly Democratic areas, parents in predominantly Republican areas are more likely to classify their children as only Black. The authors argue that parents of Black-White children promote racial passing in a low-wage labor market, and armoring in anti-Black political contexts. These findings emphasize the salient role of socioeconomic and political context in the construction of race and contribute to ongoing debates on the future of race and ethnicity in the United States.
Social scientists have a long-standing interest in examining the formation and dissolution of racial systems of classification. Historically, children of Black-White interracial couples in the United States were classified on the basis of the rule of hypodescent, more commonly known as the “one-drop rule,” that classified children with any Black ancestry as non-White. In contrast, children of Native American–White interracial couples were more likely classified as only White, on the basis of the lesser known rule of hyperdescent (Gullickson and Morning 2011; Wolfe 2001). These racial classification customs are based on the notion that race is a genetic trait discernible through visual or biological means, and that some types of “blood” can be absorbed into Whiteness, and other types of “blood” cannot (Gullickson and Morning 2011; Hickman 1996). Nevertheless, contemporary race scholars agree that race is a sociohistorical and political rather than biological phenomenon (Okamoto and Mora 2014; Omi and Winant 2014). Racial and ethnic classification of oneself and of others may shift as race intersects with other social identities and in response to sociopolitical and demographic changes (Agadjanian 2022; Bratter and O’Connell 2017; Davenport 2016; Irizarry, Monk, and Cobb 2023; Rockquemore, Brunsma, and Feagin 2008; Saperstein and Gullickson 2013).
One of the major demographic changes in the United States is the increasing frequency of mixed-race unions and, as a consequence, also mixed-race children. This change, paired with the option to mark multiple racial categories, results in more people, and especially children, with “biracial” or “multiracial” classifications (Frey 2014; Jones et al. 2021; Masuoka 2017; Parker et al. 2015). Because children do not usually fill out institutional surveys themselves, there is an important body of work examining the individual, family, and contextual correlates of how interracial couples racially classify their children (Bratter 2007; Brunsma 2005; Brunsma et al. 2012; Holloway, Wright, and Ellis 2012; Lichter and Qian 2018; Roth 2005).
The racial classification of children is a central part of ongoing debates regarding the future of racial and ethnic boundaries in the United States (Alba 2020; Bonilla-Silva 2004; Sue 2009; Treitler 2013). Assimilation theories posit that increasing mixed-race unions, increasing immigration, and resulting children are blurring race and color boundaries in a way that will create a more cohesive and egalitarian society (i.e., “non-zero-sum assimilation”) (Alba 2020:9; Drouhot 2024; Kasinitz and Waters 2024). Race theories posit that the privilege of whiteness depends on racial oppression, and that the upward mobility of immigrants and mixed race people is dependent on the exclusion of darker skinned African Americans (Bonilla-Silva 2004; Reece 2019; Sue 2009; Treitler 2013). In the present study we argue that rather than one homogenous racial/ethnic future following trajectories predicted by assimilationists or race theorists, ethnic and racial boundaries (and associated hierarchies) may have multiple futures that are shaped by local politics and socioeconomic contexts. Nevertheless, our findings do not speak to the future positions of dark-skinned African Americans, who are less likely to pass as White or claim multiracial labels, and less likely to integrate into middle- to upper-class White echelons of society.
The way parents racially classify their children is important for how the U.S. Census Bureau tracks demographic changes and how these changes are perceived by the public. The census classifies anyone with any non-White parent as non-White, even if they might racially pass as White and even if they are integrated into upper middle class White culture. According to Alba (2020, 2024), this classification of White-passing people as non-White is misleading and has contributed to stoking White fears about the United States becoming a minority-majority nation. These fears, Alba has argued, have contributed to Whites’ growing uneasiness about their status in race-class hierarchies in the United States and have partly contributed to Whites’ adopting more conservative and even extremist political positions.
Research shows that partisan politics are closely associated with racial attitudes. More than 80 percent of Democratic voters, for instance, either “strongly” or “somewhat” support Black Lives Matter, but only 17 percent of Republicans do (Horowitz, Hurst, and Braga 2023). These trends map onto other racial attitudes, for example, nearly 100 percent of White people who think that racial inequality is due to “Blacks’ lack of effort” voted for Donald Trump in 2016 (Sides 2018:171–72). A majority of Republicans have high levels of ethnic antagonism and deny that racism toward Black Americans is any different from racism toward White Americans (Bartels 2020:22756). Thus, starkly varying racial attitudes along party lines, paired with increased options for how interracial couples can racially classify their children, inform our argument that the “future of race” may be unevenly distributed in the United States. Specifically, we argue that local socioeconomic and political context may be a salient predictor of racial classification practices beyond previously established individual, family, and social network characteristics.
In this study, we focus on the socioeconomic and political determinants of how Black-White interracial couples racially classify their children. Black people in the United States and people with Black-White ancestry have faced racial oppression that is unique and not comparable with other non-White or multiracial people (Gullickson and Morning 2011). For this reason, we include only on Black-White couples and not other groups. Sexton (2010) explained that to compare anti-black racism in the United States with other forms of prejudice, discrimination, or xenophobia is to fundamentally misunderstand “the singularity of racial slavery and its afterlife” (p. 104). Wun (2016) elaborated on this point by explaining that anti-Black racism “is without analogue. Hence . . . comparisons or conflations serve to undermine the specific centrality of anti-Blackness to U.S. society, its institutions, polities, and practices” (p. 175).
Multiracial Self-Identity and Classification by Others
People’s self-identity and classification by others are two distinct but interrelated phenomena. Between two thirds and three quarters of people with mixed-race ancestry self-identify with multiple racial categories (Davenport 2016; Gonlin 2022; Lee and Edmonston 2005; Williams 2010). Having multiple racial ancestries, however, does not automatically confer a multiracial self-identity or a multiracial classification by others (Gonlin 2022). Although the 1967 U.S. Supreme Court ruling in Loving v. Virginia lifted bans on interracial marriage and declared the one-drop rule unconstitutional, some studies have shown that one-drop tendencies persist among young people with Black-White ancestry (Khanna 2010; Lombardo 1987; Parker et al. 2015). In part, young people’s self-identity is shaped by how they are perceived and treated by others (Khanna 2010).
Most immediately, young people’s self-identity is shaped by the way they are labeled within their own families (Brown 2001). Existing research shows that the way parents classify their children varies by characteristics of the individual child as well as characteristics of the household. On the individual level, parents are more likely to classify girls as multiracial than boys (Davenport 2016; Loblack 2024). Within households, more highly educated interracial couples tend to classify their children as belonging to multiple racial categories rather than a single race (Bratter and Heard 2009; Lichter and Qian 2018; Roth 2005). Racial classification of children is partly a result of the relative power of the Black spouse and White spouse within the marriage (Bratter and Heard 2009; Brunsma 2005; Holloway et al. 2012; Lichter and Qian 2018; Roth 2005).
Existing research shows that racial self-identity may also be shaped by individual political attitudes and affiliations in a way that is related to group belonging (Agadjanian and Lacy 2021; Jones and Frank 2023; Mason 2017). People who are more in favor of affirmative action policies, for instance, tend to identify more closely with their minority identity (Jones and Frank 2023). In the other political direction, people are more likely to “update” their identity to be only White after switching from a non-Republican to a Republican vote (Agadjanian and Lacy 2021). Similarly, people who are “skeptical that African Americans are discriminated against” tend to lean more closely toward White identity or equal White-minority identity (Jones and Frank 2023). On the state level, there is evidence that the racial identity of political leaders can also shape racial identity among the public (Mason 2017). For example, increasing shares of votes for Barack Obama, the United States’ first Black president, who has one White parent and one Black parent, increased the proportion of Black people who self-identify as multiracial (Mason 2017)
Colorism and Racial Passing
Lighter skinned Black or multiracial children benefit from colorism (Reece 2019) and White privilege (Waring 2023) that negatively affects their darker skinned peers. Colorism is a system that “rewards black people (and other people of color) for appearing white” (Reece 2016:147). Research shows that although “medium Black” and “dark Black” men suffer significant wage penalties relative to White men, “light Black” men’s wages are not significantly different from White men’s (Goldsmith, Hamilton, and Darity 2006). Lighter skin benefits extend to increased perceived attractiveness (Reece 2016), lower probability of school suspension (Hannon, DeFina, and Bruch 2013), higher educational attainment (Branigan et al. 2013), better health (Monk 2015), and more.
Although anti-Black racism or colorism cannot be avoided simply by choosing one racial label over another, there is a history of “escaping from Blackness,” among those for whom it is available (Pinckney 2020). Parents or grandparents might encourage their Black-White children to adopt a White identity, hoping to “protect their children/grandchildren from the devaluation and hardship that Blacks in this White-dominated society must frequently contend with” (Brown 2001:64) or to relieve some of the psychological pressure associated with being non-White or mixed race in U.S. society (Rumbaut 2008). Parents might choose to ignore or suppress their children’s Black identities as a way to shepherd them into a higher social strata, or because parents believe they will be happier in the White community . . . happiness as involving higher social status, entrenchment within the white community and corresponding isolation from the Black one, and greater access to the rights, liberties, and privileges the White community takes for granted. (Piper 1992:13)
Passing as White for social advancement or for survival was and continues to be an important theme in literature and film (Elam 2007). In the few studies on racial passing, scholars have described it as a complete adoption of a new constructed identity – but also as a temporary and opportunistic phenomenon (Hobbs 2014; Nix and Qian 2015). Passing is “constituted through routinized and repeated actions. One passes for what one purportedly is . . . in thousands of miniscule and major ways. Passing . . . is about demanding appreciation of the idea that all identities are processual, intersubjective, and contested/ contestable” (Jackson and Jones 2005:14). Researchers estimate that between 16 percent and 20 percent of Black people in 1880 passed for White by 1940 (Dahis, Nix, and Qian 2020; Nix and Qian 2015). Passing as White was associated with social and political opportunities associated with Whiteness (Nix and Qian 2015), with higher earnings (Mill and Stein 2016), and with longevity in old age (Noghanibehambari and Fletcher 2025).
The post-Reconstruction and Jim Crow eras were characterized by extremely vicious racism, lynchings, and systemic barriers for Black people. Thus, using historical data these studies suggest that in hostile political and economic contexts, parents of Black-White children will encourage their children to pass as White in order to access opportunities that darker skinned folks were excluded from.
However, contemporary multiracial families may not uniformly follow this same “Whitening” pattern. There is significant evidence that, especially in low -wage jobs, employers practice “race-coded job channeling” which is “a process by which minority applicants are steered toward particular job types, often those characterized by greater physical demands and reduced customer contact” (Pager, Bonikowski, and Western 2009:787). Thus, in areas where people are predominantly employed in low-wage jobs, parents (intentionally or not) might encourage their children to racially identify as only Black because it aligns with local labor market opportunities, albeit low-paid ones. In more advantaged areas, where people have higher-status and higher-wage occupations, parents might instead encourage their children to identify as White or multiracial to distance them from the more stigmatized Black identity (Jones and Frank 2023; Waters 1999).
Consolidating Black Identity
We posit in this study that racial self-identity and racial classification by others is politically constructed. Marx (1998) argued that official racial domination in the form of slave codes and Jim Crow laws paradoxically consolidated Black identity in the United States as a way to contest legally codified racial exclusion. The argument is that the creation of race and racial categories consolidate power among some groups while excluding or oppressing others. Thus, nationwide, legally codified slave codes and Jim Crow laws contributed to the creation and consolidation of Black identity, White identity, and others.
A handful of studies examine how subnational variation in race-related policies and race-related social phenomenon shape racial inequality (O’Connell 2012) and racial labels (Bratter and O’Connell 2017; Liebler and Zacher 2016; Mason 2017; Pickett, Saperstein, and Penner 2019; Porter, Liebler, and Noon 2015). O’Connell (2012) showed that slave concentration in 1860 is related to worse Black-White inequality, even after accounting for other possible explanations. Reece (2020) showed that in counties with higher proportions of enslaved people in 1860, there is a higher White median income and higher levels of White home ownership today. These findings demonstrate that there is a “legacy” effect and that the impact of slavery continues to shape contemporary life in a way that offers advantages to White Americans and confers disadvantage upon Black Americans.
Legacies of slavery, as they can be understood by the rule of hypodescent, and legacies of settler colonialism as they can be understood by the rule of hyperdescent, are more persistent in some areas than others and vary on the basis of the sociolegal history of a place (Bratter and O’Connell 2017; Liebler and Zacher 2016). Many states allowed interracial marriage before the ban was lifted nationwide in 1967. In states that were forced by the Supreme Court ruling to remove the ban, biracial children as recently as the 2010s were more likely classified as only Black than White or multiracial (Bratter and O’Connell 2017). In former slaveholding Public Use Microdata Areas (PUMAS), people with mixed White–American Indian or Black–American Indian ancestry were more likely to identify as only White or only Black than multiracial, respectively (Liebler and Zacher 2016).
Partly, this is a result of parents’ strategic socialization of children, especially Black children, to prepare them to stay physically safe and emotionally resilient in a society in which they are at high risk for racial discrimination and police violence (Brunson and Weitzer 2011). Scholars refer to this intergenerational socialization of Black children as armoring (Bell and Nkomo 1998; Brunson and Weitzer 2011). Armoring conversations reinforce for children that they are Black and that moving around the world as a Black child or Black adult means that there are extra steps, actions, and signals they must perform for self-preservation (Bell and Nkomo 1998; Brunson and Weitzer 2011; Malone Gonzalez 2019). Writing about young Black women, Bell and Nkomo (1998) referred to armoring as a way to “develop a protective shield as a buffer against unsavory elements of the outside world” (p. 286) but also as a way to “develop and maintain a sense of self-worth, dignity, and beauty in the face of social standards clearly signaling otherwise” (p. 286). Writing about young Black men, Brunson and Weitzer (2011) showed that armoring conversations are particularly salient in the context of parents preparing their Black sons for unwanted and unwelcome, but not wholly unexpected, contact with law enforcement agents.
Taken together, these studies suggest that in an anti-Black political contexts (as measured by interracial marriage bans, histories of slaveholding, or voting patterns), there is little incentive for parents to socialize their children in a way that will be illegible to their surroundings, and much incentive to form a cohesive in-group to bolster identity and create a buffer to protect from this hostility. In conflict with the literature on racial passing, literature on the politics of racialization lead us to expect that in anti-Black political contexts, parents will classify their children as only Black.
In the study we operationalize anti-Black political context using two measures. First, because legacies of slavery predict Black-White inequality in poverty (O’Connell 2012), and improved White (but not Black) social outcomes (Reece 2020), our first measure of anti-Black political context is a Black-White poverty ratio. Second, Republican Party identification is significantly associated with White antagonism toward people of color (Mason 2017; Sides 2018), and Donald Trump, the Republican presidential candidate in the past three presidential elections, has implicitly and explicitly condoned anti-Black violence (Sides 2018). Therefore, our second measure of anti-Black political context is the percent of the area that votes Republican.
Data and Methods
To estimate whether and how socioeconomic and political contexts shape the racial classification of children, we created a unique dataset that includes our dependent variable (racial classification of individual children), and independent variables (socioeconomic and political area and city characteristics), along with household-level and area-level covariates. Individual- and household-level variables come from IPUMS American Community Survey (ACS) microdata (2010–2012 three-year samples, 2013–2017 five-year samples, and 2018–2022 five-year samples). The IPUMS microdata sample size is about 5 percent of the U.S. population (IPUMS USA n.d.-a). We appended these samples to create dataset including yearly survey responses from 2012 to 2022. We merged IPUMS microdata with PUMA-level population estimates come from the 2012–2016 ACS five-year population estimates (Ruggles et al. 2023), and city-level voting estimates compiled by Warshaw and Tausanovitch (2022). Warshaw and Tausanovitch estimated presidential voting behavior by combining 18 large-scale surveys with about collected between 2006 and 2021. These surveys contain responses from about 1 million U.S. residents about their political opinions, attitudes, and voting behaviors in presidential elections. The data are aggregated to various geographic units, including states, counties, and cities, the last of which we use in this study.
Table 1 lists the three datasets and the crosswalk we used to build our dataset for analysis, and includes links to each dataset.
Sources of Data and Crosswalks.

Note: ACS = American Community Survey; FIPS = Federal Information Processing Standards; PUMA = Public Use Microdata Area.
Sample
Our sample includes children in households that responded to the ACS survey online, filled out a paper ACS survey and mailed it back, or were interviewed by census field representatives (U.S. Census Bureau 2017a). The ACS requires the household representative who fills out the survey to be at least 15 years old, therefore, we limit the sample to children younger than 15 years as a way to understand how parents racially label their children, rather than how children self-identify. The sample includes children who have both parents in the household and have one Black parent and one White parent. We exclude adopted children, stepchildren, grandchildren, and children who live in areas where codes across datasets were not comparable. About half of all the children in the IPUMS data did not live in areas that corresponded to a place represented in the ACS data. Table 2 shows some key differences between children who were matched across datasets versus children who were not, followed by a discussion of implications for our findings. Our merged dataset includes 19,867 children, in 15,587 households, in 1,135 areas, and across 45 states.
Matched versus Unmatched Children Younger Than 15 Years.

Note: PUMA = Public Use Microdata Area.
p < .05. **p < .01. ***p < .001.
The smallest identifiable geographic unit in the IPUMS microdata is the PUMA. PUMAs are geographic areas with 100,000 to 199,999 people that cover fractions of large cities but large portions of rural areas (Liebler and Zacher 2016; Siordia and Fox 2013). For example, in New York City, the Upper West Side, Morningside Heights, and Greenwich Village/SoHo are all distinct PUMAs (New York City Department of Health 2020). Unfortunately, PUMAs do not correspond directly with other units of analysis such as metropolitan statistical areas or counties (U.S. Census Bureau 2017b). To create our multilevel dataset, we used a crosswalk provided by IPUMS that links large places (>75,000 people) with PUMAs (IPUMS n.d.-b). Because the census redraws PUMA boundaries every 10 years and released 2010-based PUMAs in 2012, samples from 2011 are excluded from the sample (IPUMS n.d.-a).
Children who are matched across data sources are significantly less likely to be labeled only White and more likely to be labeled only Black, Black and White, and other. Matched children are more likely to have a Black mother, live in households with more highly educated parents. They are slightly younger on average, have fewer siblings, and have higher levels of household income. Finally, matched children live in significantly larger and more densely populated areas. These differences suggest that the findings in this study may be most representative of slightly higher income, more urban, and more educated parts of the United States. Table 3 shows unweighted descriptive statistics of our sample.
Unweighted Descriptive Statistics (Children Younger Than 15 Years), 2012 to 2022.

Note: The average percentage Republican is missing for some of the children, so models with percentage Republican have a slightly lower n. Children who were labeled Black and a race other than White, White and a race other than Black, or who had more than the labels White and Black are excluded from the analysis. A separate “other” category is included in the analysis but excluded from tables and figures for simplicity. HS = high school.
Measures
Racial Labels
Racial labels are a categorical variable indicating whether children are classified as White, Black, Black and White, or other. The White category and the Black category refer to a child with a singular racial label and make up 7 percent and 15 percent of the total sample, respectively. Parents classified 71 percent of children as Black and White and 6 percent of children as “other,” which in the IPUMS refers to “any race not listed in the available data in a given year” (IPUMS USA n.d.-b). We exclude children who indicated other types of combinations such as White and Asian, Black and Asian, or other categories that included more than just Black and White.
Household Racial Makeup
This variable indicates whether children are classified as all only White (1), all only Black (2), all Black and White (3), all other (4), or children labeled differently (5).
Concentrated Disadvantage
A factor analysis of six standard items used to measure concentrated disadvantage revealed two separate types of disadvantage. One cluster was associated with labor market disadvantage and is characterized by lack of employment in high-wage occupations, high employment in low-wage occupations, and few people with bachelor’s degrees. The labor market disadvantage index is an average of the z scores of those three variables. The second cluster was associated with family poverty and is characterized by the percent of female-headed households, percent of the population that is unemployed, and percent of families living below the poverty line. The family poverty disadvantage index is an average of the z scores of those three variables.
Anti-Black Political Context
We operationalized anti-Black political context in two ways. First, we calculated the Black-White poverty ratio by dividing the Black poverty rate by the White poverty rate (O’Connell 2012). Thus, a ratio of 1 refers to equal rates of poverty, and a ratio of 7 would signify that the Black poverty rate was 7 times greater than the White poverty rate.
Second, we estimated the average percentage Republican. We calculated the average of 2012, 2016, and 2020 estimated Democratic votes using data from Warshaw and Tausanovitch (2022). We subtracted the average Democratic votes from 1 to obtain the estimated Republican votes. Although this measure is imperfect because it does not account for third-party votes, our measure adequately operationalizes a general political climate. The measure is averaged over three presidential election cycles, thus softening the effect of year-to-year fluctuations in third-party votes, which have gotten about 1.7 percent, 6 percent, and 2 percent, and in 2012, 2016, and 2020 respectively (DeSilver 2024; Igielnik, Keeter, and Hartig 2021; Wooley and Peters 2025). Third-party votes are more common in areas where the races are not close (Berman and McGill 2016), and therefore should not significantly affect our overall results. Nevertheless, as a robustness check, we re-estimate our models with average % democratic votes as the independent variable, and the tables are included in the appendix (Tables A1 and A2). The results are as expected and in line with our existing findings – in more democratic areas, parents are less likely to label their kids singularly Black relative to White & Black relative to less democratic areas. Results related to other independent variables remain unchanged.
Covariates
We account for several individual and contextual factors that extant literature has identified as relevant to racial classification. These include individual-level measures for age (average = 6.53 years), and sex (49 percent female). Household-level measures include mothers’ race (25 percent of children have Black mothers), household income (average = $98,713), and mothers’ education level is measured as a continuous variable in the models ranging from 1 = did not finish high school to 4 = college graduate. Finally, we include several area-level characteristics such as total population of the closest metropolitan or micropolitan area (average = 3,440,000), population density per square mile (average = 3,958), and the percentage of the population that is Black (average = 17 percent). Dummy variables for each of the nine census regions and divisions are omitted from the models because of high levels of multicollinearity with one of our key independent variables, average percentage Republican.
Analytical Strategy
To estimate whether and how exclusionary economic contexts and anti-Black political contexts shape the racial classification of Black-White children, we specified a series of multinomial logistic regression models with a four-category outcome variable: Black, White, Black and White, and other. Because Black and White is the most common choice, we use it as a reference category. For clarity and simplicity we omit the outcomes for “other” in the tables and figures. All analyses include person-level weights provided by the ACS and account for the stratified design of the sample. In all models, standard errors are clustered at the household level and the PUMA level.
Model 1 estimates the baseline associations between our measures of disadvantage and racial classification of children. In model 2 we add controls for individual and family characteristics associated with racial classification, and in model 3 we add area-level controls. We repeat this process in models 4, 5, and 6 for our measures of anti-Black political context. Then, in model 7 we show the full model in which we estimate the association between all of our independent variables and outcome variables with all individual, family, and area-level controls.
Our models test the following conflicting hypotheses:
Hypothesis 1: Compared with parents in more prosperous areas, parents in disadvantaged areas are more likely to label their children only White.
Hypothesis 2: Compared with parents in more prosperous areas, parents in disadvantaged areas are more likely to label their children as only Black
Hypothesis 3: Compared with parents in inclusive political contexts, parents in anti-Black political contexts are more likely to label their children only White or Black and White
Hypothesis 4: Compared with parents in inclusive political contexts, parents in anti-Black political contexts are more likely to label their children only Black
Results
Our results show that compared with more advantaged areas, parents who live in labor market–disadvantaged areas are more likely to classify their children as only White relative to Black and White. These findings, shown in Table 4, support hypothesis 1, that living in a disadvantaged areas prompts distancing from Blackness. Labor market disadvantage is not significantly associated with whether parents classify their children as only Black relative to Black and White; therefore there is no evidence in this study for the conflicting hypothesis 2, that relative to more prosperous areas, parents in labor market–disadvantaged areas would more likely classify their children as only Black. Family disadvantage is significantly associated with lower only White and higher only Black racial classifications in model 1 and model 2, but these associations are no longer significant after accounting for area-level characteristics in model 3, suggesting that the relationship we observe between family disadvantage and racial classification is likely a result of confounding factors.
Estimating Racial Classification of Children Younger Than 15 Years: Disadvantage.

Note: Multiracial (Black and White) is the reference group in all categories. Exponentiated coefficients are relative risk ratios; values in parentheses are t statistics.
p < .10. *p < .05. **p < .01. ***p < .001.
To illustrate the association between labor market disadvantage and racial classification of children, Figure 1 shows the predicted probabilities of racial classification at specified levels of labor market disadvantage (generated from model 3). Figure 1 shows that in the most advantaged areas (i.e., labor market disadvantage of −4.5), parents’ predicted probability of classifying children Black and White is about 0.69, compared with 0.02 for only White. In contrast, in the most disadvantaged areas, parents’ predicted probability of classifying children Black and White is about 0.66, and only White is 0.2. This shows that as labor market disadvantage increases, so do only White racial classifications. The opposite is also true, that in the most advantaged areas, parents are significantly more likely to classify their children as only Black.
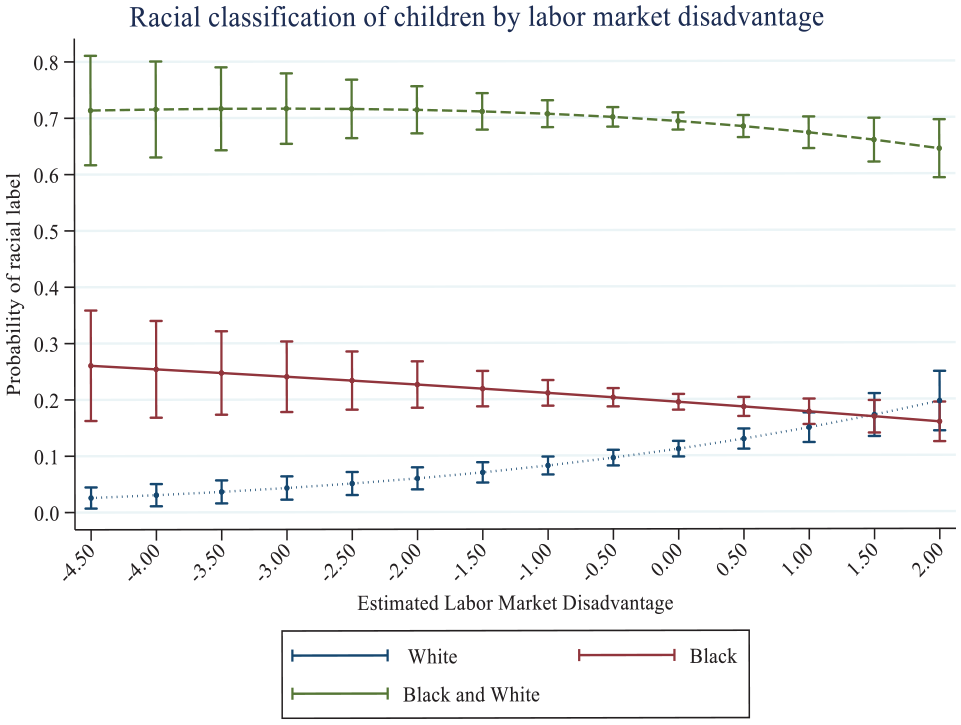
Predicted probability of racial labels by labor market disadvantage.
The association between anti-Black political context and racial classification depends on model specifications: the baseline association in Table 5, model 4, shows that that compared with parents in Democratic areas, parents in Republican areas are more likely to classify their children as only White relative to Black and White. This association holds although decreases in magnitude after controlling for individual and family characteristics in model 5, and area characteristics in model 6. However, after controlling for measures of disadvantage in model 7, parents in Republican areas are more likely to classify their children as only Black. This suggests that the association between average percentage Republican and racial classification was masked by measures of labor market disadvantage. These findings are aligned with previous literature suggests that official anti-Black laws such as Jim Crow laws consolidated Black identity in the United States (Marx 1998), and that contemporary legacies of slavery such as state-level interracial marriage bans encourage parents to classify their biracial children as only Black (Bratter and O’Connell 2017). These findings therefore offer support for hypothesis 4, that a hostile political context consolidates Black identity, resulting in higher rates of parents classifying their children as only Black. There is no evidence that parents in Republican areas are more or less likely to label their children as only White relative to Black and White, and therefore we do not have evidence to support hypothesis 3.
Estimating Racial Classification of Children Younger Than 15 Years: Anti-Black Political Context.

Note: Multiracial (Black and White) is the reference group in all categories. Exponentiated coefficients are relative risk ratios; values in parentheses are t statistics. Models in this table have a lower n because percentage Republican is missing for some observations.
p < .10. *p < .05. **p < .01. ***p < .001.
Our other measure of anti-Black political context, the Black-White poverty ratio, is not significantly associated with how parents racially classify their children. Because the Black-White inequality in poverty is one of the clearer ways to operationalize how legacies of slavery manifest in contemporary life (O’Connell 2012), it is somewhat surprising that it is not significantly associated with how parents racially classify their children. However, these areas may be highly racially segregated and therefore the single-race neighborhood context might be more influential in shaping racial classification than the fact that there is racial inequality in poverty.
Figure 2 shows predicted probabilities of racial classifications from the full model (model 7) at specified shares of Republican votes. Visualizing the data in this way clearly shows our findings. At the lowest level of Republican votes, the predicted probability of an only Black classification is 0.16, compared with multiracial labels, which is about 0.73. In areas with the highest shares of Republican votes, the predicted probability of labeling children only Black is about 0.27, and the predicted probability of labeling children multiracial is about 0.64. Thus the gap between multiracial and only Black labels is wide in Democratic areas and narrows as areas become more Republican.

Predicted probability of racial labels by average share of Republican votes, 2012 to 2022.
There may be some concerns that household-level indicators are inflated because of children who have multiple siblings within the household. We account for this in the model design that accounts for clustering at the household level as well as the PUMA level. In addition, we reestimated all the models with a household-level income examining whether households labeled their children (1 = all White, 2 = all Black, 3 = all White-Black, 4 = all other, 5 = children labeled differently, using 3 = all children White-Black as the reference category). Like the previous set of models, Table 6 shows that compared with parents in more advantaged areas, parents in labor market–disadvantaged areas are more likely to classify all their children as only White relative to classifying all their children Black and White. Compared with parents in Democratic areas, parents in Republican areas are more likely to classify all their children as only White and only Black relative to classifying all their children as Black and White. Although this potentially undermines hypothesis 4 that biracial families will practice “armoring” in anti-Black political contexts, it supports the more general argument that anti-Black contexts reify or brighten racial categories, whereas more inclusive contexts mollify or blur them. Nevertheless, Figure 3 illustrates that although the predicted probabilities of all White labels increases in more Republican areas, it is overshadowed by increasing predicted probability of all Black labels from low- to high-Republican areas. One additional finding from model 8 is that families with more children (i.e., with a higher number of siblings) are more likely to label their children differently than each other. This is expected because the higher number of siblings provides more chances of different classifications, and higher likelihood of larger age gaps (i.e., where the older child may be classified as a single race but the younger child as two races). The predicted probabilities shown in Figures 3 and 4 clarify these associations.
Estimating Racial Classification of Children Younger Than 15 Years: Full Model.
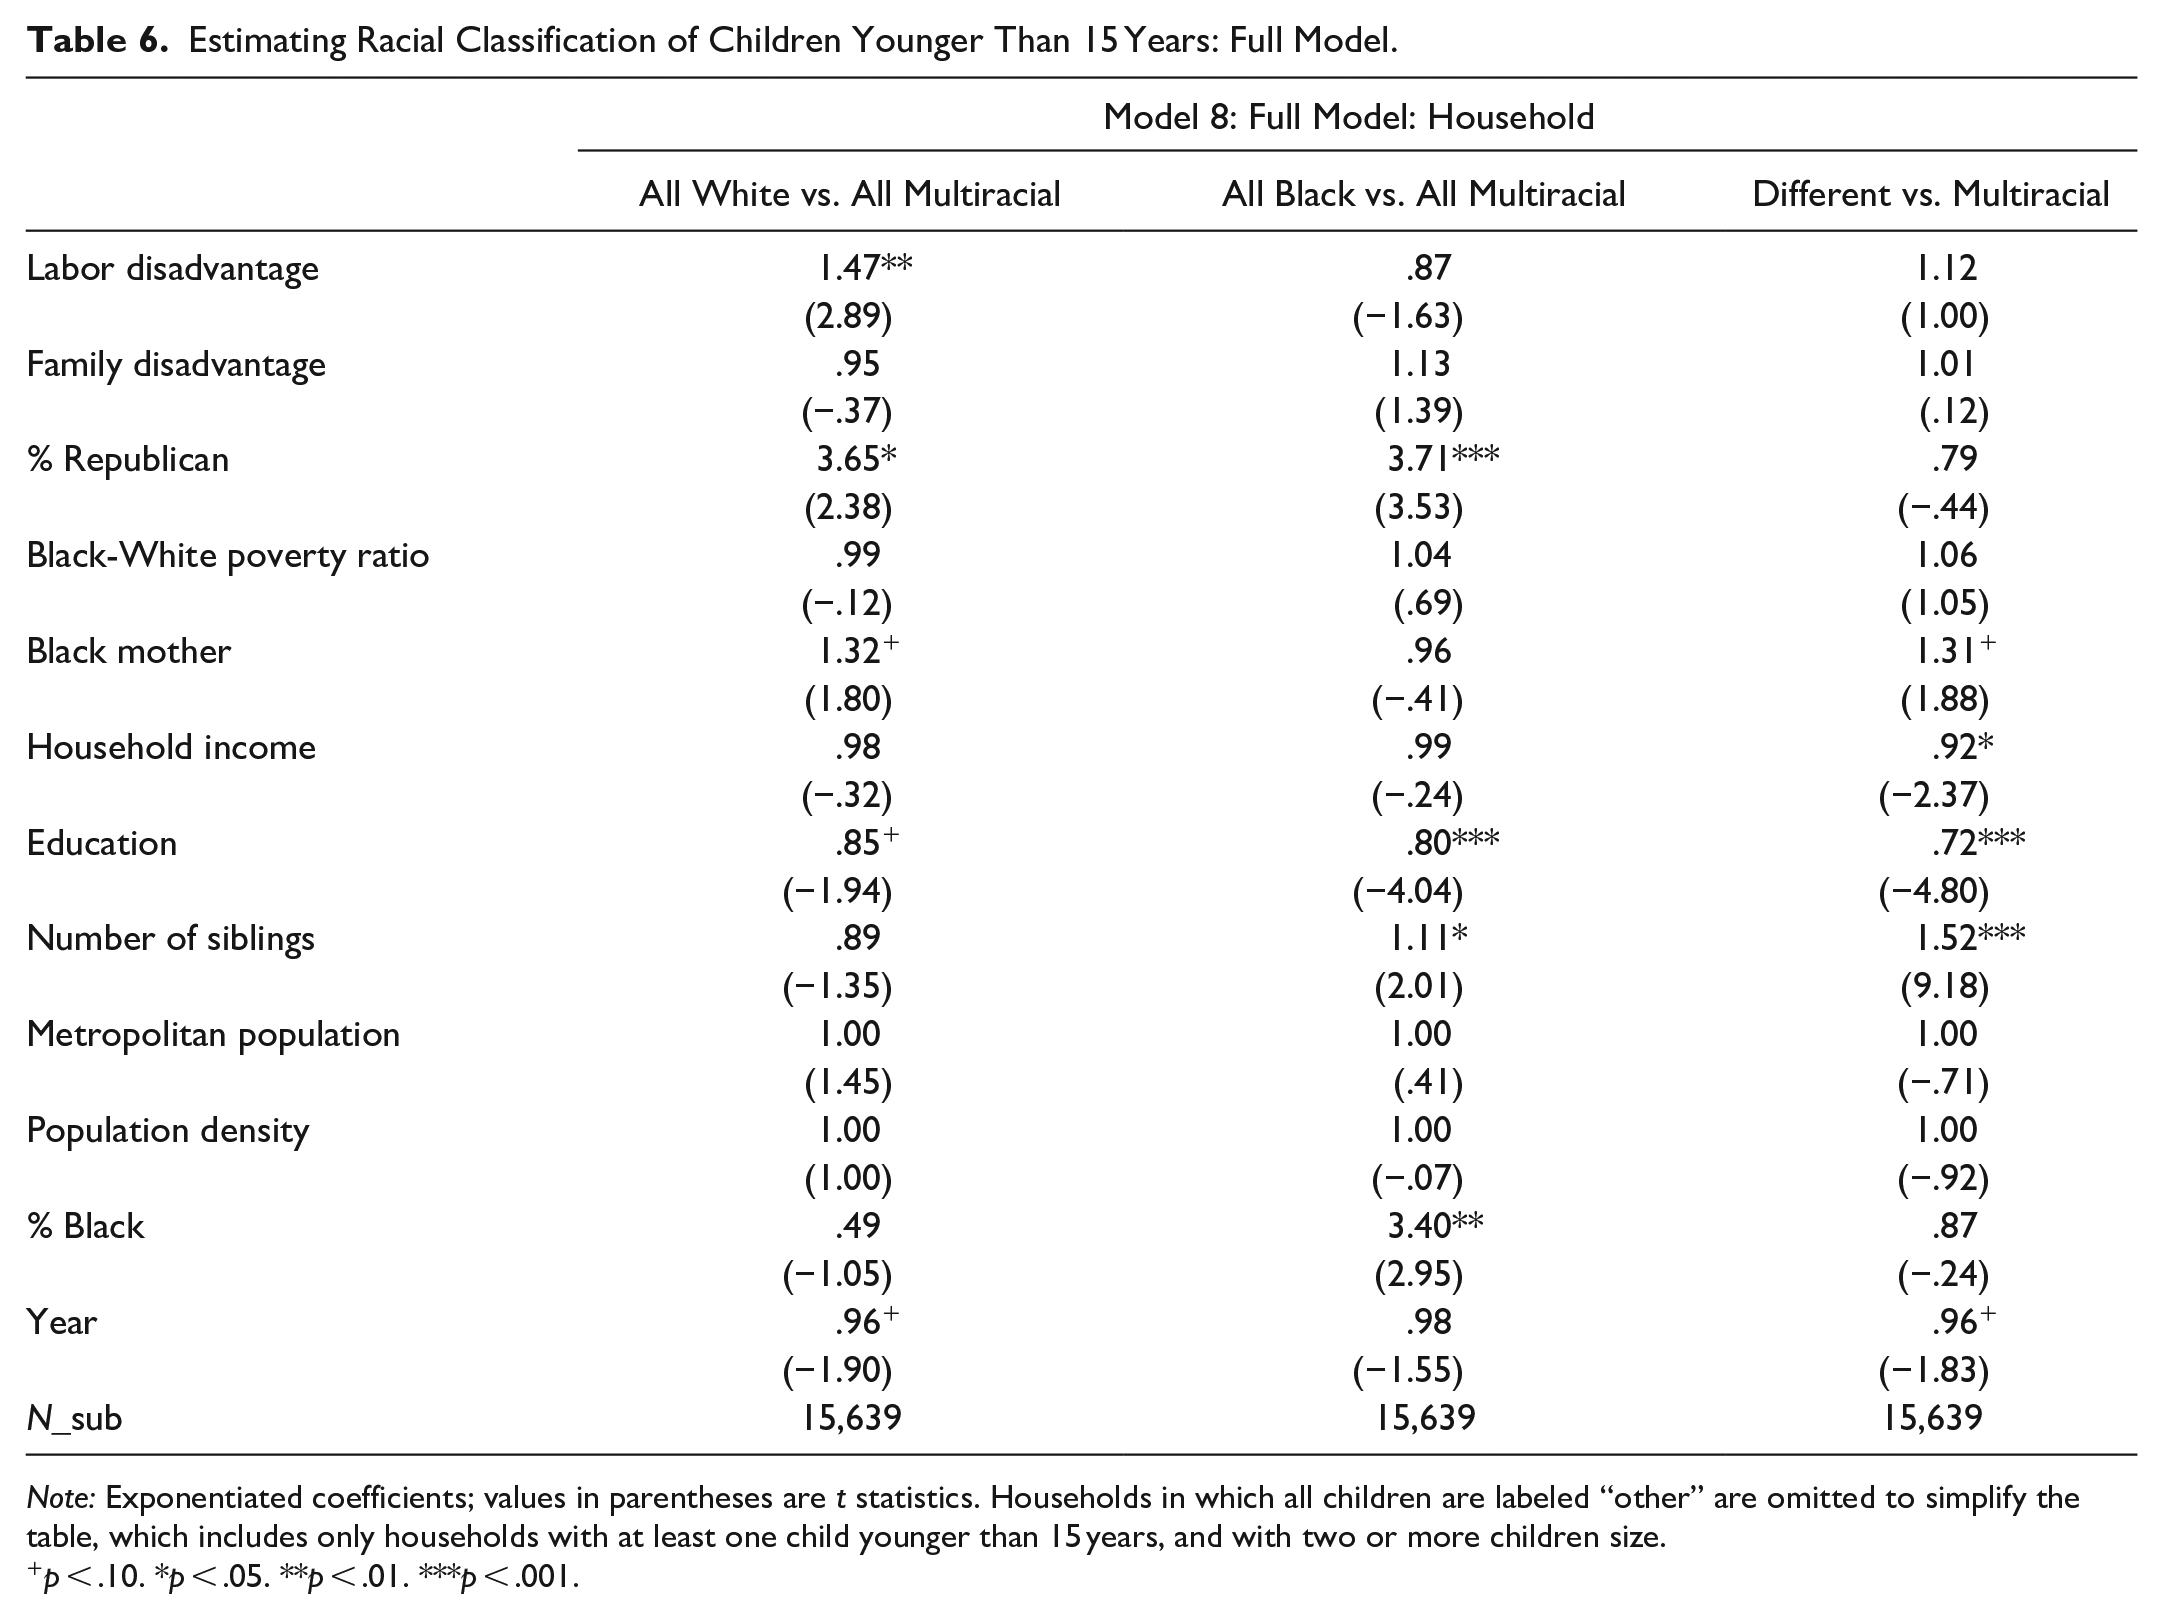
Note: Exponentiated coefficients; values in parentheses are t statistics. Households in which all children are labeled “other” are omitted to simplify the table, which includes only households with at least one child younger than 15 years, and with two or more children size.
p < .10. *p < .05. **p < .01. ***p < .001.

Predicted probability of household racial labels by labor market disadvantage.

Predicted probability of household racial labels by average share of Republican votes.
In addition to the main findings of our study, our findings confirm previously established associations between individual and household characteristics and racial classification of children. These statistically significant coefficients are consistent across models, suggesting that social and political variables central to this study are effects above and beyond established individual- and family-level covariates. Models in Tables 4 and 5 show that as children get older, parents are more likely to classify them as only White and only Black relative to Black and White. One interpretation, that aligns with previous research, is that as children get older, participate in school, and extracurricular activities, they will “adapt their identities to meet societal expectations, as years of being ‘corrected’ about their racial identities take a toll” (Harris and Sim 2002:622). At the same time, Davenport (2016) argued that rather than being a consequence of age, increasing intermarriage rates paired with increasing use of multiracial labels can be understood as “transformative cohort effect” (p. 78), meaning that younger cohorts of children are increasingly being classified as Black and White in response to shifts in racial classification practices over time. Indeed, the coefficients for year, measured as a continuous variable from 2012 to 2022, are all statistically significant and less than 1, suggesting that with each passing year, parents are less likely to classify their children as only Black or only White relative to Black and White.
In alignment with previous research that biracial women are more likely to self-classify as multiracial than men (Davenport 2016; Loblack 2024), our findings show that parents are more likely to classify their daughters Black and White than their sons. Also in alignment with existing research, more highly educated parents are more likely to classify their children as Black and White relative to single race labels (Davenport 2016; Portes 1984; Qian 2004; Roth 2005). In general, mixed-race households have higher levels of education than average American households (Alba 2020; Williams 2010), especially families included in most studies that require two parents in the household (Alba 2020). Previous empirical and theoretical work suggests that parents with higher education are “likely to have a deeper knowledge of the history of group relations, and an ability to think outside the lines commonly drawn by society” (Roth 2005:9) and thus may be more likely to embrace minority and multiple race identities (Portes 1984; Qian 2004). Finally, in this study, parents with higher household income are more likely to classify their children as Black and White relative to only White (but not relative to only Black). These findings somewhat contradict previous research showing that, in terms of self-classification, family income and median family income by ZIP code “whitens” how college freshman identify themselves on a survey taken in 2001, 2002, and 2003 (Davenport 2016).
Discussion and Conclusion
Social scientists and demographers have long been interested in the formation and dissolution of racial and ethnic boundaries. A robust body of work has demonstrated that racial self-identity and racial classification by others can vary by a number of individual, family, and contextual level factors (Bratter and Heard 2009; Brunsma 2005; Davenport 2016; Holloway et al. 2012; Lichter and Qian 2018; Roth 2005). Furthermore, research shows that life-course events that signal upward or downward mobility have the potential to “lighten” or “darken” the way one identifies and the way one is perceived (Saperstein and Penner 2012). Subnational analyses have highlighted the importance of sociopolitical context for racial labeling practices, showing that histories of slavery (Liebler and Zacher 2016) or history of one-drop legal mandates (Bratter and O’Connell 2017) have consequences for how contemporary biracial families label their children, and state-level partisanship has consequences for how people racially classify themselves (Mason 2017).
By examining the role of local socioeconomic and political context at a more granular level, in the present study we contribute to existing work on the politics of racialization in four key ways.
First, by showing that racial classification shifts across contexts, this study joins a body of work interrogating the widely held perception that race is an intrinsic and static characteristic. Although scholars for the most part agree that race is socially constructed, and that race “was constructed as a hierarchical human-grouping system, generating racial classifications to identify, distinguish and marginalize some groups across nations, regions and the world” (National Human Genome Research Institute n.d.), social scientists continue to use race as an independent variable intended to account for or hold constant characteristics assumed to be unchanging within racial groups. This study therefore confirms and extends existing findings that race is highly flexible and politicized and should be treated as such.
Second, because changes in official census-determined categories reflect changes in prevailing beliefs about society (Hickman 1996; Lee 1993), understanding processes of racial categorization provides important insight to the meaning that people attach to these labels. The findings of this study suggest that holding all other variables constant, parents will more likely classify their children as only White in an labor market–disadvantaged areas, meaning that “Whiteness” is (still) seen as an escape hatch (Saperstein and Gullickson 2013), as an attempt to access higher social strata in a disadvantaged context. At the same time, in more advantaged labor market contexts, parents have a much higher relative risk for classifying their children as only Black.
There is some tension here about whether the only Black classification is a reflection of security and pride, as it may seem in more advantaged labor market contexts, or if the only Black classification is a result of armoring, a protectiveness in response to a hostile context as identified in this study and others (Bell and Nkomo 1998; Brunson and Weitzer 2011). It is possible that both hostile and highly supportive contexts shape racial labels in the same direction, but the mechanisms prompting these patterns of racial classification can differ. For instance, children of Black and White couples who attend historically Black colleges and universities, arguably one of the most supportive contexts for young people of color, have a stronger Black racial identity at the end of college relative to the beginning, having had the space, time, education, and social support to claim blackness as a source of unity and pride (Clayton 2020). Paradoxically, children of Black and White couples who attend historically White colleges and universities also graduate from college with a stronger Black identity than when they started (Clayton 2020). However, biracial students at historically White colleges and universities connect more with their Black identities a result of social exclusion and being labeled as non-White by their White peers (Clayton 2020).Thus the classification as Black can be the result of two opposing mechanisms, and may exist within the same person in different contexts, mechanisms that can and hopefully will be untangled in future research. Racial labeling practices may be best understood as a kaleidoscope that shifts depending on how political, economic, and family contexts align.
Third, we contribute to a broader theoretical conversation about racial and ethnic boundaries in U.S. society and what this might mean for stratification along the lines of race, ethnicity, and color. A contemporary debate is how increasing interracial unions, and their children, may be reshaping the boundaries and hierarchies associated with ethnic/racial self-identity and racial classification by others (Alba 2020; Bonilla-Silva 2004; Sue 2009; Treitler 2013). On the one hand, Alba (2020) argued that immigrants and mixed-race children and young adults are increasingly assimilating into mainstream middle- to upper-class White culture, especially in larger and more diverse cities. By doing so, this new generation of mixed-race people and children are blurring race and color boundaries in a way that will create a more cohesive and egalitarian society. Alba admitted that this blurring of racial/ethnic boundaries has not benefited dark-skinned African Americans, who continue to face severe systemic racism and interpersonal discrimination. On the other hand, Treitler (2013) and other race theorists have argued that the upward mobility of immigrants and mixed-race people is, in part, dependent on the exclusion of an out-group. In this case the out-group is African Americans and people with mixed Black and White ancestry. Thus, this phenomenon reifies racial hierarchies that keep dark-skinned Black people firmly at the bottom rungs of society.
Our analysis shows that in predominantly Democratic areas and, separately, in areas with more labor market opportunities, parents are more likely to label their children Black and White relative to a single race. This is in line with Alba’s (2020) argument that in certain regions of the country that are characterized by more diversity and higher incomes, race and color boundaries may blur. However, in predominantly Republican, and in areas with fewer job opportunities, parents are more likely to label their children only Black and only White, respectively. If we consider that mixed-race labels are an indication of blurred boundaries, and that single race labels are an indication of bright boundaries, then our analysis suggests that ethnic/racial boundaries may blur and brighten accordingly. Thus, the extent to which assimilation and integration into upper middle class White culture is possible or desirable may depend on political and socioeconomic context.
Finally, racial identity both shapes and is shaped by political behavior (Agadjanian and Lacy 2021). Changing racial identities might have consequences on the outcomes of local, regional, and national elections. In 2020, 95 percent of Black women voted for the Democratic Biden-Harris ticket (Igielnik et al. 2021). Although Black men voted less firmly Democratic than Black women, they still cast more than twice as many votes (87 percent) for Biden-Harris than their White men counterparts (40 percent) (Igielnik et al. 2021). What does it mean that younger cohorts with one Black parent and one White parent are increasingly classified as Black and White? Will the Democratic party lose these votes, as people of color who identify as partly White start voting and engaging politically more like their only White counterparts? Davenport (2018) suggested that multiracial people tend to be more politically liberal than their single-race counterparts. However, because the Black vote is so heavily Democratic, it is unlikely that people who identify as Black and White (rather than only Black) will vote for the Democratic party at higher rates. The Pew Research Center reported that 73 percent of Black-White biracial people “lean democrat” (Lopez et al. 2015:6). This is significantly lower than the only Black population. It may lend some credibility to early fears expressed by the NAACP that a multiracial category would dilute Black numbers and therefore Black voting power and voting interests (Williams 2010:9).
Additionally, there are some interesting findings related to gender. Like other research, we find that parents are more likely to classify their sons as a single race and more likely to classify their daughters as multiple races (i.e., Black and White). Although this can be potentially understood as parents “armoring” their sons more than their daughters, we see that parents are more likely to label their sons only White was well. This is an interesting pattern that can be explored in future research, and could potentially be connected to political attitudes. Although there are debates about the magnitude, there is evidence that boys and young men are more likely to adhere to conservative ideology than girls and young women (Gallup 2024; Gillion, Ladd, and Meredith 2020; The Survey Center on American Life 2022; Twenge 2023).
Moving forward, we should continue to interrogate whether and to what extent political and social context shapes the construction of racial categories and, in turn, how these changing categories may strengthen or erode racial justice movements in the United States.
Footnotes
Appendix
Estimating Racial Classification of Children Younger Than 15 Years: Full Model.

| Model 8A: Full Model: Household | |||
|---|---|---|---|
| All White vs. All Multiracial | All Black vs. All Multiracial | Different vs. Multiracial | |
| Labor disadvantage | 1.47** | .87 + | .86 |
| (2.89) | (−1.67) | (−.98) | |
| Family disadvantage | .94 | 1.14 | 1.00 |
| (−.41) | (1.41) | (−.04) | |
| % Republican | .29* | .26*** | .62 |
| (−2.41) | (−3.53) | (−.72) | |
| Black-White poverty ratio | .99 | 1.05 | 1.02 |
| (−.08) | (.79) | (.31) | |
| Black mother | 1.32 + | .96 | 1.25 |
| (1.81) | (−.41) | (1.45) | |
| Household income | .99 | 1.00 | .99 |
| (−.21) | (−.03) | (−.06) | |
| Education | .83* | .79*** | 1.10 |
| (−2.24) | (−4.49) | (1.13) | |
| Number of siblings | .88 | 1.10 + | .90 |
| (−1.41) | (1.85) | (−1.17) | |
| Metropolitan population | 1.00 | 1.00 | 1.00 |
| (1.44) | (.38) | (.04) | |
| Population density | 1.00 | 1.00 | 1.00 |
| (.93) | (−.12) | (−.31) | |
| % Black | .49 | 3.44** | 3.67* |
| (−1.06) | (2.96) | (2.29) | |
| Year | .96 + | .98 | 1.02 |
| (−1.89) | (−1.53) | (.87) | |
| N_sub | 15,639 | 15,639 | 15,639 |
Note: Exponentiated coefficients; values in parentheses are t statistics. Households in which all children are labeled “other” are omitted to simplify the table, which includes only households with at least one child younger 15 years, and with two or more children size.
p < .10. *p < .05. **p < .01. ***p < .001.
Acknowledgements
Special thanks to Karen H. Lee for continuous feedback on many drafts of this manuscript. Thank you to Jenifer Bratter and Heather A. O’Connell for early conversations troubleshooting challenges in studying racial identity and racial labels. Rod Brunson and Robert Reece, thank you for closely reading the manuscript and for offering critiques and suggestions on framing and theory. Finally, thank you to the IPUMS office hours team for their availability in talking through opportunities and limitations of IPUMS data.