
Abstract
In this study, I examine the role of household income in determining White-Black, White-Latino, and White-Asian residential segregation in the twenty-first century across 50 metropolitan areas over the decennial time points from 2000 to 2020. I use census and survey microdata and a reformulation of the separation index, a measure of the segregation dimension of evenness, to situate segregation as a group inequality that can be analyzed using group-specific household-level regression models and regression standardization analysis, where household income is the predictor of segregation-relevant neighborhood outcomes. I find that across groups, across communities, and over time, the role of household income in shaping segregation patterns varies widely. White-Black segregation is lowest between high-income households and is declining consistently for all income groups, even at mismatched incomes. White-Latino segregation patterns are more inconsistent, with segregation staying low and stable for high-income Latino households but rising somewhat for low- and middle-income households. Finally, White-Asian segregation is rising and has risen the fastest for high-income Asian households. These findings call for continuing investigation into the shifting and interlocking dynamics of race and income that shape segregation outcomes.
Keywords
The purpose of this study is to analyze the roles of race and income across the decennial census years 2000, 2010, and 2020 in shaping White-Black, White-Latino, and White-Asian residential segregation patterns in a selection of metropolitan areas of the United States. Racial residential segregation is common in metropolitan settings, often taken for granted as a feature of American urban life. Social scientists have spent decades attempting to measure and analyze residential segregation levels and patterns, typically using census data to summarize the extent to which populations are unevenly distributed across neighborhoods and to predict the characteristics of the neighborhoods where households of different racial and ethnic groups may reside (e.g., Alba and Logan 1993; Crowell and Fossett 2018, 2020, 2022, 2023; Frey 2018; Iceland 2014; Iceland, Weinberg, and Steinmetz 2002; Lichter et al. 2010; Massey and Denton 1985, 1993; Taeuber and Taeuber 1965). By doing so, we know more about the extent to which households continue to residentially sort by race, which is seen as a tangible indicator of broader racial dynamics. We also understand much about the related factors that drive these sorting patterns, such as group differences in socioeconomic status, preferences, and discrimination—including how these factors are related to both opportunities and barriers.
What this study contributes are new and updated empirical findings on race and income residential segregation driven by an innovative methodological approach. This study addresses the following questions: What effect does household income have on racial residential segregation outcomes in the twenty-first century? And to what extent does this vary across groups? These questions are necessary for maintaining a contemporary focus on the explanations behind shifting but persistent racial residential segregation in metropolitan areas. As a review of the literature shows, understanding the intersecting roles of income and race in residential segregation patterns is complex, and varying study designs have led to a multitude of conclusions on the subject. This study adopts a straightforward approach to describing and predicting levels of segregation by race and household income. Therefore, this study also offers a methodology for measuring the effects of income differences on racial residential segregation through innovative techniques for measuring and analyzing segregation that includes reformulating a popular measure of segregation into a measure of inequality and applying regression standardization to residential segregation analysis. These methods make it possible to parse out racial residential segregation at varying income levels across groups and over time.
Previous Research on Race and Income Segregation
Traditions in the Study of Residential Segregation Patterns
Studies continue to find that race is a strong predictor of residential location, especially for Black households (Crowell and Fossett 2022, 2023; Kucheva and Sander 2018; Massey 2020). This consistent finding supports the hypothesis of place stratification, wherein residential patterns are a spatial manifestation of institutional racism and racially minoritized households have hindered access to predominantly White and advantaged neighborhoods (Charles 2003, 2006; Logan 1978). However, the barriers to accessing White neighborhoods are understood to be permeable with income and wealth so that socioeconomic status can also shape the extent to which racially minoritized households have residential contact with White households. The role of socioeconomic status, in addition to other factors more relevant to populations affected by immigration, such as language and nativity, are central to the spatial assimilation hypothesis, which argues that racially minoritized households can anticipate having more residential contact with White households as their social distance from White households, based on these factors, is reduced (Alba and Logan 1993; Charles 2003; Iceland and Scopilliti 2008; Massey and Denton 1985; South, Crowder, and Pais 2008).
With over half a century of fair housing laws shaping housing policy, development, and housing opportunities, we may expect the spatial assimilation hypothesis to take primacy in explaining the trajectory of residential segregation patterns. However, racism holds a living legacy in our communities, and the effect that it has had on residential patterns has proved durable because of how life opportunities and intergenerational outcomes are strongly determined by where we live. Therefore, a focus on race and income segregation in the twenty-first century is necessary for understanding what challenges our society continues to face and what progress we can claim to have made toward racial integration and equality.
Many prior studies have made efforts to answer the questions posed by this study. Indeed, the segregation literature has largely been driven by a desire to understand how race and income variously affect residential outcomes and shape residential segregation patterns. These studies generally follow one of two approaches. The first is to conduct community-level analyses where levels of segregation are predicted based on some measure of income inequality, such as the Black-White household income ratio. However, these studies place the role of income differences at the incorrect level of analysis, creating an ecological fallacy that can lead to overestimations of the effect of income inequality. To further explain this point, residential segregation is also a stratification outcome with related contributing factors (i.e., structural racism) that determine both racial inequalities in income and residential location (Fossett 1988; Fossett and Crowell 2018). The second approach is to estimate locational attainment models, which use characteristics of the household, such as income and nativity, to predict household-level neighborhood outcomes. These studies are highly informative, but many stop short of connecting locational attainment models to overall segregation patterns, making it difficult to understand how segregation is actually formed by these micro-level processes. The analytical techniques I use in this study are an advancement of the described approaches and can establish a direct quantitative link between individual (i.e., household) locational attainments and overall residential segregation patterns (Crowell and Fossett 2022, 2023).
Patterns of Racial Residential Segregation over Time
In general, studies focused on racial residential segregation have found that White-Black segregation is highest among comparisons involving segregation from White households (Crowell and Fossett 2023; Frey 2018; Iceland 2014; Iceland et al. 2002). Black segregation, especially in urban environments, is the result of a legacy of institutionalized discrimination that prohibited Black families from residing in White neighborhoods and consequently forced the devaluation of segregated Black neighborhoods. Thus, due to the historical exclusion of Black households from homeownership and racist practices in the housing market (Rothstein 2017; Taylor 2019), White-Black segregation is found at persistently high levels in urban areas (Massey 2020; Massey and Denton 1993). However, most recent studies find that White-Black segregation is declining over time in all regions of the United States (Crowell and Fossett 2023).
White-Asian and White-Latino segregation are found at low to moderate levels that have remained stable or slightly risen over time across the United States (Crowell and Fossett 2023). Due to the arrival of millions of Latino and Asian immigrants to urban areas in the latter half of the twentieth century, the residential patterns of these groups are more varied and fluid. Ethnic enclaves have emerged where immigrants can speak a shared language with their neighbors and find businesses and institutions that cater to their needs. Discrimination is also prevalent, particularly for immigrant groups that arrive with less socioeconomic resources. These groups are also more likely to experience the outcomes highlighted by spatial assimilation theory—Latino and Asian households are more likely to enter White neighborhoods with gains in socioeconomic status and acculturation, and U.S.-born Latino and Asian households have more residential contact with White households than their foreign-born counterparts (Alba and Logan 1993; Crowell and Fossett 2022; Iceland and Scopilliti 2008).
The Role of Income in Racial Segregation
The spatial assimilation hypothesis emphasizes the argument that racial residential segregation should decline over time with declining income differences. At the micro-level, this means that racially minoritized households will have easier access to White neighborhoods with increasing income and other measures of socioeconomic status. Many studies have found some evidence of this occurring (Crowell and Fossett 2022, 2023; Iceland and Scopilliti 2008; Iceland and Wilkes 2006; Intrator, Tannen, and Massey 2016; Kucheva and Sander 2018; Massey and Fischer 1999; Massey and Mullan 1984; Sharp and Iceland 2013; Spivak and Monnat 2013; St. John and Clymer 2000). However, returns on income are not uniform across groups and contexts. Specifically, it has been repeatedly found that income gains are less impactful on Black segregation than they are for Latino or Asian segregation (Crowell and Fossett 2022, 2023; Freeman 2008; Intrator et al. 2016; Kucheva and Sander 2018; Massey and Fischer 1999; Massey and Mullan 1984).
Furthermore, the effect of income and class on racial residential segregation is not as simple as the spatial assimilation hypothesis would predict. For example, despite income gains generally lowering levels of White-Asian segregation, Kye’s (2023) recent study of Asian ethnoburbs found that White flight from neighborhoods where Asian households reside is more likely to occur in neighborhoods with higher levels of socioeconomic status. Racial effects can also mean that income segregation persists between groups even as racial segregation declines, as is the case when Alba, Logan, and Stults (2000) found that middle-class Black households are less racially segregated from White households but live among less affluent White households.
Finally, it is important to recognize that income segregation can occur independently of race, which is what we find when we observe segregation patterns within racial and ethnic groups. Wilson’s (1978) theory of the Black underclass hinges on this outcome, with its emphasis on the departure of the Black middle class from urban neighborhoods for understanding the rise in concentrated Black poverty. There is also more contemporary work on within-group income segregation. For example, studies by Reardon et al. (2018) and Logan et al. (2020) have both found rising income segregation among Black and Latino households. Nevertheless, there is ongoing debate about the concurrently active roles of race and income in producing segregation, with many arguing that race still holds primacy. Those who argue that race remains the ultimate barrier to integration can be represented by Jargowsky (1996:986), who wrote: “The primary organizing principles of the metropolis are race and ethnicity, not social class.” Yet income and class add complexity to White-minority segregation and segregation within groups. Income can explain patterns of segregation within groups and variable patterns and diverging trajectories of segregation from White households. Thus, although income equality is unlikely to solve the problem of racial residential segregation, the role of income undoubtedly remains important. In this present study, I detail the nuance and variability of race and income segregation that seem to be present throughout the literature.
Data and Methods
The data I use for this study come from multiple sources produced by the U.S. Census Bureau, including summary files from the decennial censuses for 2000, 2010, and 2020 and the 2000 census long-form survey, the 2006-2010 American Community Survey pooled sample, and the 2016–2020 American Community Survey pooled sample. The decennial censuses provide full-count population data, and the U.S. Census Bureau produces tabulations of the data at neighborhood-level geographies (known as Summary File 1), including race and ethnicity tabulations for census tracts. These data permit the accurate and reliable measurement of residential segregation free of sample bias by providing neighborhood-level data on racial composition from 100 percent population counts. This feature is critical for removing all sources of segregation index bias (Fossett 2017; Napierala and Denton 2017; Reardon et al. 2018; Wei, Knapp, and Rey 2023). The long-form census survey was a decennial survey administered during census years that collected data from a one in six sample of the U.S. population on detailed social, demographic, economic, and housing characteristics. It was last used in 2000, and the American Community Survey then took its place as an annual survey on 1 percent of the population.
The decennial long-form survey and the American Community Survey can be accessed as either microdata (Public Use Microdata Samples) or as summary files (referred to as Summary File 3 in 2000). Although the microdata provide detailed individual and household records with a wealth of information on income, occupation, education, nativity, language, and more, it has very limited geographic information. In the public-use files, one does not have access to neighborhood-level geographic identifiers for the household. The summary files do provide neighborhood-level geography, but as data tabulations, they contain only limited information on household characteristics. At best, one might be able to get a cross-tabulation of three or four variables in a summary file. A way to bypass these limitations is to access the restricted-use microdata files at a Federal Statistical Research Data Center, where the microdata contain neighborhood-level geographic identifiers. Indeed, previous locational attainment and residential segregation studies using the methods applied in the present study have done so (Crowell and Fossett 2018, 2020, 2022, 2023). However, there is a high barrier to accessing these files, and there is also utility in demonstrating what can be known from public-use files.
One set of summary tables in particular adequately serves the goal of understanding the role of income in racial residential segregation outcomes. For both the long-form decennial survey and the American Community Survey, there exist summary tables by race and ethnicity of the householder (non-Hispanic White, Hispanic, Black or African American, and Asian or Asian American) that tabulate households across sixteen income categories at the census tract level. I converted these tables into microdata by disaggregating the race and income tabulations so that both race and household income become variables and the unit of observation is the householder. 1 I then merged these microdata with decennial census data by census tract ID so that the racial composition of the householder’s neighborhood is also included as a variable. Data from these surveys that correspond to the same time points as the decennial censuses provide samples of householders who would be experiencing the neighborhood racial composition patterns captured in the decennial census. Thus, I merged data from the 2000 decennial census with data from the 2000 long-form survey, data from the 2010 decennial census with the 2006–2010 American Community Survey, and data from the 2020 decennial census with the 2016–2020 American Community Survey. I extracted these summary files from the National Geographic Historical Information System for ease of merging multiple data sources using a common geographic identifier (Manson et al. 2022).
For this study, I included the 50 largest core-based statistical areas based on 2020 population counts. These areas are all metropolitan areas, which are constructed using counties and by definition have an urban core with a population of at least 50,000. A benefit to only including these large metropolitan areas in this study is that even at the census tract level, residential segregation patterns are likely to be detectable for most of the area. Metropolitan areas are also beneficial for studying racial residential segregation in particular due to their diversity and claim to the largest share of the racially minoritized population of the United States. This makes them both representative of urban racial residential segregation patterns in the United States and less likely to be susceptible to segregation measurement bias.
Segregation Measurement
There is a common toolbox that segregation researchers use to understand the residential segregation patterns of communities. Dating back to Duncan and Duncan (1955), the typical practice is to produce a summary score of how racial groups are differentially distributed across spatial units (e.g., census tracts) in a community, the dimension of segregation that Massey and Denton (1988) identify as “evenness.” The most popular of these measures is the dissimilarity index (D), which indicates the percentage of one group in a pairwise analysis that would need to be redistributed across neighborhoods in order for every neighborhood to have the same racial composition as the community overall. An alternative pairwise measure of evenness, and the one used in this study, is the separation index (S). The separation index has a straightforward interpretation as well, with its score indicating the simple difference in each group’s average residential contact with White households (i.e., neighborhood percentage or proportion White). These indices are relatively easy to calculate, interpret, and explain, making them attractive for macro-level studies of residential segregation patterns across communities.
However, there is a key property of these indices that is not well appreciated or understood. Extensive research of these indices by Fossett (2017) reveals that these measures can be reformulated and reconceptualized so that rather than simply describing some macro-level pattern of population distributions, they are in fact measuring a difference in group means (e.g., how the separation index is described previously). This understanding is important because it reveals how segregation indices derive from individual (i.e., household) residential outcomes. Every pairwise index of segregation begins with individually scoring each household based on the composition of their neighborhood and is calculated by taking the difference in mean scores between the two groups in the comparison.
The separation index, as one might guess from its aforementioned description, is simple to calculate through the difference-of-means approach. The individual score given to each household is simply the pairwise proportion White in their neighborhood, and the index is obtained by again calculating the average score for each of the two groups in the analysis and taking the difference between the two. Other than having a straightforward calculation and interpretation, the separation index is the preferred measure of segregation in this analysis because of other attractive and superior properties regarding how it measures and recognizes patterns of unevenness that are not described here but can be found in Fossett (2017) and Crowell and Fossett (2023). The simple equation to calculate any segregation index using the difference-of-means approach is:

where Y1 is the average contact score (p) for the first group and Y2 is the average contact score (p) for the second group. The equation for the contact score is calculated differently for each segregation index. For the separation index, the contact score is calculated as
where n1i is the count of households belonging to the reference group (i.e., White households) in the analysis in the reference household’s spatial unit, or census tract, i, and n2i is the count of households belonging to the comparison group (i.e., Black, Latino, or Asian households) in the analysis in the reference household’s spatial unit. Thus, the calculation of p for the separation index is an appealingly simple pairwise proportion that includes a correction for index bias where the reference individual is removed from the calculation.
The dependent variable for the micro-models of locational attainments, therefore, is the pairwise proportion White in the neighborhood for the household (i.e., the household-level component used to calculate the separation index). This is calculated using 100 percent population data from the decennial census, thereby avoiding complications of sample bias in the measurement of neighborhood racial composition, which could affect the resulting segregation score (Napierala and Denton 2017). When this outcome is predicted in group-specific models, the difference in the predicted group means will reproduce the separation index, 2 and it is possible to perform regression standardization to generate segregation score predictions at various group-specific income levels.
Independent Variables: Race and Household Income
There is one primary independent variable in this study, which is household income. These data come from summary tabulations from the 2000 decennial long-form and the 2006–2010 and 2016–2020 American Community Surveys. The summary tabulations are provided by race and tabulate households across 16 income categories. After converting these data into microdata, I assigned the midpoint value in dollars of the income category that each householder is in, and then I applied a log transformation to normalize the distribution of income across the data. Finally, because cost of living varies across communities and communities have different economic conditions, I ranked households into deciles based on income so that household income is measured as a relative position on a scale that is standardized across communities. I treated this percentile variable of household income as an interval variable in the regression analysis.
The second variable accounted for is race, which is captured by estimating group-specific models so that the effect of income on average neighborhood-level contact with White households can be estimated separately by racial group. It is also feasible to estimate a combined model and include an interaction between race and income, but group-specific models are preferable for ease of presentation and interpretation and to more efficiently facilitate regression standardization, which is described more in the following.
Modeling Approach
The dependent variable, which is neighborhood pairwise proportion White, is modeled using fractional regression. Although other segregation studies typically use linear regression, fractional regression is a superior modeling technique because it models the mean of proportional outcomes on a logit curve and restricts predictions within the bounds of 0 and 1, inclusively (Crowell and Fossett 2023; Kieschnick and McCullough 2003; Papke and Wooldridge 1996). For segregation research, where the measure of segregation is scaled between 0 and 1 and the minimum and maximum values are true end points that represent racially homogeneous neighborhoods, keeping model-based predictions within these bounds is critical for estimating effects and for performing regression standardization. Thus, for each metropolitan area in each year, I estimated fractional regression models with the household as the unit of observation where household income is the predictor variable and the outcome variable is neighborhood pairwise proportion White. From these models, I generated predicted mean values on neighborhood pairwise proportion White. The group-specific means of these predicted values can be used to calculate the separation index at its observed value for the metropolitan area by taking the simple group difference in average neighborhood pairwise proportion White between White households and the racially minoritized households in the comparison.
Regression Standardization and Decomposition Analysis
In addition to reproducing the observed segregation index for each group comparison in each metropolitan area, I also draw from a popular methodological toolbox in demographic research to further explore the effect of income on racial residential segregation—regression standardization analysis. Regression standardization analysis has a long tradition in demographic research (Kitagawa 1955) and makes it possible to gain insights into the factors that determine segregation outcomes, including the micro-level role of household income. The procedure involves comparing observed segregation outcomes to predicted outcomes when one or both groups in the analysis are standardized to a particular distribution on the independent variables. In segregation research, this approach has been used by Crowell and Fossett (2018, 2020, 2022, 2023) to compare how group differences in household characteristics and group differences in the rates of return (i.e., regression coefficients) on those characteristics independently and interactively shape segregation outcomes.
For this specific study, I used regression standardization to generate predicted levels of residential contact with White households (i.e., the dependent variable in each group-specific regression model) at different income levels for each group. The calculated differences in these levels of contact between White households and Black, Latino, or Asian households produce White-Black, White-Latino, White-Asian, respectively, segregation index scores standardized at low, middle, and high incomes in scenarios where the groups have matched incomes and when they have mismatched incomes. Observing changes in the predicted levels of segregation that are produced over income levels illuminates the effect of income on racial residential segregation across groups and over time in metropolitan areas.
Results
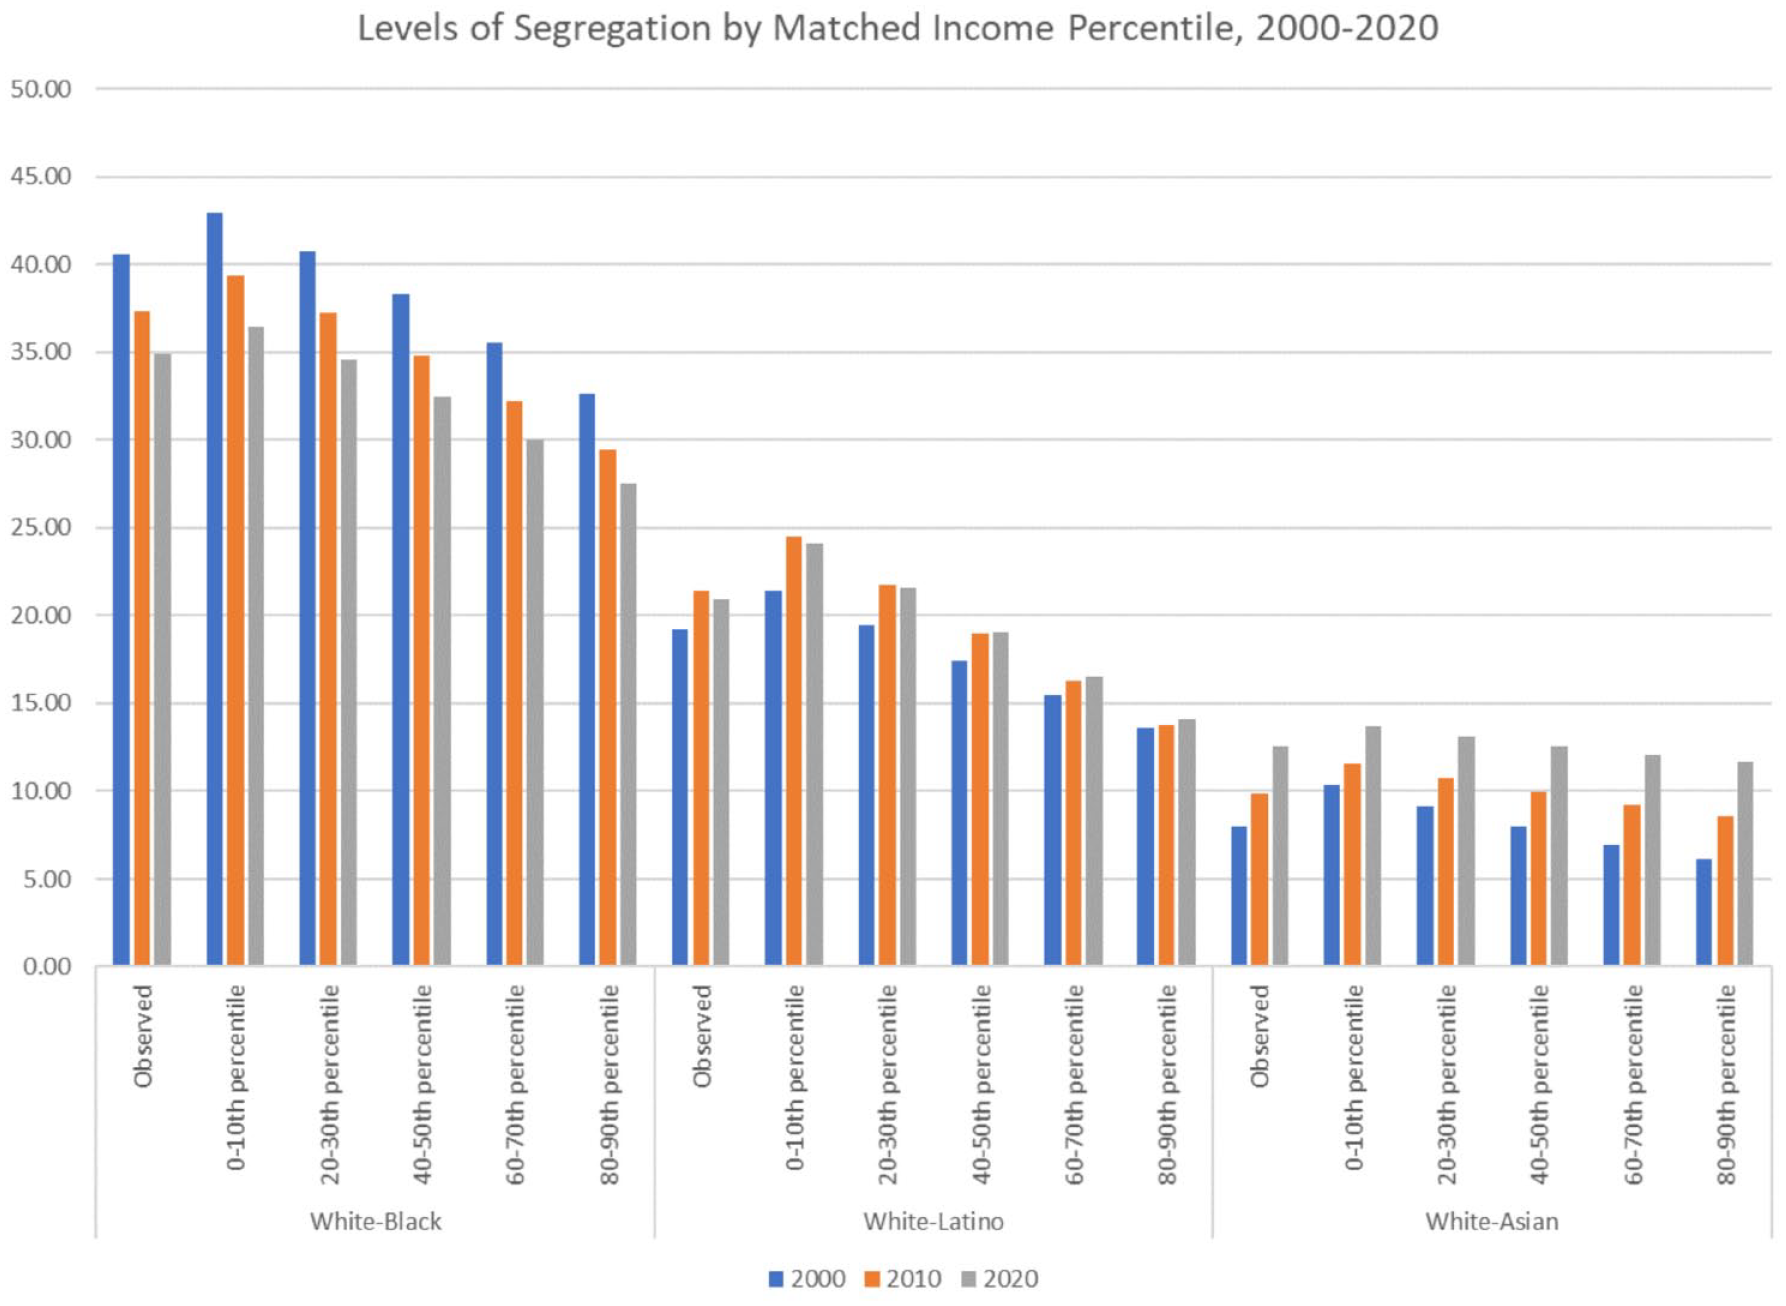
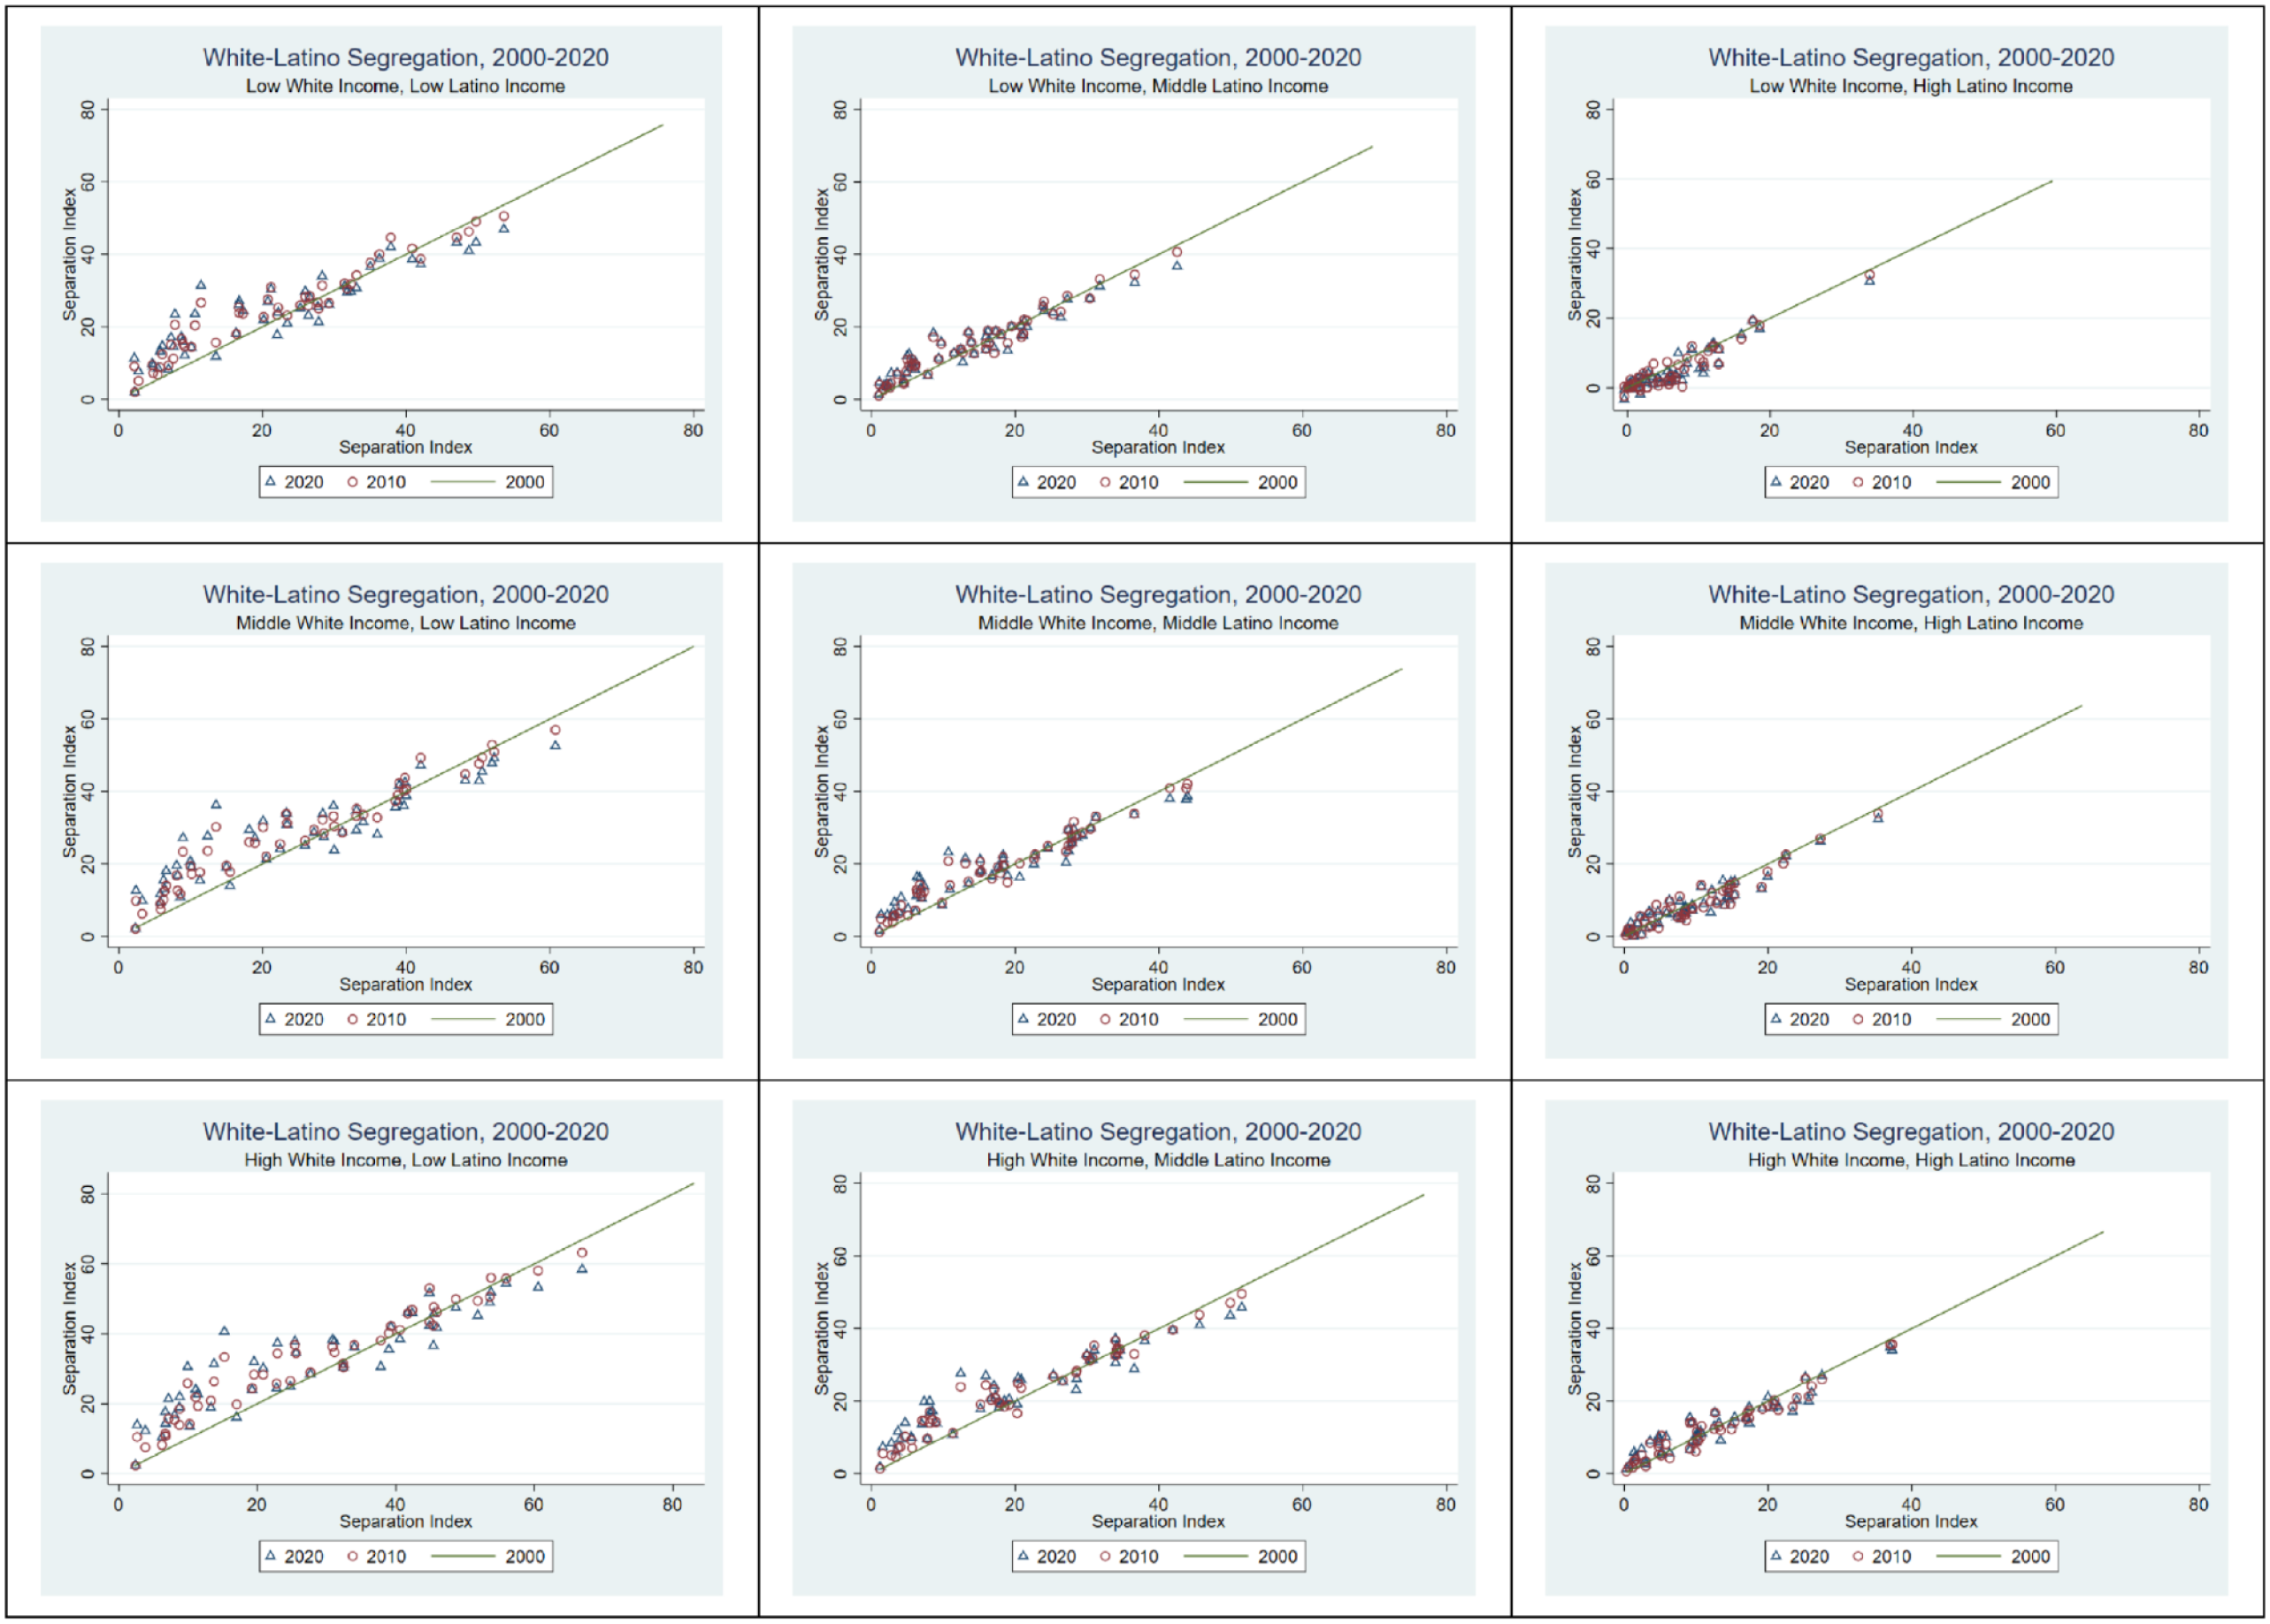
In this section, I organize the study results by group comparison: White-Black, White-Latino, and White-Asian segregation. For each group comparison, I review the predicted values of segregation over the three time periods, 2000 to 2020, across the 50 metropolitan areas in the analysis using observed group-specific levels of income and standardized group-specific levels of income. The predicted segregation scores are analyzed as observed and also as standardized in the following ways: (1) when both White and racially minoritized group incomes are standardized at matched low, middle, and high levels and (2) when White and racially minoritized group incomes are standardized at mismatched income levels (e.g., low-high, low-middle, middle-high). These comparisons make it possible to further analyze how household income translates into residential contact between racial groups by group and income level to shape overall segregation outcomes. To conveniently provide detail on racial segregation patterns across areas and over time, Figure 2 plots observed separation index scores for individual metropolitan areas in 2010 and 2020, with segregation scores in 2000 as the reference line. Figures 3 to 5 are similarly designed but plot predicted separation index scores by race and income group using pairwise comparisons. These figures can reveal rising and declining segregation between race and income groups over time and whether these outcomes are consistent or varied across areas.
White-Black Segregation
Overall, I find that observed levels of White-Black segregation have been steadily decreasing, from a mean separation index score of 41 to a mean score of 35 by the year 2020 (Table 1). This decline has moved the average level of White-Black segregation from what Fossett (2017) would categorize as high segregation to medium segregation. These findings are generally consistent with what others have observed. What we have known less about is how White-Black segregation varies by income. Rather than attempt to directly observe race by income segregation outcomes using sample data, which introduces bias in the calculation of the segregation score, regression standardization can predict segregation outcomes at different income levels by racial group. The first approach is to predict levels of segregation at matched income levels, standardizing both White and Black households at low-, middle-, and high-income percentiles. In Table 2, these predicted levels of White-Black segregation at matched incomes can be seen following the general trend over time of declining. However, White-Black segregation is lowest across matched income groups when both groups are matched at the highest income levels, with segregation scores that are lower than the overall averages reported in Table 1 and dropping to a score of 26 by the year 2020. The highest levels of segregation across matched income groups are found between low-income White and Black households, which are predicted to be higher than the overall average scores for the two groups. These results are summarized in Figure 1, where White-Black segregation can be seen declining over both time and matched income groups, from lowest to highest incomes. Figures 2 and 3, which present scatterplots of observed levels of segregation and segregation predicted using standardization on income levels, further show that these declines over time are remarkably consistent across all metropolitan areas in the analysis.
Separation Index by Group and Year at Observed Levels, 2000–2020.

Separation Index by Group and Year, Standardized at Matched and Contrasted Incomes, 2000–2020.


shaded cells indicate predicted scores at matched income levels.
Predicted levels of White-Black, White-Latino, and White Asian segregation at matched incomes, 2000–2020.

Observed levels of White-Black, White-Latino, and White-Asian segregation, 2000–2020.

White-Black predicted levels of segregation at matched and mismatched incomes, 2000–2020.
Table 2 also presents predicted separation index scores at mismatched incomes for White and Black households. Although the story of declining segregation over time is consistent across these comparisons as well, the relationship between racial segregation and income shows more complexity. The highest predicted levels of segregation over all comparisons are found when Black income is low and White income is high. Correspondingly, the lowest predicted levels of segregation are found when Black income is high and White income is low. Perhaps most telling of how race and income interact to shape White-Black segregation patterns is that regardless of what Black household income is set to, Black households are more segregated from White households as White income increases. Thus, high-income Black households are predicted to have the most residential contact with low-income White households and the least residential contact with high-income White households, demonstrating how race acts as a barrier to integration and impedes the potential effects of income parity. This point is emphasized in Figure 3, which shows variability across metropolitan areas in segregation levels between high-income Black households and low-income White households. But notably, although most metropolitan areas are predicted to have low levels of segregation between high-income Black households and low-income White households, there are some metropolitan areas where high to very high levels of segregation are predicted even when Black households have the maximum income advantage over White households.
White-Latino segregation
In Table 1, I find that observed levels of White-Latino segregation have fluctuated slightly over time but have largely held stable and perhaps increased. The scatterplot in Figure 2 shows that indeed, some metropolitan areas that started out at lower levels of White-Latino segregation have seen increases over time. White-Latino segregation has overall remained at low to medium levels since the year 2000, with only a few metropolitan areas registering medium to high levels of White-Latino segregation at any point in time. At matched income levels (Table 2), White-Latino segregation is significantly higher at low incomes than at high incomes, with segregation predicted to be at medium levels between low-income Latino and White households but only predicted to be at low levels between high-income Latino and White households. Notably, segregation is predicted to rise slightly over time for White and Latino households matched at low- and middle-income levels but to stay fairly low and stable between high-income White and Latino households. Figure 2 shows that changes in observed levels of White-Latino segregation vary somewhat, with segregation rising in metropolitan areas that initially had low levels of White-Latino segregation and segregation staying stable or slightly declining in metropolitan areas that started with higher levels of White-Latino segregation. The scatterplots in Figure 4 illuminate a consistent story of rising segregation between low-income White and Latino households, more variable but generally rising patterns of segregation occurring between White and Latino households matched at middle incomes, and stable patterns between White and Latino households matched at high incomes.
White-Latino predicted levels of segregation at matched and mismatched incomes, 2000–2020.
Predicted levels of segregation have increased the most when Latino households are standardized to the lowest income percentile, with increases growing larger as the income percentile that White households are standardized to goes from lowest to highest (Table 2). A similar but less pronounced pattern is found for middle-income Latino households. Segregation holds steady over time when Latino households are standardized to the highest income percentile and White income is standardized to the middle or highest income percentile but declines slightly when White income is standardized to the lowest percentile. This is the only notable decline. White-Latino segregation is predicted to be at its highest when Latino households are standardized to the lowest income percentile and White households are standardized to the highest income percentile. Interestingly, predicted scores are lowest under the opposite scenario, when Latino households are standardized to the highest income percentile and White households are standardized to the lowest income percentile. Given that predicted segregation is increasing more at the lowest income percentiles for Latino households, this difference is only becoming more pronounced over time.
White-Asian Segregation
Observed levels of White-Asian segregation have increased steadily over 20 years but have remained low, going from 8 to 12.6 (Table 1). In Figure 2, there are no metropolitan areas that experience high levels of White-Asian segregation, and indeed, most do not even reach medium levels. The story of rising White-Asian segregation is also mostly consistent, and predicted levels of segregation have increased for all combinations of income levels between the two groups (Table 2). The highest increases have occurred when Asian households are standardized to the highest income percentile, after starting at the lowest levels. However, despite the highest increases in segregation occurring when Asian income is standardized to the highest percentile, the highest predicted levels of segregation overall are found when Asian income is standardized to the lowest income percentile, although these differences are negligible by 2020 due to the increases in predicted segregation for Asian households standardized at the highest income percentile. Nonetheless, White-Asian segregation, although increasing, remains low at all standardized levels of income for either group.
The scatterplots in Figure 5 show that rising levels of White-Asian segregation are the dominant story across metropolitan areas, albeit rising from very low levels. Only a few metropolitan areas would be predicted to have declining levels of White-Asian segregation, and this is mostly when Asian households are standardized to the lowest income level. When Asian households are standardized to the middle or highest income level, White-Asian segregation is predicted to rise in nearly every metropolitan area. Notably, it is only when Asian income is low that any metropolitan areas register high levels of White-Asian segregation (separation index greater than 35; Fossett 2017), although this is still a rare outcome. To summarize, income appears to play a role in levels of White-Asian segregation that occasionally results in high levels of segregation for low-income Asian households and more systematically means increasing levels of segregation for high-income Asian households. 3

White-Asian predicted levels of segregation at matched and mismatched incomes, 2000–2020.
Discussion
To begin summarizing this analysis, one consistent finding across all groups is that segregation between White and racially minoritized households declines with increasing income. This is a constant finding in the literature, as supported by studies such as Iceland and Wilkes (2006), Intrator et al. (2016), Kucheva and Sander (2018), Sharp and Iceland (2013), and Spivak and Monnat (2013). Another well-supported finding is that income returns are not as great for Black households, who more often experience moderate to high levels of segregation even at the highest income levels. This is also found in the aforementioned studies and by Crowell and Fossett (2022), Freeman (2008), and Massey and Fischer (1999). What added information this study provides to our understanding of White-Black segregation is that it is on the decline across all income levels in the twenty-first century even though income brings relatively weaker returns for Black households when the outcome is residential contact with White households.
Where the literature is less complete is in parsing out how race and income segregation are changing over time and what these patterns look like for Latino and Asian households. White-Latino and White-Asian segregation appear more complicated by household income. Although household income generally has a negative relationship with White-Latino and White Asian segregation, over time, some interesting trends emerge. Segregation between low-income White and Latino households has risen faster than it has for higher income groups, particularly between 2000 and 2010. These findings demonstrate the importance of carefully considering measurement and analytical approaches in residential segregation given that they seem to conflict with previous reports in the literature, including Sharp and Iceland’s (2013) findings that White-Latino segregation was rising faster between higher income groups.
White-Asian segregation is rising at all income levels. Notably, it has been lowest at the highest income levels but has risen dramatically for those same groups, to the point that White-Asian segregation at high-income levels is nearly on parity with White-Asian segregation at low-income levels. A supplemental analysis of contact scores reveals that rising White-Asian segregation is not a result of increasing White self-contact but, rather, is a result of decreased Asian contact with White households. Rising Asian residential segregation has been identified in recent studies by Intrator et al. (2016), Kye (2023), and Sharp and Iceland (2013). A key contribution of this study is the finding that White-Asian segregation still rarely appears in a pattern of prototypical segregation because the separation index remains low even as it is rising. Asian households are still, on average, having high levels of residential contact with White households, with high-income Asian households surprisingly having the least. It is possible that the standout rise in high-income White-Asian segregation is related to reports of an increasing amount of affluent Asian ethnoburbs, which Samuel Kye (2023) attributes less to self-segregation and more to ethnic stratification.
Conclusions
There remains no doubt that household income is an important predictor of residential location and is implicated in racial residential segregation patterns. This study goes further in helping us understand how household income affects racial residential segregation outcomes by predicting White-Black, White-Latino, and White-Asian segregation outcomes at matched and differing income levels. From this analysis, I can draw several conclusions. First, the effect of income on racial segregation varies across groups in sometimes surprising ways. Although the spatial assimilation model of segregation often does not apply well to understanding White-Black segregation, two findings here lend some support to its relevance. Segregation is progressively lower as White and Black household incomes are matched from lowest to highest income levels, which is an expected finding. But the trajectory of declining White-Black segregation is consistent across all income groups. The lowest levels of White-Black segregation are found between high-income White and Black households in any decade and are lowest for these income groups in 2020. Thus, although White-Black segregation is still quite high overall, the trend of decreasing segregation is very consistent over time and across income groups, even between mismatched income groups.
In contrast, the dynamics are more complicated for White-Latino and White-Asian segregation. The lowest levels of White-Latino and White-Asian segregation are found at the highest income levels, indicating spatial assimilation dynamics. However, high-income Latino and Asian households are the least segregated from low-income White households and the most segregated from high-income White households. White-Latino segregation has also increased more for low- and middle-income Latino households when matched with middle- and high-income White households than it has when the two groups are matched on low or high incomes, indicating an interplay between racial stratification and income inequality that may lag the potential integrating dynamics of income parity for more socioeconomically advantaged Latino households. Furthermore, White-Asian segregation has increased the most at the highest income levels, which is a finding that we should expect to see more of given recent research on Asian residential outcomes (Kye 2023) and now this present analysis. These patterns are indicative of competing racialized place stratification dynamics that undermine any attempt to explain racial residential segregation as a matter of income inequality, even as income is a stronger determinant of Asian and Latino residential outcomes than it is for Black residential outcomes.
The methodological conclusions to be drawn from this study are about the ways in which researchers can measure the effect of income on racial and ethnic residential segregation without experiencing the challenges of sample and measurement bias producing faulty segregation index scores. First, reformulating the segregation index into a difference-of-means format is a mathematically equivalent approach that makes it quantitatively possible to analyze residential segregation as a stratification outcome (Fossett 2017). Second, with the segregation index reformulated and reconceptualized as a group inequality, it is also possible to understand factors that shape segregation at the appropriate level of analysis and conduct regression standardization and components analysis. Controlling for income in this way makes it possible to both estimate the extent to which racial residential segregation is determined by factors other than income and also draw out the complexities of the effect of income on racial residential segregation patterns across groups, across communities, and over time.
Finally, a less central but noteworthy technical contribution of this study is that even though the independent variable (household income) in the analysis came from sample data, the dependent variable (neighborhood proportion White) was constructed using decennial census data. Thus, the segregation index, which is calculated using the dependent variable, is not impacted by bias that comes from using sample data to construct the segregation index (Napierala and Denton 2017). In large metropolitan areas, this concern might not resound, and the results would likely be similar with sample data. However, many problems with segregation index bias become more pronounced in less populated geographic areas with more imbalanced group sizes.
Although this analysis was in many ways simplistic, particularly regarding the fact that it only took into account the roles of income and race and no other relevant factors that determine residential segregation patterns (see Crowell and Fossett 2018, 2020, 2022, 2023), it also drew out more detail on how racial segregation patterns vary by income and demonstrated methods for conducting segregation research that align with how demography and inequality studies investigate other stratification outcomes. The role of income in determining racial residential segregation patterns is undeniably important but also not the sole explanation for ongoing segregation in the twenty-first century. This is clear when racial residential segregation is modeled at matched income levels and further elaborated on at different group-specific income levels. Explanations of racial residential segregation that focus on the racial and ethnic dynamics that drive residential sorting, including preferences, networks, and discrimination, also remain powerful in this contemporary era.
Footnotes
Acknowledgements
I am thankful to the anonymous reviewers for their very constructive feedback on this article. I am also grateful to Alex Mikulas, who served as a discussant on this article at the 2024 Annual Meetings of the Population Association of America. This gratitude also extends to Elizabeth Roberto, who organized that session. Finally, I am thankful to Zachary Crowell for his extensive technical support because the analysis for this article required tremendous computational capacity due to the size of the data sets.