
Abstract
Organizations play a central role in replicating societal inequalities. Despite theories of gendered and racialized organizations, evidence of unequal outcomes, and research on proposed mechanisms, we have few intersectional analyses demonstrating how the promotion process varies by race and gender across job levels in actual organizations. In this first-ever analysis of advancement in a U.S. firm by gender, race, and job, we run random effects logistic regression models on five years of novel longitudinal data from the software engineering workforce of a U.S.-based technology company. Results show intersectional performance-reward bias in patterns that help maintain the racialized gendered hierarchy so commonly observed in organizations: White men overrepresented at the top, women of color overrepresented at the bottom, and in the technology sector, men of Asian descent overrepresented in midlevel technical jobs and White women overrepresented in midlevel management positions. Findings suggest monitoring promotions by gender, race, and position to make visible biases that continue to impede workplace equity.
Organizations operate as microcosms of society. Social scientists have long noted the central role organizational practices play in replicating or reducing societal patterns of inequality (Acker 1990; Baron and Bielby 1980; Kanter 1977a; Tilly 1998). Because the vast majority of people earn their incomes within organizations, recognizing the specific organizational practices that maintain organizations as “inequality regimes” (Acker 2006) is a critical contribution of sociological research to the study of discrimination and inequality (DiTomaso, Post, and Parks-Yancy 2007; Williams 2021). Promotion is an organizational practice central to the reproduction or reduction of inequality (Amis, Mair, and Munir 2020). Despite increased employer attention to gender and racial equity, persistent barriers to promotion remain for women and racial or ethnic minority workers (Avery et al. 2023; Carli and Eagly 2016). Across organizations, White men are often overrepresented at the top, and women of color are disproportionately present at the bottom. In the technology sector, men of Asian descent are often overrepresented in midlevel technical jobs, and White women are often overrepresented among middle managers (Han and Tomaskovic-Devey 2024).
Scholars have documented how inequality in organizations happens both vertically and horizontally, with workers of higher status race and gender identities more present at higher job levels and workers segregated into different jobs of the same level according to aspects of their identity, most notably their gender (Bahn and Cumming 2020; Charles and Grusky 2004; Mintz and Krymkowski 2010). Status characteristics theory describes how identity characteristics such as gender and race are implicitly linked with certain competencies and characteristics (Berger, Ridgeway, and Zelditch 2002; Correll and Ridgeway 2006; Ridgeway 2001). Individuals are often seen as more or less suited to certain seemingly gender-neutral, race-neutral roles based on the fit between their identity group—informed by stereotypes—and the status and competencies associated with the roles (for a review, see Rosette et al. 2018). Many studies show that even when workers display identical qualifications or performance, employers evaluate them differently, in ways that align with group-based status beliefs and stereotypes (Brewer et al. 2020; Heilman 2001; Moss-Racusin et al. 2012). For example, a recent study (Rider et al. 2023) found that Black National Football League coaches were less likely to be promoted than White ones independent of their experience and performance, representing strong evidence of bias favoring the higher status group. Previous research has found such “performance-reward bias”—different rewards for equivalent performance—to be an important factor accounting for the persistence of gender differences and race differences in wages and career attainment within organizations (Castilla 2008; Joshi, Son, and Roh 2015; Norris and Moss-Pech 2022; Smith 2005).
Importantly, individuals’ experiences and how others perceive them are shaped not by single identities but by multiple intersecting identities (Chavez and Wingfield 2018; Collins 2002; Crenshaw 1991; hooks 1981, 1984). Intersectional scholarship has demonstrated that when we analyze data by gender or race alone, we obscure the experiences of underrepresented groups and generate biased estimates not only for gender and racial or ethnic minority groups but for all groups for whom we are attempting to identify patterns (Choo and Ferree 2010; McCall 2005; Wingfield 2009). Nonetheless, it is uncommon for organizations to consider gender and race together when tracking the diversity of their workforce and evaluating their organizational culture. Organizational leaders are often more comfortable talking about gender differences, which they often see as “natural” (Martin 2023), than about race, which often elicits steep resistance (Livingston 2021), and considering race and gender together is rarely done. Likewise, it is rare for organizations scholarship to analyze gender and race in an intersectional way (Rosette et al. 2018). Yet it is critical that we do so because, as our results show, when organizations fail to consider race along with gender when assessing who they are promoting into which jobs, they are likely to miss patterns of promotion that disadvantage certain gender and race groups in ways that align with dominant cultural stereotypes.
Building on existing literature that examines the implications of gendered (Acker 1990) and racialized (Ray 2019) organizational hierarchies, here we take an intersectional approach to examine for the first time in a U.S. organization the consequential outcome of promotion into specific jobs 1 at the intersection of gender and race to better understand the persistent inequalities and uneven progress in advancing gender and racial equity so often observed in organizations. 2 We are able to conduct this analysis because we gained access to data that are rarely available to researchers: five full years (2013–2017) of personnel data for the software engineering workforce at a large, U.S.-based, publicly traded technology company. Drawing on these data, we compare empirical findings with what research on racialized gender stereotypes salient in the United States would predict. By pinpointing where in the promotion pipeline intersectional race and gender groups encounter obstacles in an actual company, we conduct a quantitative empirical test of theoretical work developed using mostly qualitative methods (e.g., Alegria 2019; Wingfield and Alston 2014).
To summarize our results, we find performance-reward bias for workers of different intersectional gender and race identities across multiple job levels in two different types of work: technical and managerial. Specifically, we find evidence that Black, Latinx, Native, and Pacific Islander women were less likely than White men to be promoted out of low-level positions and into top-level positions on the technical and management tracks net of performance and experience, demonstrating the deep disadvantages women of color often face in organizations in which they are a distinct minority. We find that women of all races and Black, Latinx, Native, and Pacific Islander men join Black, Latinx, Native, and Pacific Islander women in facing a glass ceiling on the technical ladder net of merit. And we show that White women and men of Asian descent experience unique boosts to the midlevel (but no higher) of the managerial and technical tracks, respectively, net of performance and experience. Importantly, when we look at women overall as a monolithic group with our data, we fail to see that Black, Latinx, Native, and Pacific Islander women experience a disadvantage on the management ladder, whereas White women experience an advantage, illustrating how an intersectional analytical approach provides a clearer picture of social patterns.
This research demonstrates, as other research has, that merit alone cannot explain advancement up job ladders over time (Castilla 2008; Castilla and Benard 2010). As social theorist Tilly’s (1998:11) analysis of durable inequality notes, although actors “rarely set out to manufacture inequality as such,” their practices often reinforce established categories in the service of facilitating organizational goals. This research shows for the first time how promotions in a large U.S. organization are patterned by gender, race, and job net of merit in ways that align with widespread racialized gender stereotypes in an era when discriminatory practices are often illegal and less socially acceptable—and therefore less overt—than in the past.
TECH INC
Despite professed commitments to fostering diverse and inclusive organizations by industry leaders, the absence of gender and racial or ethnic diversity in the technology sector is often covered in the media, and in recent years, technology companies have published annual employee data making the lack of diversity in the industry clear (Chakravorti 2020). As of 2023, women constituted 27 percent of workers in computer and mathematical occupations, and Black or Latinx workers made up 18 percent (U.S. Department of Labor 2024). Employing nearly 10 percent of U.S. workers, the tech industry has an outsized impact on the economy and society because of its wealth and power. Because of institutional isomorphism and the tendency for information to flow from higher-status to lower-status organizations, understanding how advancement is racialized and gendered within a large organization in the tech industry could have widespread implications for understanding inequality across organizations and in society writ large (DiMaggio and Powell 1983).
At TECH INC. (a pseudonym), software engineering jobs are organized according to a dual ladder structure that separates technical and managerial labor, a structure common in many engineering, medical, and scientific organizations in the United States. This structure creates two tracks into which workers can be promoted: positions involving supervision of people (the management track) and those focused on technical content (the technical track; Barley 2005; DiTomaso, Post, Smith, Farris, and Cordero 2007). Racialized gender stereotypes—general beliefs about racialized gender groups—strongly map onto the technical/social dualism codified in the dual ladder structure, providing a solid foundation for hypothesis generating (Cardador 2017; Faulkner 2007).
Metaphors for Organizational Advancement
To organize our hypotheses, we draw on three metaphors of organizational advancement—the glass ceiling, the step stool, and the sticky floor—that have been used to describe unequal promotion outcomes in the past. Perhaps the best-known metaphor to describe the career trajectories of women in the corporate sector is the glass ceiling, used to illustrate how women’s advancement to senior positions is often blocked (Eagly and Carli 2007; Morrison and von Glinow 1990). The ceiling is “glass” because it is made of hidden structural discrimination: Workers can see the top but are blocked from getting there (Carli and Eagly 2016; Eagly and Carli 2007; Kanter 1977b). Different criteria have been used as evidence for the existence of a glass ceiling. Using the broadest criteria—the existence of few or no women in top-level jobs—there is strong consensus that women face a glass ceiling in most organizations (Petersen and Saporta 2004; Reskin and Ross 1992; U.S. Department of Labor 1991). Using the more stringent criteria of lower odds of promotion to the highest positions in an organization for women compared to men, some research has found evidence for a glass ceiling (e.g., Maume 1999), and other research has not (e.g., Petersen and Saporta 2004). Similarly, using even more stringent criteria, increased difficulty in advancement at each organizational step, some research has found evidence for a glass ceiling for women and people of color (e.g., Cotter et al. 2001; Elliott and Smith 2004; Gorman and Kmec 2009; Maume 2004), and other research has not (e.g., Petersen and Saporta 2004). Still other research has identified how barriers to top positions may operate differently for women of different races. For example, research has noted the presence of a “concrete ceiling” for Black women that both obscures and impedes advancement (Bell and Nkomo 2003) and a “bamboo ceiling” for women of Asian descent who may be viewed as desirable workers but not suitable leaders (Fernandez 1998; Kim and Zhao 2014; Lee and Zhou 2015; Tang 1993).
In this article, we operationalize the glass ceiling at the group level as lower odds of advancement into high-level positions compared to the dominant group net of performance ratings and tenure in position. In doing so, we take the middle road among the three ways that the glass ceiling has been operationalized and draw on the original usage of the term glass ceiling as a barrier specific to entry to top-level positions (Goodman, Fields, and Blum 2003; Powell and Butterfield 1994). We chose this approach because it allows us to differentiate glass ceiling mechanisms (that implicate beliefs about leadership competence) from sticky floor mechanisms (that implicate beliefs about technical and social competence) that may be operating at lower rungs of the ladder.
In contrast, the step stool, a more recently coined metaphor, represents a small boost at middle levels of an organization. In her qualitative study of women in the technology industry, Alegria (2019) finds that White women with technical backgrounds often received unsolicited encouragement to move into midlevel management positions, based on presumptions of their social skills, that do not ultimately lead to the top levels of the company hierarchy. Relative to White women, women of color enjoyed no such presumption of interpersonal skills, and any management move they made was based on careful planning and documentation. Luhr (2024) also finds that the mostly White women in her sample of tech workers were steered out of technical roles into more people-oriented positions in human resources, sales, and marketing. Maume (2004) and Elliott and Smith (2004) similarly found a small lift for White women to midlevel management across multiple occupations that did not persist to more senior levels. Although developed in the context of management roles, we extend the concept to apply to any midlevel advancement advantage that does not persist to higher level positions. For the purpose of our study, we define the step stool at the group level as greater odds of advancement into midlevel but not high-level positions compared to the dominant group net of performance ratings and tenure in position.
Finally, some research supports the notion that a sticky floor holding workers down in the lowest status positions is a more appropriate metaphor than a glass ceiling for barriers to advancement at work for women and racial or ethnic minorities. A recent ethnography illustrates the lived experience of the sticky floor, chronicling Black medical technicians’ day-to-day experiences navigating interpersonal interactions from the lower levels of the status hierarchy within hospitals (Wingfield 2019). Existing research finds evidence for a sticky floor for women in academic medicine and in a large Canadian firm (Tesch et al. 1995; Yap and Konrad 2009). We hypothesize similar dynamics may be operating at TECH INC. For the purposes of this article, we define a sticky floor at the group level as lower odds of advancement out of low-level positions compared to the dominant group net of performance ratings and tenure in position.
Hypotheses
Based on the literature on intersectional race and gender stereotypes in the United States, we generate hypotheses focused around these three metaphors representing where workers get stuck first at the top (glass ceiling), then at the middle (step stool), and finally, at the lower levels (sticky floor). Our comparison group is White men because they are the dominant group, that is, the highest status and most well-represented demographic group of workers at each level in the software department at TECH INC. Under each general hypothesis, we specify what we expect to find for specific groups who face relevant stereotypes. Because the numbers of Black, Latinx, Native, and Pacific Islander workers in our data set are very small, in our analyses, we grouped workers from these racial and ethnic categories together. Although far from an ideal approach, combining these groups together allowed us to investigate rather than ignore the experiences of people in race and gender groups that compose small fractions of a workforce population.
Glass Ceiling Hypothesis
We hypothesize that gender and race groups facing negative stereotypes of their leadership ability will experience a glass ceiling, or a blocking of access to high levels in the organizational hierarchy. In line with well-documented gender stereotypes of women as ill-suited for leadership positions (Eagly and Carli 2007; Schein 1973), perhaps especially in technical fields, and notions of leadership as coded White (Gündemir et al. 2014), we expect, in theory, that we will see a glass ceiling on both tracks for White, Asian and Asian American, and Black, Latinx, Native, and Pacific Islander women and Black, Latinx, Native, Pacific Islander, Asian, and Asian American men. In practice, however, for groups that experience an especially strong sticky floor, particularly Black, Latinx, Native, and Pacific Islander women, there may be too few individuals at midlevels to observe the presence of a Glass Ceiling at the highest rungs.
Hypothesis 1: Women of all races and ethnicities and Black, Latinx, Native, Pacific Islander, Asian, and Asian American men will experience a glass ceiling on the management and technical ladders.
Step Stool Hypothesis
We hypothesize that gender and race groups facing positive stereotypes of content-specific but not leadership ability in a given domain will experience a step stool, or a small boost, into midlevel positions but no further benefit. Specifically, we predict a step stool for White women on the managerial track due to stereotypes of high social competence (Glick and Fiske 1999; Ridgeway 2011) that is seen as consistent with middle management but does not translate to high leadership. We also predict a step stool for men of Asian descent on the technical track due to stereotypes of high technical competence and negative stereotypes of leadership skill (Berdahl and Min 2012; Kiang et al. 2017). Because we expect that the gender of women of Asian descent will be more salient than their race in a technical context given the strong masculine stereotypes associated with technical roles and the underrepresentation of women in these roles, we do not expect Asian and Asian American women to experience a step stool on the technical track (see Rattan, Steele, and Ambady 2019). Likewise, we do not expect Asian, Asian American, Black, Latinx, Native, or Pacific Islander women to experience a step stool on the managerial track because the stereotypes that benefit White women here are racialized and not likely to benefit women of color in the same way.
Hypothesis 2: White women will experience a step stool on the management ladder. Men of Asian descent will experience a step stool on the technical ladder.
Sticky Floor Hypothesis
Finally, we hypothesize that gender and race groups facing negative stereotypes about their domain-specific or general competence and/or whose identities result in intersectional invisibility will experience a sticky floor, or a barrier, to advancement from low levels in the organizational hierarchy. We anticipate that women of all races and ethnicities will experience a sticky floor on the technical track due to stereotypes of women as low in technical competence (Ridgeway 2011). We include women of Asian descent here despite the counterbalancing stereotype that people of Asian descent are technically skilled because, as with the step stool hypothesis, we expect that the gender of women of Asian descent will be more salient than their race in a technical environment. In addition, we expect that Black, Latinx, Native, and Pacific Islander men will experience a sticky floor on the technical track due to stereotypes of low competence that are simultaneously not ascribed to White, Asian, or Asian American men (Collins 2002; Wingfield 2007).
Extending the concept of the sticky floor to the management track, we expect that Asian and Asian American men and women will experience a sticky floor due to stereotypes of people of Asian descent as low in warmth and as having poor interpersonal skills that will prevent them from even entering the management ladder (see Gee and Peck 2018). We expect that Black, Latinx, Native, and Pacific Islander women will experience a sticky floor on the management track due to racialized gender stereotypes that cast these groups as low in competence and largely invisible to others in the organization (Collins 2002; Purdie-Vaughns and Eibach 2008).
Hypothesis 3: Women of all races and ethnicities and Black, Latinx, Native, and Pacific Islander men will experience a sticky floor on the technical ladder. Asian and Asian American men and women and Black, Latinx, Native, and Pacific Islander women will experience a sticky floor on the management ladder.
Data
In 2016, TECH INC. invited our research team to study how workplace bias in software engineering prevented women from advancing to top leadership positions. We entered into a formal partnership with TECH INC. that involved transferring personnel data for research under a nondisclosure agreement and Institutional Review Board approval at Stanford University. Details about the firm are thus anonymized. The data set includes any person employed directly in TECH INC.’s U.S.-based software engineering organization during this time period and covers 5,584 workers and 18,247 person-years of active employment. 3 This relatively large sample size allows us to examine how promotion into particular positions is patterned by gender and race together in a way that previous research has been unable to do.
Table 1 presents the gender and race or ethnicity breakdown of the workforce overall and for those who received promotions. Gender is defined by TECH INC. as a binary category, and 100 percent of our sample self-reported their gender as either “man” or “woman.” TECH INC. did not provide data on whether workers identified as transgender or cisgender. Race and ethnicity are measured as a three-category variable: White, Asian and Asian American (provided to us by TECH INC. as one category that encompasses people of East Asian, South Asian, and Southeast Asian descent), and a third category that includes Black, Latinx, Native, and Pacific Islander. Because we were not provided with birthplace information, we are unable to distinguish between people born outside the United States from those born in the United States. For this reason, we use “Asian and Asian American” or “of Asian descent” interchangeably to refer to people whose ancestors come from Asia whether they themselves were born in or outside of the United States. We were provided self-reported race or ethnicity data for 98 percent of our sample; the remaining 2 percent of our sample has missing data for race or ethnicity.
Race/Ethnicity and Gender of TECH INC. Software Engineering Employees, 2013–2017.

Calculated using person-years of active employment.
“Other” includes the category “two or more (not Hispanic or Latino)” and “visible minority.”
Together, White men and men of Asian descent made up 78 percent of TECH INC.’s software engineering workforce, 52 percent and 26 percent, respectively. The representation of other groups is small: Asian and Asian American women made up 8 percent, White women made up 7 percent, Latinx men made up 3 percent (161 people), Black men made up 1 percent (52 people), and Latinx women (25 people), Black women (14 people), and Native and Pacific Islander men (20 people) and women (3 people) each made up less than 1 percent of the workforce. This is similar to diversity data published by U.S.-based technology companies overall during this period (Chakravorti 2020).
The percentage of promotions for each gender, race, and intersectional race and gender group tracks closely with the percentage of workers in each group (See Table 1). Looking at gender alone, women overall (i.e., of any race or ethnicity) filled 16 percent of the person-years of active employment and received 16 percent of the promotions. Likewise, White men filled 52 percent of the person-years of active employment and received 51 percent of the promotions. Women of Asian descent made up 8 percent of the workforce and received 8 percent of the promotions. Promotions among the smallest groups were less frequent than among other groups. Together, Black, Latinx, Native, and Pacific Islander women received only 0.3 percent of the promotions while filling 0.6 percent of the person-years of active employment. Nonetheless, if a company were measuring equity in their organization by tracking the degree to which they promoted people of different races and genders at rates proportional to their representation in the workforce over time, TECH INC. would largely appear to be succeeding. Yet as we will show, once we factor in the jobs into which workers were promoted, we see promotion patterns that reflect the racialized gender stereotypes in the larger U.S. society.
Our analytic sample for the fully adjusted models includes 14,844 person-years of active employment after removing observations with missing data, mainly on one or more control measures (performance ratings and/or tenure in position). Our statistical results relating to gender, race, and ethnicity are similar with or without controls, meaning the loss of cases does not introduce substantive bias in our adjusted models.
Figures 1 and 2 show the gender and racial or ethnic makeup of workers at each level on the technical (Figure 1) and management (Figure 2) tracks in 2017, a year that is similar to other years of our study. Both tracks begin at the same level, “software engineer 3” (SE3). White men make up 44 percent of workers at the SE3 level. The representation of White men increases at each level up both tracks but more dramatically on the technical track. By the highest technical level, the “senior staff engineer” level, 80 percent of workers are White men. By comparison, 57 percent of “senior managers”—the equivalent level on the management track—are White men, and 67 percent of the highest management level, “partner managers,” are White men. The other gender and racial or ethnic groups together, therefore, have lower representation at each successive level up each ladder, and Black, Latinx, Native, and Pacific Islander women have the lowest representation, between 0 percent and 3 percent at each level.
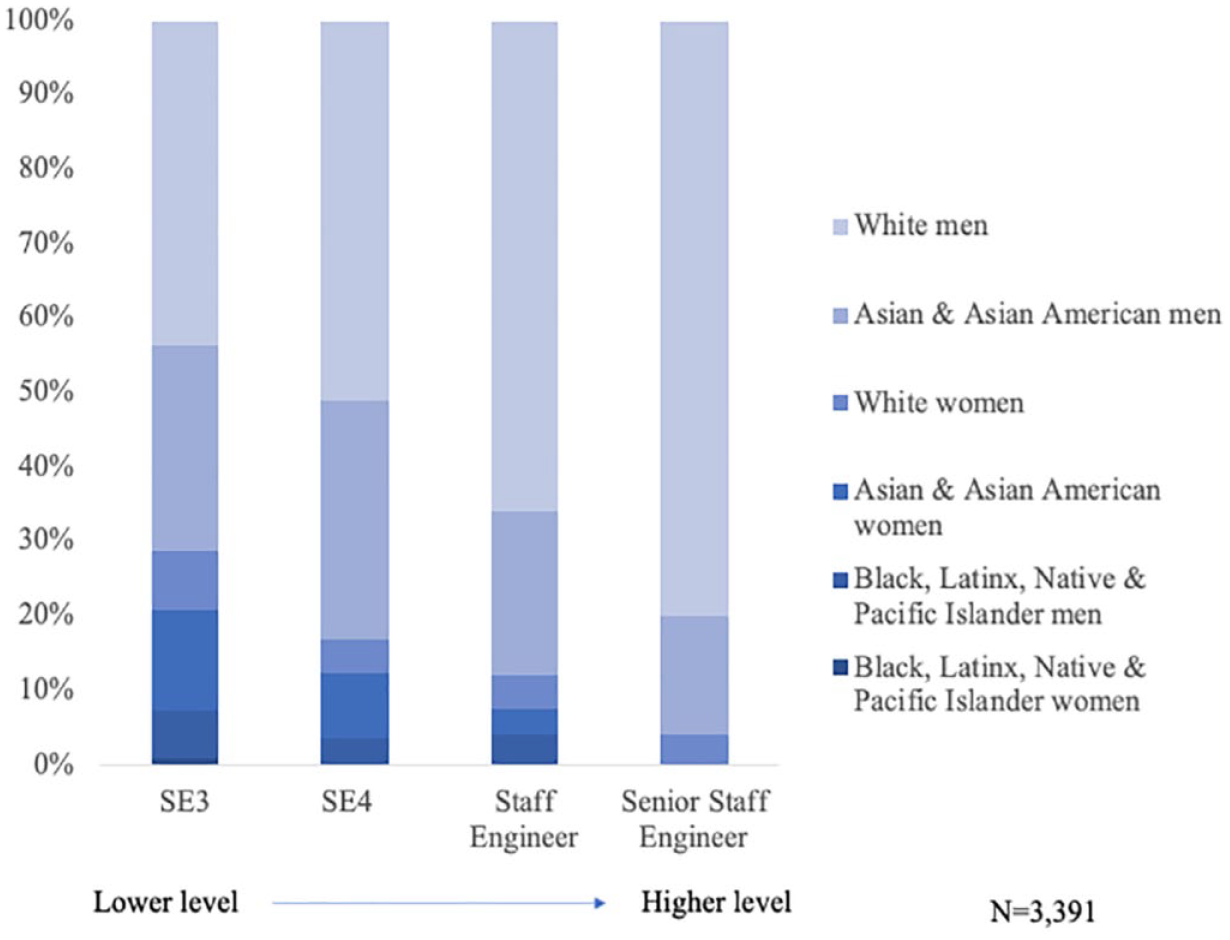
TECH INC. technical track employees by job level, gender, and race or ethnicity, 2017.

TECH INC. management track employees by job level, gender, and race or ethnicity, 2017.
Table 2 provides more detail, showing the job levels in each track and the number of promotions into each level during the time frame of our data. Job levels in the same row are at equivalent ranks in the organizational hierarchy. The lowest levels (SE3 and below) are on the technical track, and most people enter at these levels. Later, at the “midlevel,” some workers move into managerial roles (starting with “manager 1” [MGR1]), and some stay on the technical track (moving into “software engineer 4” [SE4]). In our analyses, we examine all promotions leading up to executive-level positions. Promotions to director level and above are excluded because our focus is on understanding promotions up the technical and management ladders and not on promotions within executive levels, which comprise fewer than 2 percent of promotions in our data set. Because the highest job levels on both the management and technical tracks are the gateways into executive positions, we are still able to examine the data for evidence of a glass ceiling.
Organizational Hierarchy by Track (Job Levels Listed from High to Low).
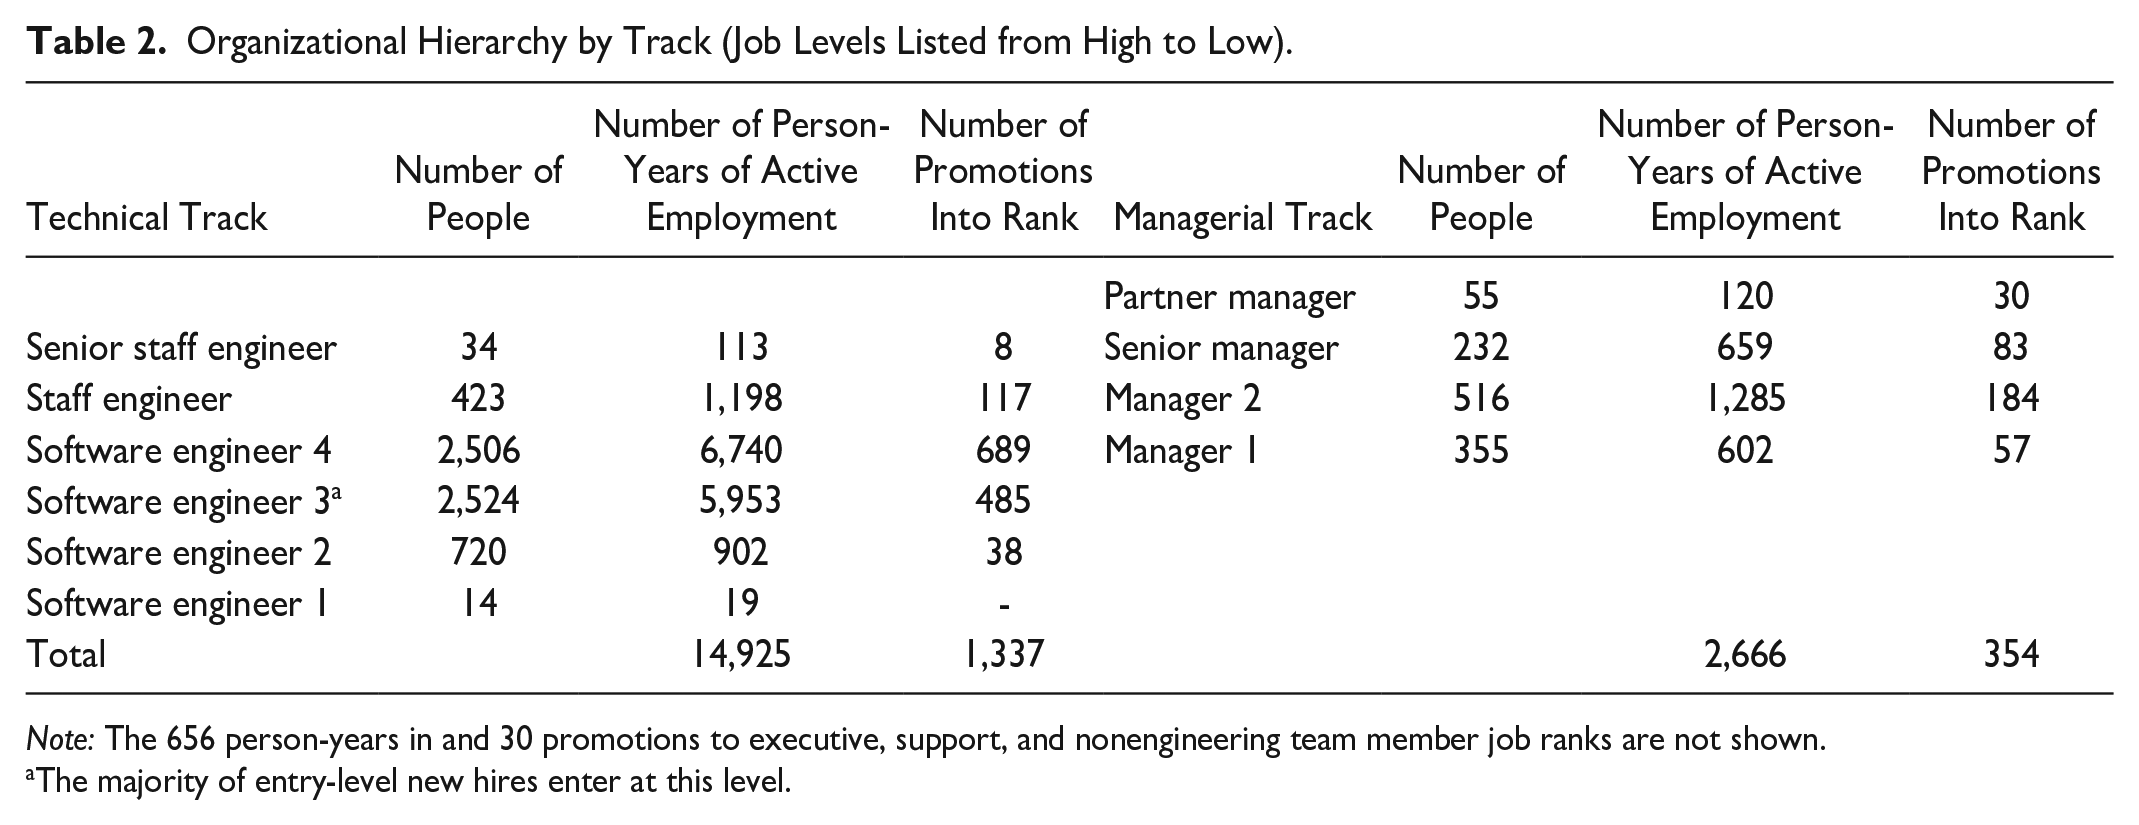
Note: The 656 person-years in and 30 promotions to executive, support, and nonengineering team member job ranks are not shown.
The majority of entry-level new hires enter at this level.
Methods
To test whether our data support our hypotheses, we estimated odds ratios of promotion using random effects logistic regression with person-year as the unit of analysis. This approach accounts for the presence of repeated observations within individuals over time (Allison 2014). We use random rather than fixed effects because the independent variables of interest are gender and race, which do not vary over time within person (i.e., are fixed) in our sample. Event history techniques could also be used to analyze these data and have been used in similar studies of promotion (e.g., Castilla 2008). Given that we would learn similar things from each approach, however, we opted to use the models that are more straightforward to interpret to make the findings more accessible. 4 Models were run separately for promotion into each job level within the technical and managerial tracks. In all models, the reference group is White men, the dominant race and gender group in terms of representation at all levels of the software engineering department, as described previously. Logistic regression models with clustered standard errors, run as robustness checks, produced similar results.
We define promotion as a move to a job level above the level at which an employee worked in the previous year. We code promotion as 1 when an individual’s job level is higher than the previous year and as 0 in all other cases. For example, a person at “software engineer 4” (SE4) in one year would receive a 0 the following year if they remained at SE4, moved down to SE3, moved laterally to MGR1, or were no longer in the software engineering department of TECH INC. either because they left the company or moved to another department within TECH INC. They would receive a 1 if they moved up to staff engineer or manger 2 (MGR2). Promotions were nearly always from one job level to the immediate next level. The one exception is a move from “support” to MGR1, a move of two levels, which is coded 1.
We estimate odds ratios of promotion from the pool of person-years at eligible jobs into the job of interest. We define “eligible jobs” as all jobs from which 20 percent or more of the workers at the job of interest were promoted. That is, if at least 20 percent of the workers promoted into SE4 were at SE3 in the previous year, all person-years at SE3 would be included in the “eligible jobs” pool for promotion to SE4. If fewer than 20 percent of the workers promoted into SE4 were at SE3 in the previous year, SE3 would not be included. Anyone not eligible for a given promotion (e.g., a person at MGR1 is not eligible for promotion to SE4) is coded as missing and is not included in the pool of person-years for promotion to that level. As such, SE3 is the only “eligible” job for promotion into SE4 because 99 percent of all promotions into SE4 were awarded to employees at SE3 (see Table 3).
Eligibility Pool for Promotion to Each Job Level.

Meets the 20% threshold for women workers but not for workers overall.
We set the 20 percent eligibility threshold to ensure we included jobs that were the main feeders into the job of interest so that our comparisons are among workers best situated to receive the given promotion. Additionally, we included in each eligibility pool job levels from which 20 percent or more men or 20 percent or more women were promoted to ensure we were not discounting a pathway available for one group that may not meet a threshold of 20 percent across the entire workforce. Table 3 shows the eligible jobs for promotion into each job of interest in our data. Although our threshold for inclusion is 20 percent, all excluded jobs represented no more than 6 percent of promotions to any given job.
Our models test differences in promotion by gender and race group over four years (2014–2017). Before combining Black, Latinx, Native, and Pacific Islander men into a single category and Black, Latinx, Native, and Pacific Islander women into another, we tested differences in promotion for men and for women in each of these racial or ethnic groups separately. As mentioned previously, combining these groups into one category allowed us to analyze rather than ignore the experiences of workers in very underrepresented race and gender groups. We decided to combine these groups both because the small numbers in each group limited our ability to estimate separate coefficients for each group at most job levels and because although the content of stereotypes varies, past literature suggests each group faces expectations of lower competence and for women, intersectional invisibility, which made our hypotheses consistent across each group (Burkley et al. 2017; Ghavami and Peplau 2013; Lee and Fiske 2006). 5
All models control for tenure in position (in years) and performance ratings from the prior year. We control for tenure in position because we expect that the longer a worker is in a given job, the more likely it is the worker will be promoted. To estimate tenure in position for individuals in 2013 (the first year of data), we rely on last promotion date and start date data provided by TECH INC. Performance ratings are measured on a continuous numeric 9-point scale. The lowest value is equivalent to a “lowest performing,” evaluation and the highest value is equivalent to a “highest performing” evaluation. Managers assess workers’ performance regularly and log ratings in personnel systems. Managers are advised to make promotion recommendations based on performance ratings, consistent with merit-based models at many companies (e.g., Castilla 2008; Correll et al. 2020). Although these controls provide some leverage to net out human capital differences, or differences in “merit,” we are not controlling for purely objective measures but, rather, subjective evaluations that other research has shown are biased by stereotypic assumptions (Correll et al. 2020; Nelson et al. 2023; Wynn and Correll 2018). In other words, we are controlling for performance and any biases associated with its assessment. As such, our results should be interpreted as conservative estimates of promotion disparities between different gender and race groups.
To check robustness, we ran all models without controls. We also ran models removing workers who left TECH INC. in the year of potential promotion and models that used all other workers as the reference group rather than White men. All of these tests produced similar results to those presented. To assess whether the data support our Glass ceiling hypothesis, we test for significantly lower odds of advancement for a gender and race group—or a 0 coefficient indicating no members of a group were promoted—compared with White men into the highest levels on the technical ladder (senior staff engineer) and management ladder (partner manager) net of performance rating and tenure in position. To assess whether the data support our step stool hypothesis, we test for significantly higher odds of advancement for a gender and race group into midlevel jobs on the technical ladder (SE4) and management ladder (MGR1) net of performance ratings and tenure in position. To assess whether the data support our sticky floor hypothesis, we test for significantly lower odds of advancement for a gender and race group—or a 0 coefficient indicating no members of a group were promoted—compared with White men out of the lower job rungs (SE3) into the next level on the technical ladder (SE4) and management ladder (MGR1) net of performance ratings and tenure in position. In all cases, we use p < .05 as our threshold for statistical significance.
Results
Across three sets of analyses, we find strong support for the step stool hypothesis and partial support for the glass ceiling and sticky floor hypotheses.
Glass Ceiling
We find support for the glass ceiling hypothesis on the technical track for women of all races and ethnicities and Black, Latinx, Native, and Pacific Islander men.
Promotion to the highest job level on the technical ladder, senior staff engineer, during the four years of our study, was a fairly rare event, with eight people receiving this promotion, all of whom were White or Asian or Asian American men. The odds of receiving this promotion were approximately 4 percent for a White or Asian or Asian American man in the eligibility pool at the average tenure in position and performance rating of those who were promoted (see Figure 3 and the 1.22 coefficient in Table 4, Model D, row 4). For all other groups, the odds of promotion to senior staff engineer were zero net of performance ratings and experience. That is, of the 10 percent (n = 32 people, 69 person-years) of staff engineers who were women (of any race or ethnicity) or Black, Latinx, Native, or Pacific Islander men, none were promoted to senior staff engineer over the four years of our analysis. This is true despite the majority matching the performance ratings of the White and Asian or Asian American men who were promoted to senior staff engineer (i.e., ratings of 8 or 9) and approximately 30 percent of those with such high performance ratings having spent equivalent or more time at the staff engineer job level as the White and Asian or Asian American men who were promoted. These data support a glass ceiling hypothesis on the technical track for all groups of women and Black, Latinx, Native, and Pacific Islander men (see Figure 3 and the 0 coefficients in Table 4, Model D, rows 1–3 and 5). Black, Latinx, Native, and Pacific Islander women on the technical ladder were especially disadvantaged given that no Black, Latinx, Native, or Pacific Islander women in the eligibility pool were promoted to either the highest or second highest technical level, the staff engineer job level, despite similar average performance ratings and tenure in position to other groups in the eligibility pool (see the 0 coefficients in Table 4, Model C, row 3). 6 In contrast, contrary to our prediction, we find no clear evidence of a glass ceiling for Asian and Asian American men on the technical track.

Glass ceiling on technical ladder. Probability of promotion to senior staff engineer by gender and race net of tenure in position in prior year and performance rating in prior year.
Promotions up the Technical Ladder by Gender × Race Group, Logistic Regression Odds Ratios, 2014–2017.
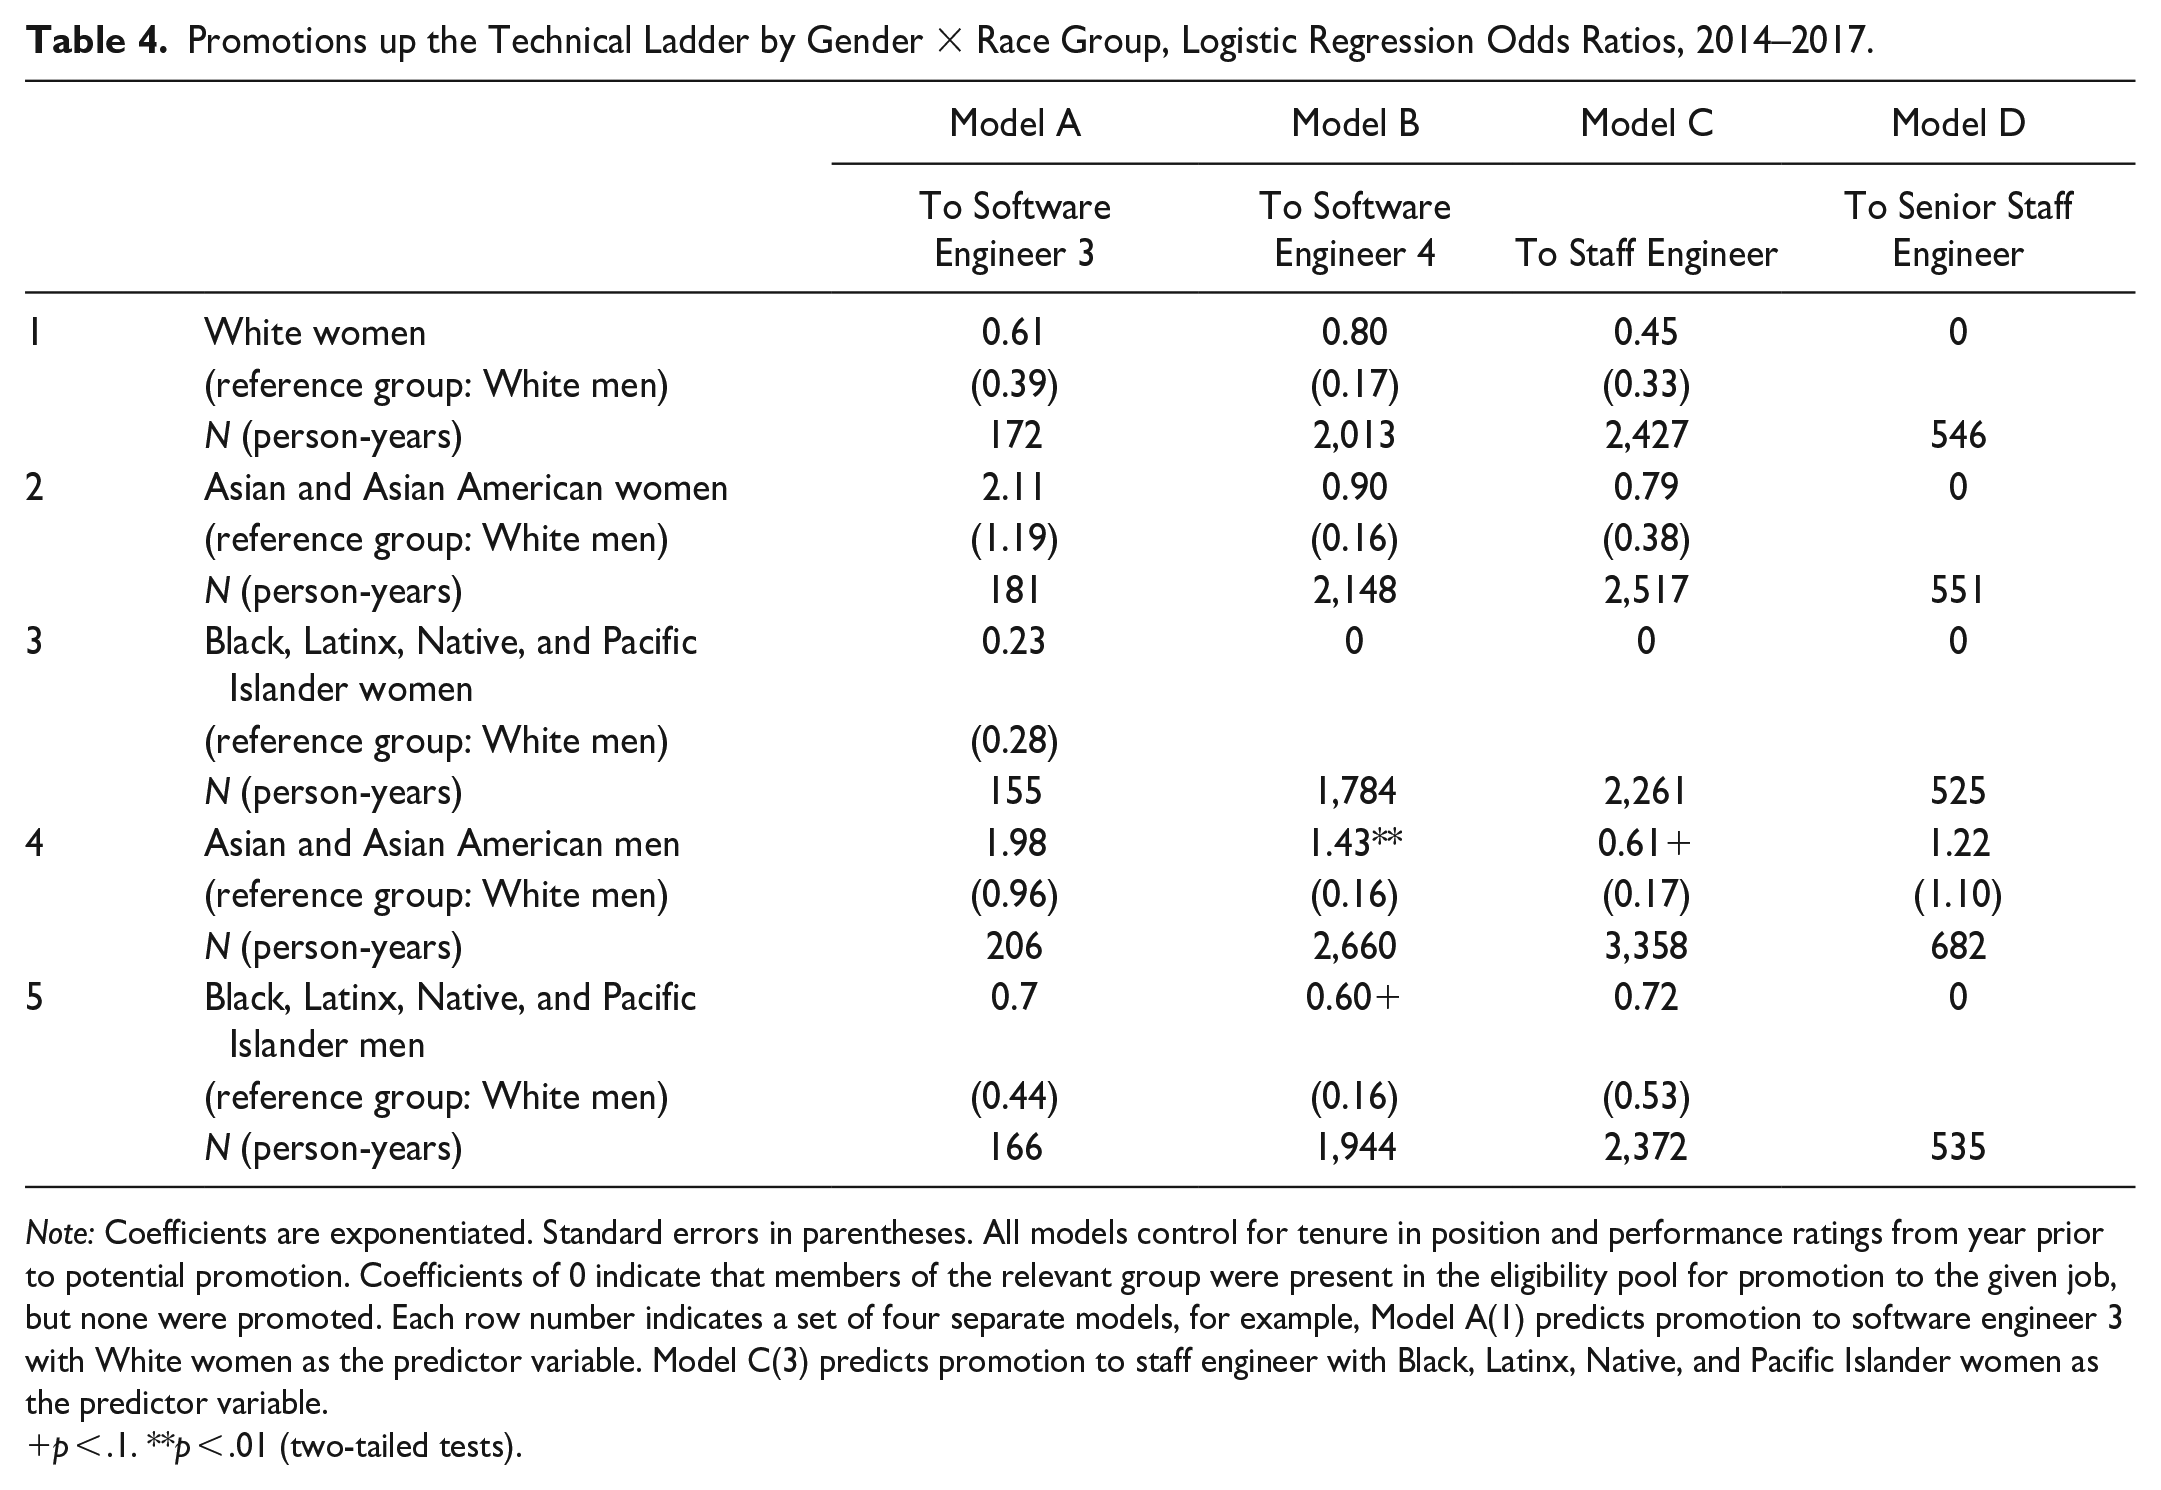
Note: Coefficients are exponentiated. Standard errors in parentheses. All models control for tenure in position and performance ratings from year prior to potential promotion. Coefficients of 0 indicate that members of the relevant group were present in the eligibility pool for promotion to the given job, but none were promoted. Each row number indicates a set of four separate models, for example, Model A(1) predicts promotion to software engineer 3 with White women as the predictor variable. Model C(3) predicts promotion to staff engineer with Black, Latinx, Native, and Pacific Islander women as the predictor variable.
p < .1. **p < .01 (two-tailed tests).
The data also support the glass ceiling hypothesis for Black, Latinx, Native, and Pacific Islander women on the management track. Although the odds of promotion to the highest level on the management ladder, partner manager, ranged from 6 percent to 10 percent for workers with the average tenure in position and performance rating of those who were promoted in all other gender-race groups, no Black, Latinx, Native, and Pacific Islander women were present in the eligibility pool for promotion to partner manager, that is, at the senior manager job level. In addition, despite similar performance ratings and tenure in position to other workers at the MGR2 and staff engineer levels (the feeder jobs into the senior manager job level), no Black, Latinx, Native, and Pacific Islander women were promoted to senior manager (see Figure 4 and 0 and “—” coefficients in Table 5, Models C3 and D3). In contrast, contrary to our predictions, we do not find support for the glass ceiling hypothesis on the management track for White women, women and men of Asian descent, or Black, Latinx, Native, and Pacific Islander men: The odds that members of these groups were promoted to partner manager were not significantly different from the odds of White men net of performance ratings and tenure in position (see Figure 4). In addition, men of Asian descent are the only one of these groups with nominally (although not significantly) lower rates of promotion to partner manager than White men.

Glass ceiling on management ladder. Probability of promotion to partner manager by gender and race net of tenure in position in prior year and performance rating in prior year.
Promotions up the Management Ladder, by Gender × Race Group, Logistic Regression Odds Ratios, 2014–2017.

Note: Coefficients are exponentiated. Standard errors in parentheses. All models control for tenure in position and performance ratings from year prior to potential promotion. Coefficients of 0 indicate that members of the relevant group were present in the eligibility pool for promotion to the given job but none were promoted. Coefficients of “—” indicate that no members of the relevant group were present in the eligibility pool for promotion to the given job. Each row number indicates a set of four separate models. Model A1 predicts promotion to Manager 1 with White women as the predictor variable. Model C3 predicts promotion to senior manager with Black, Latinx, Native, and Pacific Islander women as the predictor variable.
p < .1. **p < .01 (two-tailed tests).
Step Stool
We find support for the step stool hypothesis for men of Asian descent on the technical track and White women on the management track.
Men of Asian descent were advantaged in promotion to midlevel technical jobs (SE4) net of tenure in position and performance ratings but had no such advantage for high-level technical jobs (see Figure 5 and Table 4, Models B4–D4). As expected, promotion to SE4 was much more common than promotion to the highest job levels—senior staff engineer and partner manager—which we assessed to test the glass ceiling hypothesis. Among workers at SE3 with the average tenure in position and performance rating of those who were promoted, the odds of receiving a promotion to SE4 for a man of Asian descent was approximately 24 percent compared to approximately 18 percent for a White man (p < .01; see Figure 5 and the 1.43 coefficient in Table 4, Model B4). The data support the idea that this advantage is only a “step stool,” or small lift, and not a boost into high levels on the technical ladder given that men of Asian descent faced a marginally significant disadvantage compared with White men in promotion to the next level on the technical ladder, staff engineer, where the odds a man of Asian descent was promoted are 61 percent of the odds of a White man net of performance and experience (p = .07; see the .61 coefficient in Table 4, Model C4).

Step stool and sticky floor on technical ladder. Probability of promotion to software engineer 4 by gender and race net of tenure in position in prior year and performance rating in prior year.
Providing additional support for the step stool hypothesis, we find White women were advantaged for promotion into midlevel management positions net of tenure in position and performance. Although promotions into midlevel management positions were much rarer than promotions into midlevel technical positions, among workers in the eligibility pool with the average tenure in position and performance rating of those who were promoted to an MGR1 position, the odds of receiving this promotion for a White woman were approximately 3.2 times greater than the odds of a White man (approximately 5 percent compared with approximately 1.6 percent; p < .01; see Figure 6 and the 3.2 coefficient in Table 5, Model A1). In addition, although only borderline significant by conventional standards (p = .052), White women experienced an advantage over White men for promotion to MGR2 positions as well, with odds of promotion 79 percent greater than those of a White man net of performance and time in position (see the 1.79 coefficient in Table 5, Model B1). Beyond MGR2 level, White women’s advantage disappears, and they were not advantaged (nor disadvantaged) in terms of promotion to high-level management jobs.

Step stool and sticky floor on management ladder. Probability of promotion to manager 1 by gender and race net of tenure in position in prior year and performance rating in prior year.
Sticky Floor
Finally, we find support for the sticky floor hypothesis for Black, Latinx, Native, and Pacific Islander women on both the technical and management tracks.
Among workers at the SE3 job level with the average tenure in position and performance rating of those who were promoted to SE4 (the most common first promotion on either ladder), the probability that a woman was promoted is around 15 percent compared with 19 percent for a man. This means a woman’s odds were approximately 75 percent of the odds of a man net of tenure in position and performance ratings in the previous year (p < .05). When we consider the data by gender and race together, however, we see that this result is largely driven by the strong disadvantage that Black, Latinx, Native, and Pacific Islander women experience in promotion to SE4 (represented by the 0 coefficient in Table 4, Model B3; see Figure 5). Indeed, not 1 of the 12 Black, Latinx, Native, or Pacific Islander women (n = 21 person-years) in the eligibility pool for promotion to SE4 was promoted to SE4 during the 4 years of data we examined despite having spent significantly longer at the SE3 level than other workers (4 years, on average, compared to 1.9 years, p < .001) and having similar performance ratings to workers of other gender and race groups at the eligible job level of SE3. 7
Our findings support the sticky floor hypothesis for Black, Latinx, Native, and Pacific Islander women on the management track as well. Similar to the technical track, on the management track, not 1 of the 19 (n = 34 person-years) Black, Latinx, Native, or Pacific Islander women in the eligibility pool for promotion to MGR1 was promoted to MGR1 during the 4 years of study (represented by the 0 coefficient in Table 5, Model A3; see Figure 6) despite having spent significantly longer at the feeder job levels to MGR1 than other workers (2.9 years, on average, compared to 1.9 years, p < .05) and having similar performance ratings to workers of other gender and race groups in the eligibility pool. 8 In addition, only one woman from these racial or ethnic groups was promoted into a MGR2 position during the 4 years of study (represented by the 1.94 coefficient in Model B3 of Table 5).
Finally, although not always statistically significant, the coefficients trend in the expected direction for all groups predicted to experience a sticky floor on each ladder, lending further support for the sticky floor hypothesis. The odds of promotion from the lowest levels for each of these groups are 60 percent to 90 percent of the odds of promotion for White men on both ladders net of performance and experience. 9
In sum, these findings support our hypotheses that inequalities in organizational advancement by gender and race occur throughout workers’ careers and not just at the top, where most research on inequality and advancement has focused. Figure 7 provides a visual representation of these patterns, and Table 6 summarizes our hypotheses and findings. As we show, the data support the existence of a glass ceiling on the technical ladder for women of all races and ethnicities and Black, Latinx, Native, and Pacific Islander men and for Black, Latinx, Native, and Pacific Islander women on the management ladder as well. The data support the existence of a step stool for men of Asian descent on the technical ladder and for White women on the management ladder. And the data support the existence of a sticky floor for Black, Latinx, Native, and Pacific Islander women on both ladders. Together, these findings show that the gender and race inequalities so evident in Figures 1 and 2 are a result not only of an advantage to White men at the top of the organizational hierarchy but also of deep disadvantages to certain groups that start at the lower rungs of the ladder coupled with early advantages to other groups that fade out by midlevel career transitions. The pathways and barriers that this research identifies reinforce inequality and help maintain prevailing societal and organizational race and gender hierarchies.
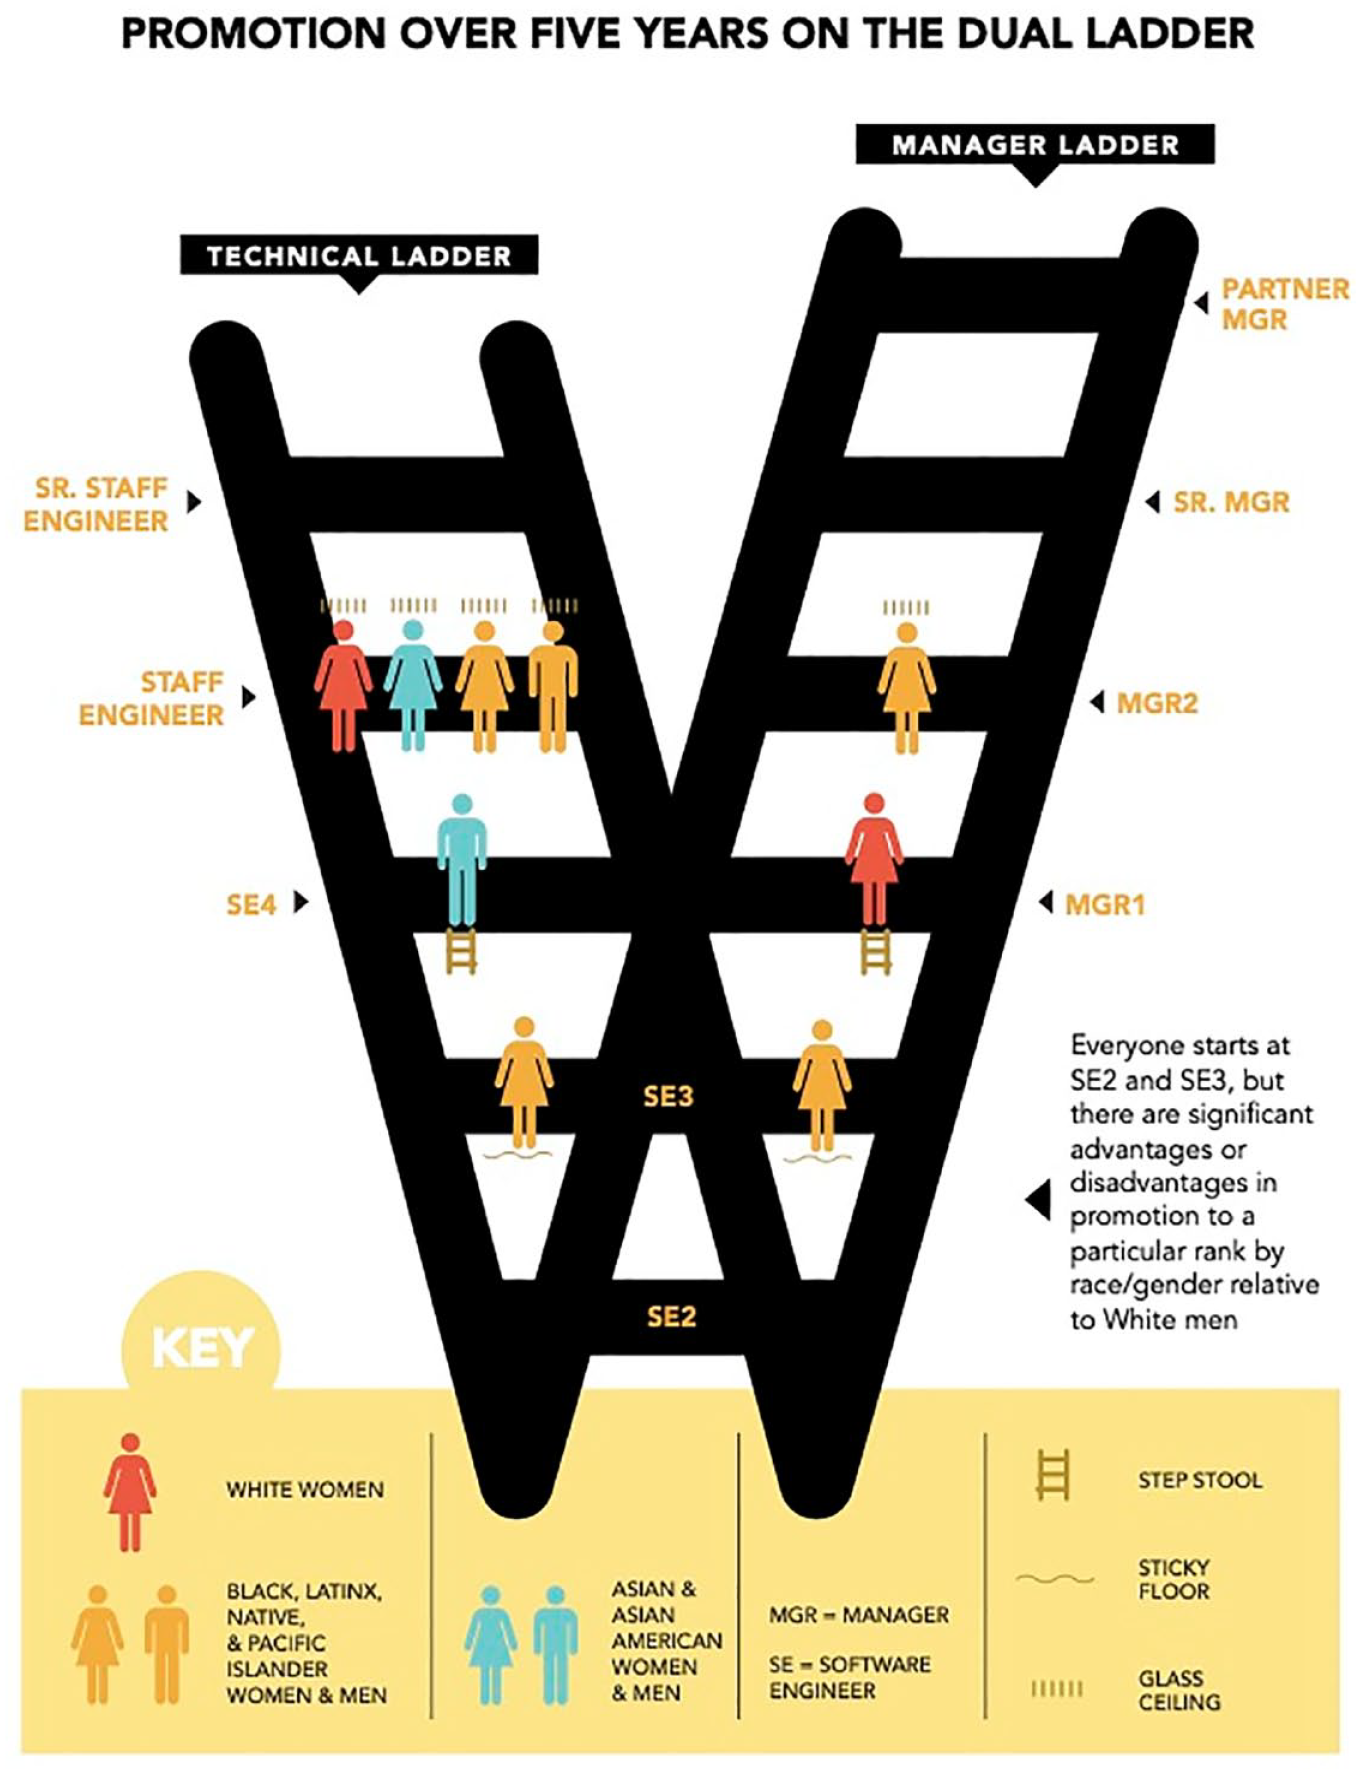
Promotion over five years on the dual ladder.
Summary of Hypotheses and Findings by Intersectional Gender and Race Group.

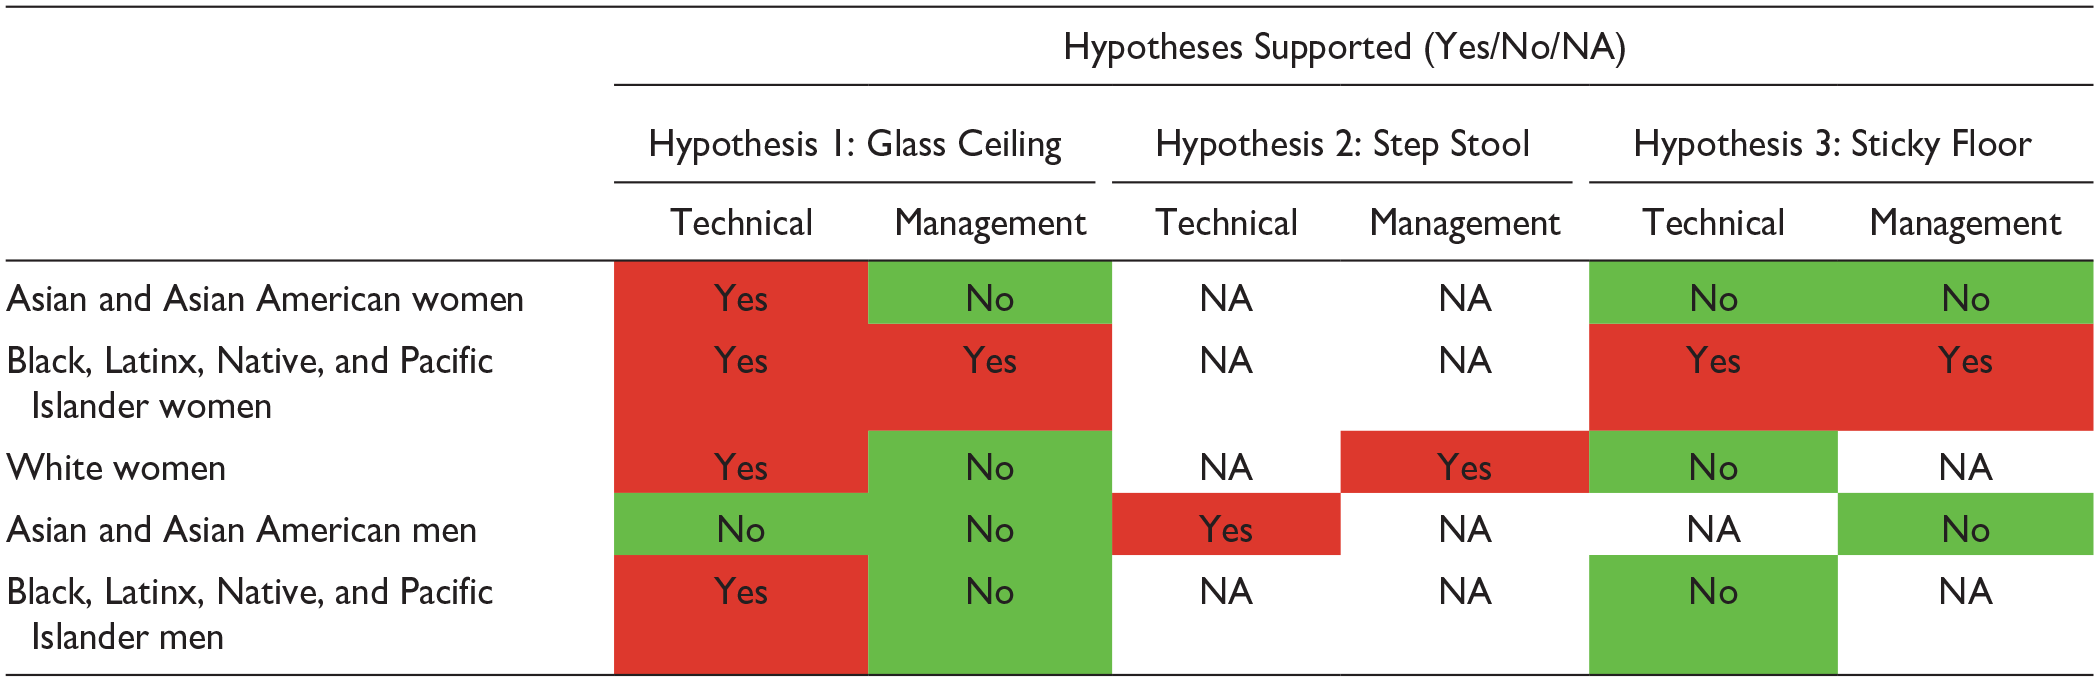
Note: Glass ceiling: high-level promotion disadvantage (to senior staff engineer or partner manager). Step stool: midlevel promotion advantage (to software engineer 4 or manager 1). Sticky floor: low-level promotion disadvantage (to software engineer 4 or manager 1). NA = no hypothesis was made for this group at this level. Red cells indicate that the hypothesis was supported and the hypothesized group experienced a glass ceiling, step stool, or sticky floor. Green cells indicate that the evidence did not support a glass ceiling or sticky floor for the hypothesized group.
Discussion
Organizations are critical sites for mitigating, maintaining, or exacerbating societal inequalities. Tilly (1998:15) argues that “the reduction or intensification of racist, sexist, or xenophobic attitudes will have relatively little impact on durable inequality, whereas the introduction of new organizational forms . . . will have great impact.” Equitable promotion practices is one such organizational form. The relational theory of workplace inequality predicts that status inconsistencies between a person’s identity characteristics—such as gender and race—and their position in an organization may reduce or reverse long-standing inequalities (Tomaskovic-Devey 2014; Tomaskovic-Devey et al. 2009). Promotion is the mechanism by which members of lower-status gender and race groups ascend an organizational hierarchy, potentially generating such status inconsistencies between identity characteristics and organizational position. For this reason, understanding promotion patterns by gender and race is essential for understanding societal inequality.
This study builds on the growing body of research emphasizing the importance of considering gender and race together to understand inequalities created and maintained in organizations (Berdahl and Moore 2006; Cech 2022; Rosette et al. 2016, 2018; Wingfield 2009). The results shown here underscore how workers’ advancement into particular jobs upholds intersectional race and gender inequality. Although such inequality is very visible in most organizations, with certain groups leading the organization (often predominantly White men) and other groups at the lowest rungs (often predominantly women of color; see Figures 1 and 2), identifying precisely where in the organizational hierarchy racialized gender disparities in promotion occur has remained elusive due to the difficulty of accessing data that permit such analysis. Through our collaboration with TECH INC., we obtained longitudinal organizational data that allowed us to explore how the promotion process varies by race and gender across job levels in an actual organization. Analyzing case studies of within-firm instances of gender and racial differences in outcomes—as we have conducted here—is vitally important because workers from higher-status groups often perceive an “illusion of fairness” and often react negatively to members of lower-status groups who claim injustice (Avery et al. 2023; Kaiser et al. 2013). Yet when members of higher-status groups recognize unfairness, perhaps by reading case studies like this one, research suggests they may be genuinely motivated to rectify it (e.g., Banfield and Dovidio 2013).
To summarize our findings, in the software engineering department of one large U.S.-based technology company, advancement patterns overall were largely equitable by intersectional gender and race group. However, promotions were not equitable at the intersection of race, gender, and particular positions, contributing to gender and racial inequalities in the organization. Most notably, our findings shed light on the deep disadvantages Black, Latinx, Native, and Pacific Islander women face in a technology organization filled mostly with White and Asian or Asian American men. Black, Latinx, Native, and Pacific Islander women were very underrepresented in this department compared to population estimates, making up less than 1% of the workforce. On top of this very low representation, results show that Black, Latinx, Native, and Pacific Islander women experienced substantial barriers to promotion on both the technical and management ladders, both at the bottom (sticky floor) and at the top (glass ceiling) of the corporate hierarchy. Our findings also demonstrate at a workforce level the step stool into management for White women in the technology industry that has been suggested and theorized using a smaller, qualitative data set (Alegria 2019) and reveal a step stool for Asian and Asian American men on the technical ladder in the technology industry that to our knowledge has not been described elsewhere in the academic literature. Finally, our findings show that White and Asian or Asian American women and Black, Latinx, Native, and Pacific Islander men join Black, Latinx, Native, and Pacific Islander women in facing a glass ceiling on the technical ladder preventing access to the highest-status organizational positions. Importantly, these differences in advancement by gender and race are apparent after controlling for performance ratings and tenure in prior position: In other words, despite similar performance evaluations and time in previous position, workers’ odds of promotion varied in ways that reproduce existing societal gender and racial inequalities within an organization.
Racialized Gender Stereotypes as a Potential Mechanism
How does this kind of “tracking” happen? One possibility is that evaluators rely on intersectional racialized gender stereotypes when deciding which workers to promote to particular positions. Research shows that actors often rely on stereotypes and automatic cognitive biases as shortcuts when making decisions, especially when under time constraints, as workers in professional settings often are today (Baron and Pfeffer 1994; Petersen and Saporta 2004; Reskin 2000).
The patterns identified here are consistent with what we know about racialized gender stereotypes in the United States. The glass ceiling that women of all races and ethnicities and Black, Latinx, Native, and Pacific Islander men face on the technical ladder aligns with stereotypes in the United States that associate leadership with whiteness (Gündemir et al. 2014; Rosette, Leonardelli, and Phillips 2008) and stereotypically masculine traits, such as assertiveness, agency, and risk-taking (Eagly and Carli 2007; Rudman et al. 2012; Schein 1973). In the context of an engineering work environment, technical roles are typically afforded the highest status and seen as more masculine than management roles (Alegria 2019; Luhr 2024; Mickey 2019), so it is not surprising that we found the highest level technical positions are the jobs most inaccessible for the most groups. Likewise, the step stool on the management ladder for White women aligns with stereotypes of White women as nontechnical and communal, with strong interpersonal skills and social awareness, characteristics often viewed as desirable in middle managers (Glick and Fiske 1999; Rudman and Glick 2001). In the same way, the step stool on the technical ladder for Asian and Asian American men aligns with stereotypes of people of Asian descent as highly competent, especially in the technical-quantitative domain, and low in sociability and dominance (Benard et al. 2023; Berdahl and Min 2012; Fiske et al. 2002; Okura 2022). It is not surprising that we found the step stool is confined to men (and not women) of Asian descent given that stereotypes of technical competence for Asian and Asian American women combine with broad gender stereotypes that challenge women’s technical proficiency (Rosette et al. 2016; Shih, Pittinsky, and Ambady 1999). The sticky floor and glass ceiling on both ladders that Black, Latinx, Native, and Pacific Islander women face align with stereotypes of low competence for these groups and invisibility in a context where the standard of success is largely White and male (Purdie-Vaughns and Eibach 2008; Sesko and Biernat 2018).
Whether the findings shown here are the result of discrimination against certain groups or favoritism for other groups is unclear. There is some evidence that it is the favoritism or advantages provided to members of higher-status groups—rather than discrimination toward lower-status groups—that is the primary mechanism by which inequality is reproduced in the United States today (DiTomaso 2015). The findings shown here could result from preferential treatment given to White men, the most well-represented group at each job level on both ladders, in line with stereotypes that associate White men with leadership, agency, and quantitative aptitude.
Despite the visibility of overarching organizational race and gender inequality, racialized gendered outcomes are likely often invisible to decision makers at any given evaluation point—such as at the point of promotion to a particular position, as we have looked at here. American ideals of individualism and meritocracy make it difficult for Americans, especially those privileged by race and/or gender, to recognize the persistent inequalities and injustices associated with identity characteristics (Bell 1992; Bonilla-Silva 2006; Hamilton, Hartmann, and Larson 2022). Therefore, it is not surprising that organizations filled mostly with workers from higher-status gender and race groups and with strong narratives of meritocracy, as most technology companies including TECH INC. have, are often among the most biased (Castilla and Benard 2010). We find bias may exist in such organizations even when there is strong concern about equalizing outcomes by gender. Yet, even if inequitable outcomes are invisible to decision-makers at the point of evaluation, it is possible that other workers sense the racialized gendered inequities in promotion practices with significant consequences for organizational wellness and employee health (Cech, Blair-Loy, and Rogers 2018; Roscigno, Yavorsky, and Quadlin 2021). Decades of research suggests that such disparities—even when ambiguous—are harmful (e.g., Doering, Doering, and Tilcsik 2023). Feeling less respected than others is associated with an array of negative physical and mental health outcomes (Douds and Hout 2020; Triana et al. 2019).
Research points to several practices for creating more equitable organizations. Establishing clear criteria for promotion has been found to facilitate more equitable outcomes (Correll 2017; Heilman and Caleo 2018; Uhlmann and Cohen 2005). Likewise, increasing transparency in the decision-making process and putting in place accountability mechanisms have been found to reduce the effect of actors’ biases on outcomes and reduce gender and race reward gaps (Castilla 2015; Kalev, Dobbin, and Kelly 2006; Tetlock 1992). The less accountable decision makers are for their decisions, the greater the opportunity for subtle ascriptive biases to emerge, negatively affecting the fair distribution of rewards among workers (Castilla 2008). An analysis of managerial diversity in 816 U.S. workplaces over 30 years found that activating accountability in decision makers resulted in more diverse workforces. Without accountability, they found that performance evaluations helped White men, whereas when managers were held accountable for their decisions, performance evaluations helped Black men, Black women, and Latinx women (Dobbin, Schrage, and Kalev 2015). Increasing accountability among decision makers by monitoring promotion outcomes into specific positions by gender and race is one possible approach to reducing gender and race inequalities in organizations like the ones we found at TECH INC. Although considering race when evaluating advancement patterns has never been without controversy in the United States, organizational leaders may be especially concerned that considering race in promotion decisions will face scrutiny and perhaps legal challenge following the 2023 U.S. Supreme Court ruling striking down race-conscious admissions in higher education. Although specifying that a given promotion must be awarded to a worker of a specific race and gender may be impermissible (and perhaps undesirable), using organizational data to ensure that the gender and race composition of workers who are promoted into positions roughly matches the candidate pool is well within an organization’s rights (Zheng 2023). In the absence of such monitoring, racialized gendered outcomes are likely to remain invisible at the evaluation stage and therefore likely to persist, impeding goals of establishing meritocratic organizations where gender and race are no longer such powerful predictors of unequal outcomes.
Limitations and Suggestions for Future Research
This study has some important limitations. First, our data are from a single organization. As past scholars have noted when using data from a single company, however, there is reason to believe that this company is not substantially different from others (Castilla 2008). In particular, our context is typical of many organizations in one important respect: Leaders at TECH INC. began their efforts to increase the demographic diversity of their workforce by focusing first on gender. When we went to TECH INC. to present our initial findings, the meeting ground to an early halt when organizational leaders saw that our analyses looked at promotion into positions by gender and race together. Some posited that looking at gender “in the aggregate,” without breaking out results by race, would have been a more fruitful analytical approach. This “women first” approach is typical of many organizations’ early efforts to increase the diversity of their workforce. Organizations often focus first on women (as a monolithic group), which typically means White women, with the intent of moving on to other groups later (Chiu 2022; Rights CoLab 2022). This approach is reminiscent of other social change efforts like the U.S. women’s suffrage movement over a century ago that focused first on White women, resulting in women of color being left behind (Newman 1999). Given this trend, common across organizations, it is not surprising that to the extent affirmative action has helped underrepresented groups in the workplace, it has helped White women the most (Kalev et al. 2006). If TECH INC.’s practices, structure, and demographics largely mirror that of the broader industry as we suspect they do (see DiMaggio and Powell 1983), we would expect to find similar results in other organizations. And if the patterns we found are generated by decision makers’ reliance on widespread stereotypes, as we suspect they may be, we will see similar patterns in different settings. It would be useful for future research to investigate promotion by gender, race, and job in other settings.
Second, certain demographic groups remain heavily underrepresented in many professional workforces, including the one studied here. This underrepresentation represents the pernicious societal problem that some groups lack meaningful access to high-status, influential, and lucrative jobs. Ironically, this underrepresentation also presents an obstacle for conducting research that might shed light on these inequities because of the challenges of making statistical claims about particularly small groups. For example, existing research suggests that Black women may face fewer penalties at the top of the ladder than women of other races and ethnicities (Ridgeway and Kricheli-Katz 2013; Rosette et al. 2016), but with so few Black women in our sample and the power of the sticky floor, we were unable to evaluate that hypothesis with conventional quantitative methods. Out of justifiable caution, researchers often say little about highly underrepresented groups, yet this has the consequence of making the experiences of members of these groups invisible (Wullert, Gilmartin, and Simard 2019). Because we wanted to include groups whose representation is low in our analyses, we made the choice to combine Black, Latinx, Native, and Pacific Islander men into one group and Black, Latinx, Native, and Pacific Islander women into another because there is some degree of overlap in stereotypes and potential experiences of intersectional invisibility. Although this approach ensures that these individuals are not completely erased, this choice is far from adequate because it fails to fully capture differences between these groups. This dilemma highlights the need for greater attention within the social sciences on how to present and analyze data from heavily underrepresented groups.
Finally, our data are not as intersectional as they could be, and that may affect our findings. For example, although our analyses found women of Asian descent were neither uniquely advantaged nor disadvantaged in either the technical or management track, this may not be representative of all Asian and Asian American women at TECH INC. In particular, there may be differences in the experiences of East Asian, South Asian, and Southeast Asian people; differences between U.S. native-born Asian people and those who immigrated to the United States; and potential differences along other axes. In addition, the concept of gender itself is rapidly evolving. Here, following our data, we treat gender as a binary category despite increasing numbers of people identifying their gender outside of that binary. It is our hope that future research will further explore the racialized gendered experiences of a wider variety of workers in more detail to better understand the full diversity of experiences within an organization.
Conclusion
In conclusion, the findings described here demonstrate that intersectional performance-reward bias in the promotion process is one way in which organizations remain racialized and gendered. Different odds of promotion into particular positions by race and gender despite equivalent performance and tenure help maintain the racialized gendered hierarchy so commonly observed in organizations. When organizations fail to monitor and evaluate promotion into specific jobs by gender and race, as was true in the organization we studied and in many organizations today, the advantage White men have in most organizations is upheld, and a racialized gendered hierarchy is likely to be created and maintained. Far from disrupting the prevailing social order, as many technology companies claim they do, the promotion process analyzed here mirrors and reproduces societal race and gender inequalities.