
Abstract
One of the strengths of vignette-based experimental research is that it captures the mental illness labeling process in the way it often occurs—inference without full information. Unfortunately, because the process of inferring a label is associated with confounding variables, such as perceived deviance and prior contact, it is difficult to measure the causal effect of inferred mental illness labels. To address these confounding variables, we advocate for the use of causal inference methods. Using causal inference methods, we analyze the 1996, 2006, and 2018 General Social Survey National Stigma Studies. We find that (1) an inferred mental illness label affects desired social distance, (2) the likelihood and effect of inferring a label differs across mental illnesses, and (3) causal inference methods that exact match on contact better approximate the causal effect of inferring a label. These findings underline the importance of clearly identifying effects of interest and causal methods’ utility for estimating these effects.
What is the unique effect of inferred mental illness labels on stigma and specifically, desired social distance? Addressing this question poses theoretical and methodological challenges. This article considers not only the effect of inferred mental illness labels on stigma but also the most accurate way to answer this question.
Applied mental illness labels (aka formal labels) are those provided externally, often by an officially sanctioned medical authority (Link and Phelan 2013). For example, an individual may learn of another person’s medical diagnosis from that person or through a shared social connection. In contrast, inferred mental illness labels are those that are deduced by an individual about another person. For example, someone may see another person behaving in a socially deviant manner and assume that this behavior is because that person has a mental illness.
Two main factors predict the likelihood of inferred mental illness labels: (1) prior contact with mental illness (Esterberg et al. 2008; Furnham and Blythe 2012; Hansson, Stjernswärd, and Svensson 2016; Lauber et al. 2003; Pullen et al. 2022; Svensson and Hansson 2016) and (2) the extent of deviant behavior (Lauber et al. 2003; Link et al. 1999; Nordt, Rössler, and Lauber 2005; Pescosolido 2013; Pescosolido et al. 2008, 2010; Sai and Furnham 2013). Thus, unlike applied labels, which could be assigned irrespective of personal experience or others’ deviant behavior, inferred labels depend on other social processes. Consequently, any theoretical model examining the impact of inferred mental illness labels on social distance should extend beyond these two variables (labeling and social distance) and also consider the factors that predict the application of an inferred label: contact and perceived deviance.
Moreover, although the effect of a mental illness label on social distance is often a primary concern, other factors also predict desired social distance toward individuals with mental illness. Specifically, contact and perceived deviance not only affect how frequently a label is inferred but also impact the effect of a label on desired social distance (Alexander and Link 2003; Corrigan et al. 2001; Couture and Penn 2003; Esterberg et al. 2008; Felix and Lynn 2022; Huff, Isbell, and Arnold 2023; Lauber et al. 2004; Link and Cullen 1986; Link et al. 1999; Manago and Mize 2022; Markowitz and Engelman 2017; Martin et al. 2007; Perry et al. 2022; Pescosolido 2013; Pescosolido, Manago, and Monahan 2019; Svensson and Hansson 2016; Wang and Lai 2008; Wolff et al. 1996). Thus, empirical models that estimate the effect of mental illness labels on desired social distance must account for contact and perceived deviance as confounding variables. In summary, any theoretical or empirical model predicting the effect of an inferred mental illness label on stigma must consider the factors influencing the likelihood of inferring a label. In this paper, we ask: Relative to deviant behavior alone, what is the effect of inferred mental illness labels on desired social distance? Given that the likelihood of inferring labels and desired social distance are affected by contact and perceived deviance, we also ask: What is the most appropriate modeling strategy for examining this question while accounting for confounding variables?
In what follows, we first discuss the theoretical challenges inherent with examining the effect of inferred labels on stigma. We pay particular attention to two important confounding factors: contact and perceived deviance. We then demonstrate how causal inference techniques allow for a more precise measurement of the effect of an inferred label relative to deviant behavior. Although causal inference methods have clear advantages for examining the effect of an inferred mental illness label on stigma, they are underutilized in existing literature. This article demonstrates the utility of such methods for estimating the effect of inferred labels on stigma. Specifically, using the 1996, 2006, and 2018 General Social Survey (GSS), we examine if inferred mental illness labels increase desire for social distance compared to deviant behavior alone and how this process varies across different mental illnesses.
Background
Both theoretically and methodologically, confounding variables pose challenges for understanding the effect of one variable on another. There are two main confounding variables associated with inferred labels and desired social distance: (1) prior contact with mental illness and (2) the characteristics of the mental illness (i.e., perceived deviance). In the following, we discuss each of these factors and how they may impact the likelihood of inferring mental illness labels and desire for social distance.
Prior Contact
Labeling
Contact with mental illness refers to interactions with another person with mental illness (Allport 1954). Contact encompasses a range of experiences and interactions (Pescosolido and Manago 2018), including but not limited to having personal experience, being close friends or family, and working with individuals with mental illness. Prior contact with mental illness is associated with a higher likelihood of correctly inferring mental illness labels (Esterberg et al. 2008; Furnham and Blythe 2012; Hansson et al. 2016; Lauber et al. 2003; Pullen et al. 2022; Svensson and Hansson 2016). Said otherwise, two individuals may witness the same behavior associated with mental illness, and the individual with prior contact with mental illness will be more likely to label it as a mental illness. Therefore, we predict the following:
Hypothesis 1: Individuals who have had contact with people with mental illness are more likely to infer a mental illness label (than those who have not had prior contact).
Stigma
In addition to correctly inferring a mental illness label, prior contact is also associated with lower stigma, including decreased desire for social distance (Alexander and Link 2003; Corrigan et al. 2001; Couture and Penn 2003; Esterberg et al. 2008; Felix and Lynn 2022; Lauber et al. 2004; Link and Cullen 1986; Markowitz and Engelman 2017; Perry et al. 2022; Pescosolido 2013; Svensson and Hansson 2016; Wang and Lai 2008; Wolff et al. 1996). To varying degrees, 1 contact decreases stigma. Therefore, we predict the following:
Hypothesis 2: Individuals who have had prior contact will hold less stigmatizing attitudes toward people with mental illness (than those who have not had prior contact).
Characteristics of Mental Illness
Consequences for labeling
The characteristics of an illness determine the likelihood of a mental illness being inferred. For example, compared to schizophrenia, illnesses such as depression and anxiety are less often recognized as a mental illness by the general public (Lauber et al. 2003; Link et al. 1999; Nordt et al. 2005; Pescosolido 2013; Pescosolido et al. 2008, 2010; Sai and Furnham 2013). The differential likelihood of inferring a label may be attributable to the extent to which the behaviors associated with mental illnesses such as schizophrenia are considered deviant relative to the behaviors associated with depression or anxiety (Conrad and Schneider 1992; Rosenberg 1984; Scheff 1966; Tse and Haslam 2023). Therefore, we predict the following:
Hypothesis 3: Mental illnesses that are considered to be more deviant (e.g., schizophrenia) are more likely to be recognized and labeled as mental illnesses than those that are not (e.g., depression or anxiety).
Consequences for stigma
Overall, when applied to an individual, a mental illness label is thought to increase stigma. Specifically, as detailed by modified labeling theory, because individuals have negative stereotypes of people with mental illness, when the label “mental illness” is applied to another person, so too are the negative stereotypes (Kroska et al. 2014; Kroska and Harkness 2008; Link et al. 1989; Link and Phelan 2013). A large body of research has found that compared to nonlabeled individuals, respondents hold greater stigma toward individuals with a mental illness label (for a review, see Link and Phelan 2013).
Importantly, however, the effect of a label on stigma depends on the characteristics of the mental illness (Huff et al. 2023; Link et al. 1987; Manago and Mize 2022; Schnittker 2008; Silton et al. 2011; Svensson and Hansson 2016). In particular, the specific behaviors associated with a mental illness appear to moderate the effect of a label (Perry 2011), with perceptions of dangerousness and subsequent fear playing a particularly important role (Huff et al. 2023; Link et al. 1987; Manago and Mize 2022; Schnittker 2008; Silton et al. 2011; Svensson and Hansson 2016). Specifically, individuals consistently and severely stigmatize people who are labeled with a fear-inducing mental illness, such as schizophrenia or most personality disorders (Martin et al. 2007; Martin, Pescosolido, and Tuch 2000; Pescosolido et al. 2013). In contrast, individuals do not as severely stigmatize people with a mental illness label that does not induce fear, such as anxiety or depression (Huff et al. 2023; Link et al. 1999; Manago and Mize 2022; Martin et al. 2007; Pescosolido et al. 2019). Furthermore, fear-inducing mental illness labels are associated with increased stigma, whereas fear-neutral mental illness labels are associated with either no effect or, in some cases, decreased stigma (Link et al. 1987; Manago and Mize 2022; Schnittker 2008; Silton et al. 2011). Therefore, we make the following predictions regarding what will happen when reading about a vignette character displaying deviant behavior:
Hypothesis 4: The effect of a label will vary based on the behavior to which it is applied.
Hypothesis 4a: If the deviant behavior is fear-inducing, individuals will desire more social distance when a mental illness label is inferred (compared to when a label is not inferred).
Hypothesis 4b: If the deviant behavior is not fear-inducing, individuals will desire similar or less social distance when a mental illness label is inferred (compared to when a label is not inferred).
Summary
In summary, covariates such as prior contact with mental illness and the characteristics of a mental illness (deviance) may affect both the probability of inferring a label (Hypotheses 1 and 3) and the amount of desired social distance from a labeled person (Hypotheses 2 and 4). Therefore, the effect of an inferred label (and contact) on stigma may be confounded if these factors are not accounted for. Specifically, when assessing the effect of inferred labels on stigma, researchers may also be estimating the effect of contact or the characteristics of a mental illness (e.g., deviance or rarity) on desired social distance.
In this article, we precisely specify the causal effect(s) of interest and use a model that most accurately quantifies these effects (Lundberg, Johnson, and Stewart 2021). Regression models, which are commonly used to estimate the effect of inferred mental illness labels on stigma, may not adequately account for the fact that mental illness labels may be inferred at different rates. To accurately estimate the effects of inferred labels on stigma, researchers must: stringently account for the differences in the characteristics of individuals who infer labels and those who do not, and (2) account for differences in the rate at which certain mental illness labels are inferred. Causal inference matching methods use the logic of the experimental method applied to observational data where manipulation is infeasible, helping address potential confounds.
Methods
This project uses data from the 1996, 2006, and 2018 GSS National Stigma Studies. The response rates were 76.1 percent for 1996, 71.2 percent for 2006, and 59.5 percent for 2018. To achieve a large enough sample size to power our tests of the hypotheses, which require an examination of each mental illness separately, we pooled the data across years. Combined across years, the sample size for those who received the mental health modules is N = 4,054 before we make exclusions for missing data (see “Missing Data” section in the following). All data management and data analysis files needed to replicate the analyses shown in this article are available via GitHub https://github.com/biancamanago/mls_2024_socius_replicationFiles.
For our analyses, we first compare respondents who did and did not label. Specifically, we consider participants’ demographic characteristics and past contact with mental illness. Then, using causal inference techniques, we “match” on the vignette illness and theoretically relevant participant characteristics (e.g., demographics and prior contact). This matching process allows us to better isolate the effect of a mental illness label on stigma.
Vignettes
The GSS National Stigma Studies use vignettes—paragraph descriptions of a person’s life—to describe a person experiencing the symptoms of mental illness. Respondents were randomly assigned to one of five mental illness conditions, which vary in terms of the mental illness symptoms being experienced: normal “daily troubles” (control), alcoholism, drug addiction, 2 schizophrenia, and depression. The descriptions of the symptoms match criteria for the mental illnesses according to the Diagnostic and Statistical Manual of Mental Disorders.
Because these vignettes were randomly assigned, the characteristics of the vignette characters (including their mental illness descriptions) should not be correlated with respondent characteristics. The different vignettes did, however, produce important differences in the likelihood of participants’ labeling the vignette character’s behavior as a mental illness. The exact text of each vignette is included in the Appendix D in the supplemental material.
Dependent Variable: Desired Social Distance
The dependent variable, desired social distance—a common measure of stigmatization in the literature (Parcesepe and Cabassa 2013)—was constructed from respondents’ answers to six questions (Link et al. 1999; Star 1952, 1955). Specifically, respondents were asked “How willing would you be to . . . ?”: move next door to, spend an evening socializing with, make friends with, work closely on a job with, have marry into your family, have a group home opened in your neighborhood for people like [vignette character]? Response options were definitely willing, probably willing, probably unwilling, or definitely unwilling.
To preserve observations with some missing data, we include any respondent who answered at least half of the social distance items. We compute the mean of the answered items and use it as the dependent variable (Cronbach’s α = 0.863); the resulting scale ranges from 1 to 4, with the same interpretation as the original response options. Figure A4 in the Appendix in the supplemental material shows the distribution of the scale.
Focal Independent Variable and Covariates
Focal independent variable: labeling
The focal independent (treatment) variable, inferred mental illness label, was derived from participants’ answer to the question: “In your opinion, how likely is it that [vignette character] is experiencing a mental illness?” Responses ranged from 1 to 4, not at all likely to very likely. To facilitate the matching analyses, we binarize the variable. “Not at all” and “not very” likely responses are coded as not inferring a label, whereas “somewhat” and “very” likely responses are coded as inferring a label.
Personal contact with mental illness
Past work suggests that contact predicts both the likelihood of labeling and desired social distance. Therefore, we highlight the effect of contact in our models. Unfortunately, developing a composite measure of contact that can be used in a multiyear analysis of the GSS mental health modules is complicated by the lack of consistency in the questions asked across years (see Table A1 in Appendix in the supplemental material). We describe this lack of consistency and how we address it in the following sections.
Respondent’s own mental health history
In 1996, respondents were first asked, “Have you ever felt that you were going to have a nervous breakdown?” Twenty-five percent of respondents answered “yes.” Respondents who answered yes were then asked follow-up questions, which were later coded by researchers. One such question was designed to estimate the severity of the breakdown using a series of eight categories. We recoded this question such that 1 = severe and 0 = nonsevere (see code files for description). Of the respondents who said they had ever felt like they were going to have a nervous breakdown, 73 percent were coded as a severe breakdown. Respondents who answered no, they had not felt they were going to have a nervous breakdown, were then asked: “Have you ever felt you had a mental health problem”? Only 2 percent of respondents who responded to this question said “yes.” To account for potential issues with skip logic, we created a new variable in which anyone who had either felt they had a mental health problem or described having a severe nervous breakdown were counted among those who had firsthand experience with mental illness (roughly 16 percent). 3
In 2006, respondents who answered the questions in the mental health module were not asked about their own mental health. 4 Therefore, we have no measure of personal mental health experience for this year.
In 2018, respondents were asked, “Have you ever been diagnosed with a mental health problem?” Response choices included yes, no, don’t know, no answer, and not applicable. Compared to 1996, this is presumably a more conservative measure of an individual’s experience with mental health (because respondents were asked about a formal diagnosis as opposed to their own interpretation of their mental health). About 17 percent of respondents said yes, they had been diagnosed.
Mental health history of respondent’s contacts
In 1996, to measure respondents’ past contact with others with mental illness, some participants were asked, “Did you ever know anyone who was in a hospital because of a mental illness?” and “Have you ever known anyone (other than persons mentioned for being hospitalized) who was seeing a psychologist, mental health professional, social worker, or other counselor?” Response options to both questions were yes, no, don’t know, and no answer. About 51 percent of respondents knew someone who had been hospitalized, and nearly 60 percent of respondents knew someone who had seen a mental health professional. To capture any form of contact with individuals with mental illness, we created a new variable in which individuals who answered yes to either knowing someone who was hospitalized for mental illness and/or who had seen a mental health professional were counted as having had contact with someone with a mental illness. In total, 75 percent 5 of respondents in 1996 had some contact with individuals with mental illness.
In 2006, respondents were asked, “Leaving yourself aside, have you personally ever known someone who has received treatment for a mental health situation?” Response choices were yes, no, don’t know, and no answer. Overall, nearly 64 percent of respondents in 2006 knew someone who had received mental health treatment.
In 2018, respondents were asked, “Leaving yourself aside, have you ever known someone personally who has been diagnosed with a mental health problem?” 6 Overall, about 51 percent of respondents in 2018 reported knowing someone who had been diagnosed with a mental health problem.
Any contact: composite measure
In summary, questions varied across years. In 2006, respondents were not asked about their own mental health. When respondents were asked about their own mental health, questions varied across years. In 1996, respondents were asked if they ever felt as though they were going to have a nervous breakdown and if they had ever felt they had a mental health problem, whereas in 2018, respondents were asked if they had been diagnosed with a mental health problem.
In 1996, a subset of respondents 7 was asked if they knew someone who was hospitalized for mental illness or someone who had seen a mental health professional. In 2006, respondents were asked if they had ever known someone who has received treatment for a mental health problem, whereas in 2018, respondents were asked if they had ever known someone who has been diagnosed with a mental health problem.
To span these differences, we created a composite binary measure of “any contact” with mental illness. Individuals were coded as having had contact if they reported either personally experiencing a mental health problem or knowing someone else who had. As we describe in the following, because there is such significant variation in questions across years, we account for this in our focal matching analyses. 8
Additional contact measures for sensitivity analyses
Although we believe the binary measure of any contact described previously is the most appropriate to use for our main analyses because it provides a single consistent measure across years and mental illness vignettes, we create two additional measures for sensitivity analyses. The first, a self-versus-other contact measure separates out contact with others versus self-contact when such measures are available. The second, a contact valence measure, separates out contact that led to a “bad” outcome, such as a distressing interaction or a strained relationship, as was asked in the 2006 version.
Covariates
Our decision about which covariates to include in the analysis is driven by the causal logic of our theory and matching models (described in the “Analytic Strategy” section in the following). Specifically, we want to account for factors that, based on theory, are causally prior to inferring a label or not. Therefore, we focus on factors such as a respondents’ past contact with mental illness and their demographic characteristics. 9
We include a range of covariates that are potential confounders, including both measures used in past analyses and additional measures we expect to be confounders. First, we include the year of the survey in the analyses as a nominal variable for the three different surveys/years. 10 For respondent demographics, we include age, gender, race, household income, education, region of the United States, and the size of place (town, city, etc.) where the person resides. We primarily chose these demographic predictors to be consistent with previous work that has used the GSS to examine the effect of labeling on mental illness. 11
Many of these demographic characteristics also predict labeling and/or stigma toward mental illness, including race and ethnicity (Abdullah and Brown 2011, 2020; Anglin, Link, and Phelan 2006; Corrigan and Watson 2007; Parcesepe and Cabassa 2013; Pullen et al. 2022; Rao, Feinglass, and Corrigan 2007; Whaley 1997), education (Corrigan and Watson 2007), age (Bradbury 2020; Pescosolido et al. 2021; Schomerus et al. 2015), gender (Bradbury 2020; Corrigan and Watson 2007; Holman 2015), size/rurality of location (Jones, Cook, and Wang 2011; Martin et al. 2000; Schroeder et al. 2021), and household income (Golberstein, Eisenberg, and Gollust 2008; Holman 2015). 12 Additionally, some of these factors both affect the probability of labeling (Hansson et al. 2016) and/or moderate the effect of contact on mental illness (Wong et al. 2018). Table 1 provides more detail on these variables.
Descriptive Statistics (N = 3,920).
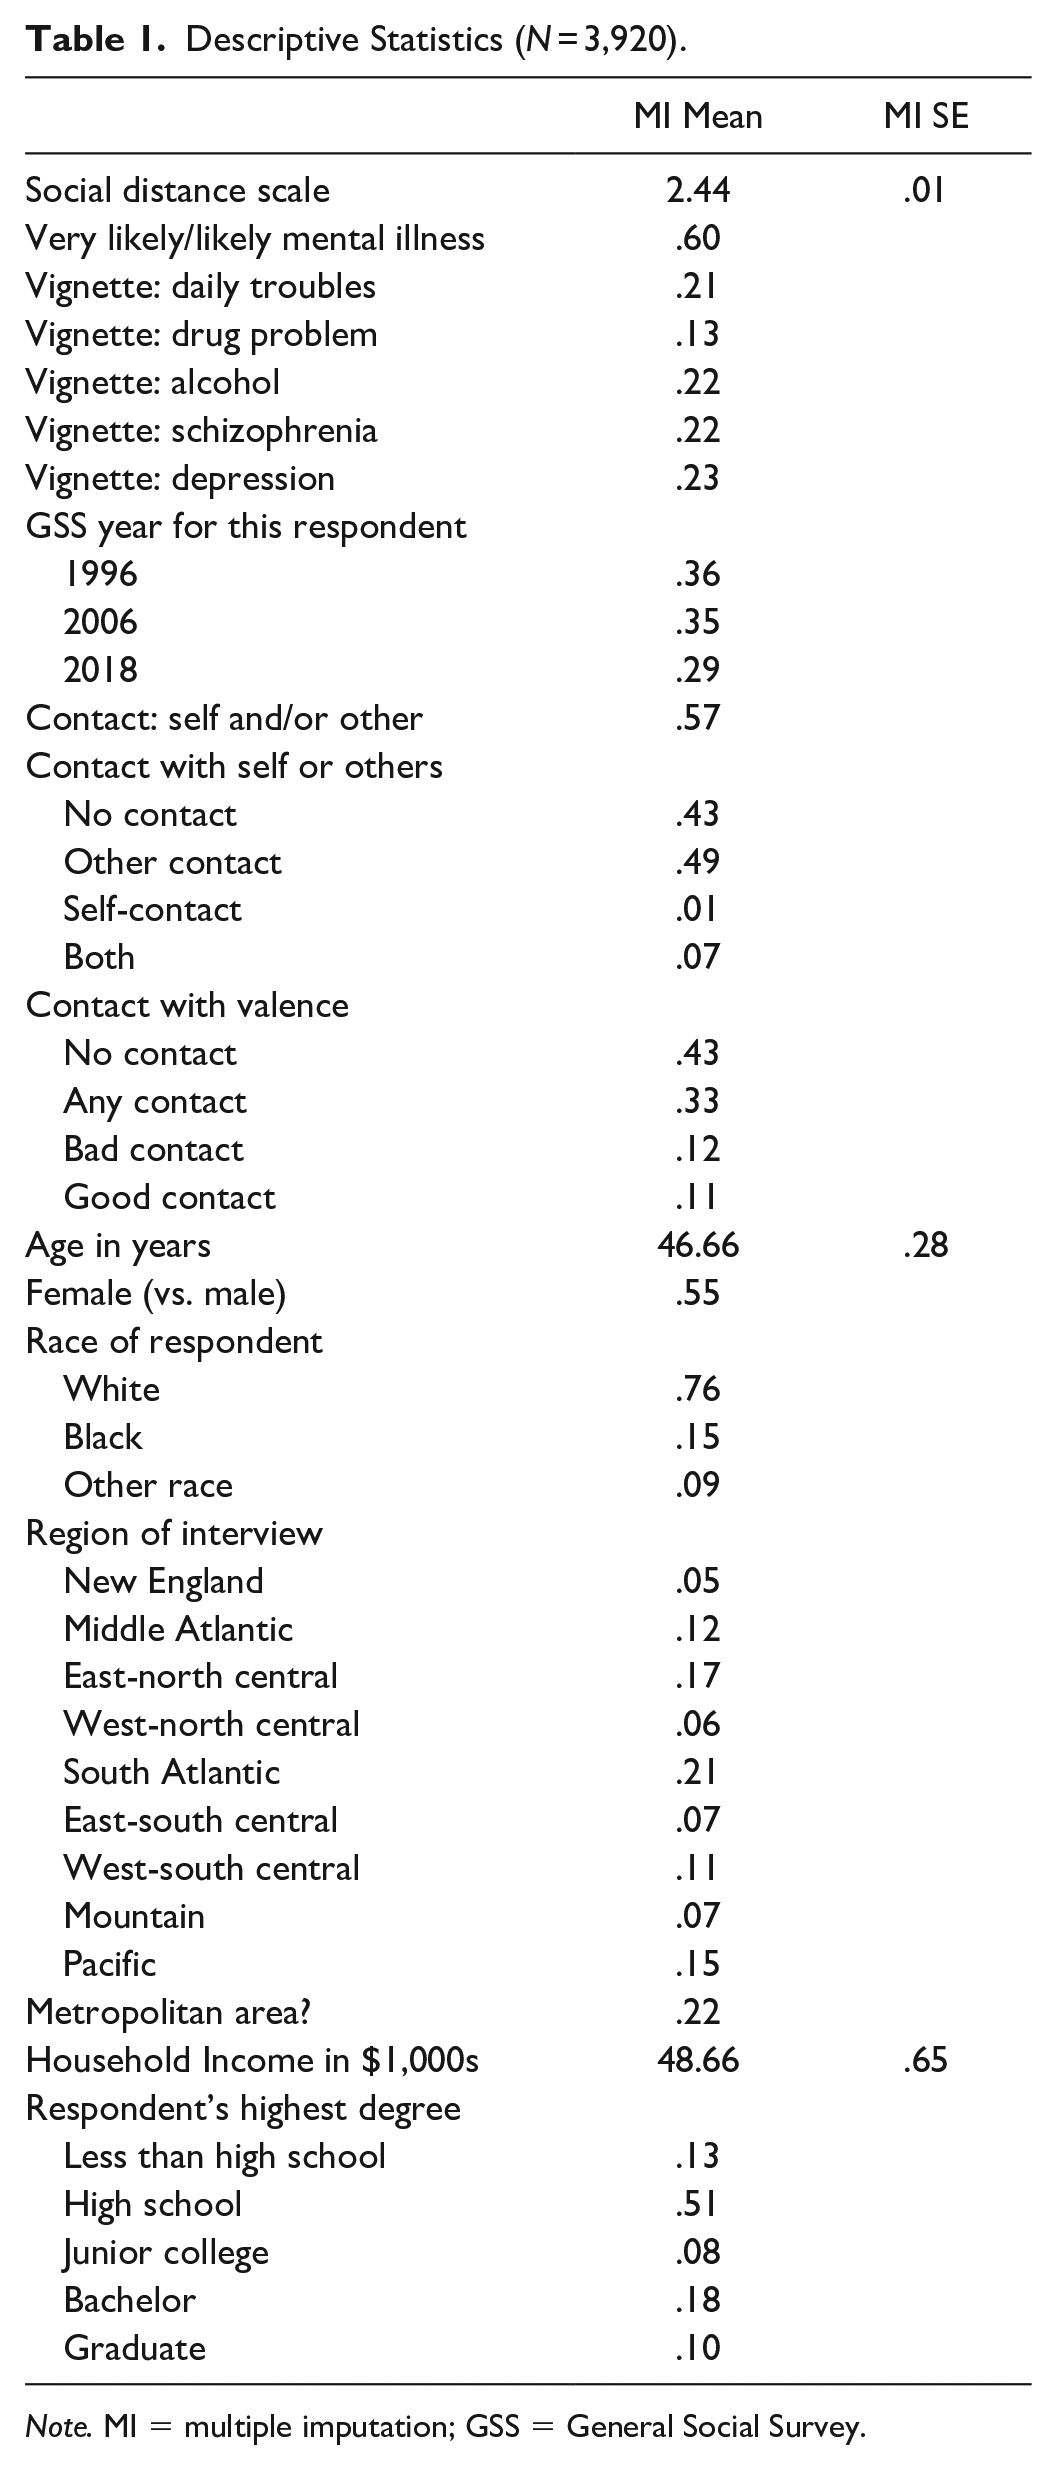
Note. MI = multiple imputation; GSS = General Social Survey.
Missing Data
Our starting sample size of complete observations is 4,054. We exclude all observations (133; 3.28% of the sample) with missing data on more than half of the items used to create the dependent variable (social distance scale). Of the covariates, household income has by far the most missing observations: 428, or 10.92 percent of the sample. An additional 221 observations (6.33 percent of the sample) are missing on other covariates.
To preserve cases with missing data on covariates, we use multiple imputation by chained equations. Following current best practices, we impute 20 complete data sets and confirm with von Hippel’s (2020) method that we have the adequate number of imputation data sets to ensure both stable estimates and standard errors. Multiple imputation preserves all but one observation missing data on a covariate; thus, the final sample size for analysis is 3,920. Table 1 includes descriptive statistics of the variables used for analysis. The reported statistic is the mean/proportion estimate using the multiply imputed data.
Analytic Strategy
We expect that those who do—and do not—infer a mental illness label from the vignettes will differ systematically. For example, those who have had personal contact with someone with a mental illness (e.g., a family member) may be more likely to recognize deviant behavior as indicative of a mental illness. To assess this possibility, we calculate balance statistics that show standardized differences in the characteristics of those who do and do not infer a mental illness label (Rosenbaum and Rubin 1985). A key benefit of this method is to examine differences across different variables on the same imbalance metric. We use the user-written Stata command balanceplot to visualize these standardized differences (Mize 2018).
In our focal analyses, we estimate the effect of mental illness labels on desired social distance. To help account for selection effects of who does or does not infer a mental illness label, we use causal inference matching techniques. 13 There is no consensus in the literature about which method is best—with different scholars advocating different approaches. Because causal inference matching techniques have not been widely used in the labeling literature, we estimate models in several ways and describe the strengths and weaknesses of each.
A popular and intuitively appealing approach is to “exact match” on all covariates, that is, to find an observation in the data that inferred a label and has a given set of characteristics (e.g., a woman with a college degree from the South) and to match that observation with one with the exact same characteristics (i.e., also a woman with a college degree from the South) but who did not infer a label. The difficulty with this method is that exact matches can be difficult to find with many covariates and/or with continuous covariates (e.g., age or income). Solutions to this problem are to reduce the number of covariates and/or to “coarsen” the continuous covariates. Although coarsening—where a continuous covariate is recoded as an ordinal variable with a few categories—can help, it removes information from the data, for example, taking a continuous measure of age and making it into a less informative “young, middle-age, or older” variable. 14 In addition, removing covariates can be problematic because accurate causal inference is dependent on necessary covariates being included in the model.
Here, we take a hybrid approach, exact matching on covariates we know are of the utmost importance based on theoretical and/or methodological reasons (e.g., type of illness and contact). This is akin to a block-randomized design in an experiment, where key factors are identified and manipulations are assigned within blocks to ensure perfect balance across these key factors. For all other covariates, we calculate a Mahalanobis distance metric and match the observation with the counterfactual observation (i.e., one with a different inference about the label) with the closest distance score. Mahalanobis distance is a standardized measure of distance in n-dimensional space and is a common metric used with matching methods. We exact match on the year of the survey for all analyses due to both the importance of time in stigmatizing attitudes toward mental illness and the differing ways contact was measured across years (Pescosolido et al. 2010). We use all other covariates in the construction of the Mahalanobis distance metric. To demonstrate the importance of personal contact with mental illness, we estimate two sets of models: one with contact included in the Mahalanobis distance calculation and one with contact instead included as an exact match.
The result of the matching analysis is an average treatment effect (ATE) that represents the average difference in social distance reported between (1) those who inferred a mental illness label and (2) the counterfactual observations who are similar but did not infer a mental illness label. The ATE is generally interpreted as the causal effect of the independent variable—here, labeling. We want to add a caveat that without random assignment and a true experimental design, we cannot be certain that the ATE is a true causal effect. In particular, the veracity of the ATE is dependent on the necessary covariates being included in the model and the model being correctly specified. Compared to traditional regression approaches, however, the matching techniques should better account for selection effects and further allow us to exact match on important variables—giving us greater confidence that the ATEs represent the true causal effect of inferred labeling.
Some of our hypotheses (e.g., Hypothesis 4) suggest differences across models (e.g., differences across mental illnesses). We are not aware of any method designed specifically to calculate the cross-model covariance that would be needed to provide an accurate statistical significance test as to whether the effect of labeling differs across two matching models. Research has shown, however, that bootstrapping is an appropriate method to test for cross-model differences when this covariance is not directly estimable (Mize, Doan, and Long 2019). Following this advice, we fit 1,000 bootstrap replications to produce an appropriate standard error and significance test for all cross-model differences described in the following.
All statistical significance tests reported are two-tailed with significance assessed at thep < .05 level.
Results
In reporting the results, we first discuss variation in likelihood of labeling by contact and type of illness (Hypotheses 1 and 3, respectively). We then discuss the consequences of the type of illness for stigma (Hypothesis 4). Finally, because there are so many different measures of contact that need to be examined, we report our tests of Hypothesis 2 in the sensitivity analyses.
Differences in the Likelihood of Inferring a Mental Illness Label
Those who labeled the behavior in the vignette as a mental illness differ from those who did not. Figure 1 shows standardized differences between those who did and did not infer a label—across all covariates. Positive differences indicate that higher levels of that covariate are associated with higher rates of labeling. One covariate stands out as having a substantial association with labeling: contact. Those who have personal contact with someone who has a mental illness are much more likely to label the vignette character as having a mental illness, providing support for Hypothesis 1. 15

Standardized differences in rates of labeling behavior as a mental illness.
Hypothesis 3 predicts that mental illnesses characterized by fear or emotional excess (e.g., schizophrenia) will be labeled at higher rates than illnesses that are not (e.g., depression). As predicted, rates of labeling the vignette character’s behavior as indicative of a mental illness differ substantially across vignette conditions. Figure 2 presents rates of labeling broken out across the different vignettes and the different survey years. We find that pooled across all three years, the vignette describing daily troubles was labeled as a mental illness by about 27 percent of respondents. In sharp contrast, about 92 percent of respondents labeled the behavior indicative of schizophrenia as a mental illness. Rates of labeling the drug addiction, alcohol addiction, and depression vignettes were somewhere in between these extremes (42 percent, 54 percent, and 73 percent, respectively). 16 These rates also differed somewhat across years. Overall, compared to respondents in 1996, respondents in 2006 and 2018 were more likely to label the behavior as a mental illness. By illness, schizophrenia, depression, and daily troubles were more likely to be labeled as mental illness in 2018 and 2006 than in 1996. Compared to 1996, alcohol abuse disorder was more likely to be labeled as a mental illness in 2018 but not in 2006. 17

Proportion of respondents who labeled vignette character as having a mental illness by vignette condition and survey year.
Figure 3 presents standardized differences across each of the five mental illness conditions. The largest single imbalance of any covariate across any vignette is contact. Contact is consistently associated with higher rates of labeling across all five conditions—however, this pattern is most pronounced for schizophrenia. In fact, overall imbalances are most stark for the schizophrenia vignette; for example, more educational attainment is clearly associated with higher rates of labeling—and labels are more often applied in more recent years.
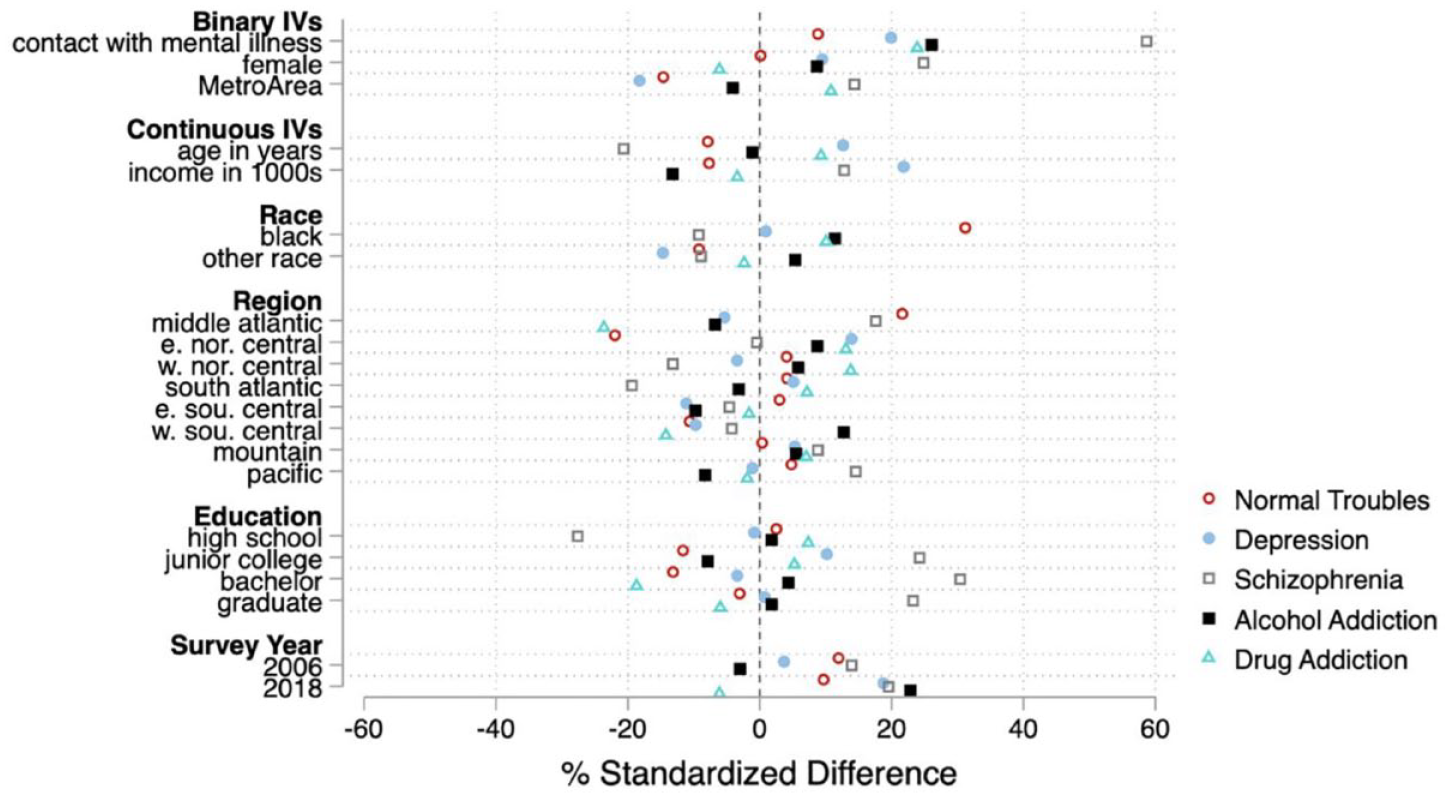
Standardized differences in rates of labeling behavior as a mental illness across each mental illness vignette.
Matching Analyses for Estimating the Effect of Labels on Stigma
To estimate the effect of mental illness labels on stigma, we present two sets of matching analyses. In the first set of analyses, contact is only included as a covariate in the Mahalanobis distance calculation. In the second set of analyses, contact is included as a covariate that is exactly matched. As noted in the analytic strategy, the presentation of these two different analytic approaches is designed to demonstrate the importance of personal contact with mental illness on labeling and stigma.
First, we examined covariate balance after matching. The results suggest all covariates are well balanced (all standardized differences < 9 percent; most close to 0 percent) except for contact (standardized difference = 18 percent after matching); for a visualization of covariate balance, see Figure A1 in the Appendix in the supplemental material. This is an initial suggestion that the models that exact match on contact will provide a better estimate of the effect of labeling (because this, by definition, reduces the standardized difference of contact to 0). Table 2 presents both sets of results.
Matching Results for Desired Social Distance Based on Labeling; Pooled and Separate Models for Each Vignette Condition (N = 3,920).

Note. Year of the survey is matched exactly in all analyses. For all other covariates described in the main text, a Mahalanobis distance is calculated and used to match respondents. Standard errors are in parentheses.
p < .05, **p < .01, ***p<0.001.
The top panel of Table 2 shows the results for the analyses where contact is not exact matched. For the pooled model, there is a small and nearly non-significant (p = 0.046) effect of labeling. For the individual vignettes, labeling only has an effect in the daily troubles condition and has a moderate effect size (ATE = 0.177). We observe no effect of labeling for any of the other four vignette conditions in these initial analyses.
Next, we fit a matching model that is otherwise identical but also exact matches on contact (for details on covariate balance, see Figure A2 in the Appendix in the supplemental material). The bottom panel of Table 2 presents the results, which show a mostly similar set of findings with two notable exceptions. For the pooled model, the effect is slightly larger and statistically significant (ATE = 0.087; p < .01). As for the specific vignettes, there are mostly similarities across matching models: Labeling leads to more desire for social distance in the daily troubles vignette but has no effect in the drug addiction, alcohol addiction, or depression vignettes. These null effects, especially for depression, provide tentative support for Hypothesis 4b, which suggests labeling will not have a stigmatizing effect for fear-neutral mental illnesses.
There is one notable exception in effects across the models in Table 2. After exact matching on contact, labeling shows a statistically significant effect on social distance for the schizophrenia vignette. The effect is relatively large, with labeling leading to about a 0.221 (.30 SD) increase in desired social distance. 18 This finding provides support for Hypothesis 4a, which suggests a stigmatizing effect of labeling for fear-inducing mental illnesses.
The results provide tentative support for Hypothesis 4 because the mental illness most associated with fear and dangerousness (schizophrenia) shows the largest stigmatizing effect of labeling, with mostly null effects for the other mental illnesses. To provide a direct test of the effect of labeling for schizophrenia compared to the effect for other mental illnesses, we bootstrap the differences in effects across vignettes as described in the “Analytic Strategy” section. We find that the stigmatizing effect of labeling for schizophrenia is larger than it is for depression, alcohol addiction, and drug addiction, providing support for Hypothesis 4 (all differences p < .05).
Sensitivity Analyses
As discussed previously, there is no single causal inference method that is definitively seen as best. To examine the robustness of our findings, we estimated additional models using another common method: augmented inverse probability weighting (AIPW). Inverse probability weighting has been widely used for causal inference estimates in observational data; AIPW has the additional benefit of being a “doubly robust” method. Doubly robust estimators provide consistent parameter estimates when either the outcome model or the treatment model is correctly specified (Bai, Tsiatis, and O’Brien 2013; Bang and Robins 2005). We first examined covariate balance after weighting; the AIPW model does an excellent job balancing the covariates with no standardized differences larger than 4.5 percent after weighting (see Figure A3 in the Appendix in the supplemental material). 19
The results of the AIPW models provide further confidence in the findings presented in the bottom panel of Table 2 that exact match on contact (see top panel of Table A2 in the Appendix in the supplemental material). Specifically, all five of the effect sizes are similar in size, and the statistical significance levels are also very similar, with labeling only showing an effect for the pooled model, the daily troubles condition, and the schizophrenia vignette.
Different measures of contact
Our main analyses presented so far use the binary measure of contact. In sensitivity analyses, we use the measure that separates out contact with others versus contact with self and separately the measure that separates out contact by the valence of the contact. 20 First, we descriptively examine whether the effects of these additional contact measures differ in their effects on labeling or stigma; note that only the effects of contact on labeling are directly relevant to the matching analyses, but the relationship with stigma is of theoretical interest (Hypothesis 2).
We find that overall, contact increases the probability of labeling the vignette character (see Table 3), providing additional support for Hypothesis 1. The only exception was self-contact which had a small sample size and no effect on labeling. We also find that all types of contact reduce stigma (see Table 4), as Hypothesis 2 predicts. There are only minor differences in the effect sizes across the various types of contact for both sets of analyses. This suggests that given the current available measures, it is appropriate to pool all the different types of contact for our analysis with only possible loss of minor nuance.
Effects of Contact on Labeling, with Different Measures of Contact (N = 3,920).

Note. Average marginal effects from binary logit models are presented. Standard errors are in parentheses.
p < 0.05, **p < 0.01, ***p < 0.001.
Effects of contact on stigma, with different measures of contact (N = 3,920).
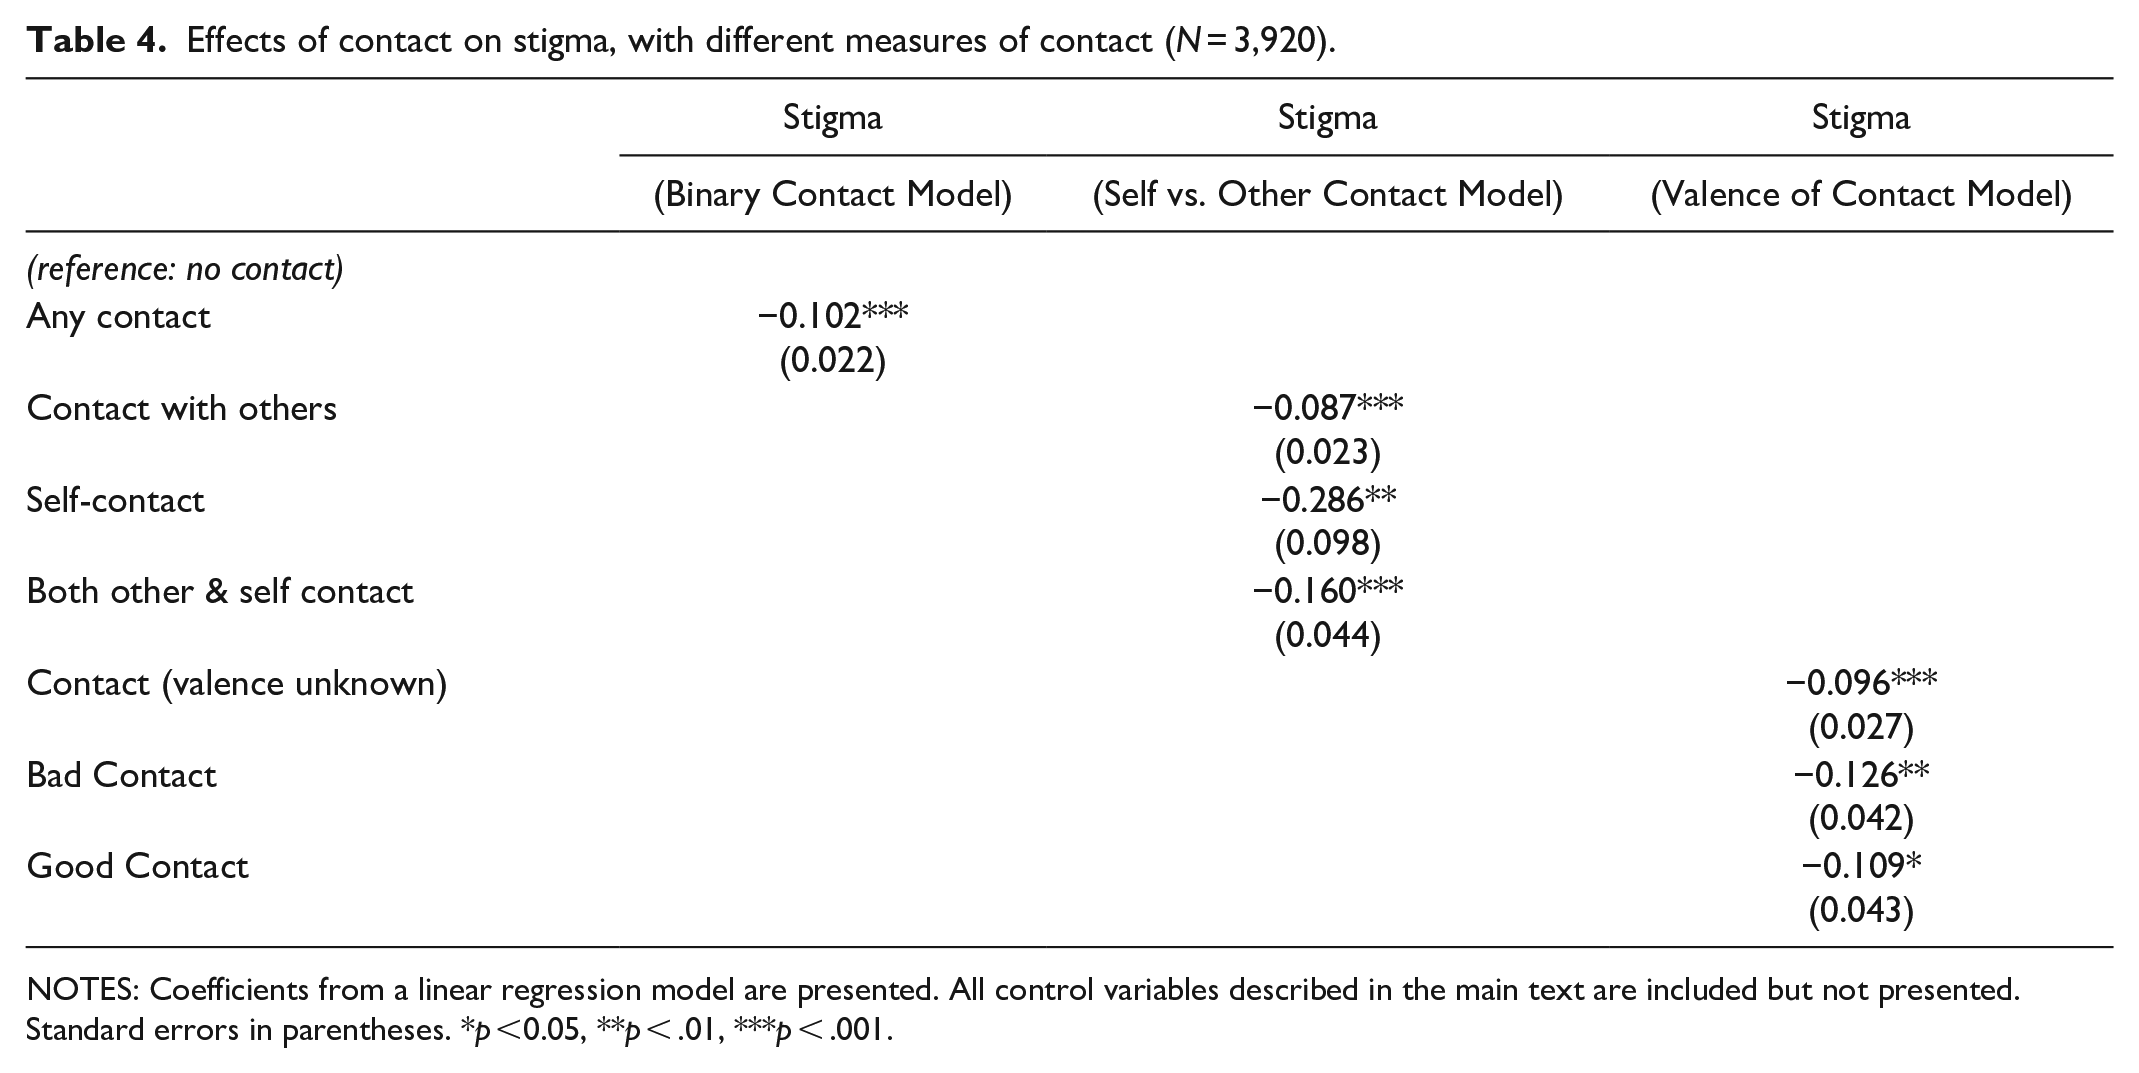
NOTES: Coefficients from a linear regression model are presented. All control variables described in the main text are included but not presented. Standard errors in parentheses. *p <0.05, **p < .01, ***p < .001.
To confirm the appropriateness of our binary measure of contact for our key analyses of the effect of labeling, we use these two additional measures in sensitivity analyses. 21 The bottom two panels of Table A2 (in the supplemental material) show the results with the two additional measures of contact. Results are all but identical to those with the binary contact measure, providing evidence that our binary contact measure satisfactorily accounts for the confounding effect of contact.
Discussion
Summary
In this article, we examine the effect of inferred mental illness labels on desired social distance above and beyond deviant behavior. We also suggest the best methods for estimating this effect. The process of inferring a mental illness label is intertwined with other factors that affect stigma (i.e., prior contact with mental illness, illness labels being inferred at different rates). Due to these confounding factors, to isolate the effect of a mental illness label, we use causal inference methods. In so doing, we join a call for researchers to carefully define the causal relationship of interest and use a model tailored for that relationship (Lundberg et al. 2021), especially as it pertains to mental illness labels (Thoits 2021).
Overall, we find support for our hypotheses. First, we find that compared to those who have not had contact with people with mental illness, individuals who have had contact with people with mental illness are more likely to label vignette characters as having a mental illness (i.e., they infer labels at a higher rate; Hypothesis 1). We also find that contact is associated with decreased stigma (in support of Hypothesis 2). Furthermore, we find that the likelihood of labeling of mental illness depends on the characteristics of the illness itself (Hypothesis 3). Specifically, schizophrenia was labeled as a mental illness by 91 percent of respondents, whereas the other conditions were less likely to be labeled as mental illness; 42 percent of respondents labeled drug addiction as mental illness, 56 percent of respondents labeled alcohol addiction as mental illness, and 73 percent of respondents labeled depression as mental illness. Finally, we find that different illnesses are stigmatized to different extents (Hypothesis 4).
Less research has examined how prior contact affects the relationship between inferred labels and social distance. Due to the potential confounding effect of contact and important differences by type of illness, we use causal inference techniques to estimate the effect of a mental illness label on stigma separately for each mental illness. We suggest that by strictly accounting for selection effects for applying a label (e.g., contact), as is possible with exact matching techniques, we are better able to estimate the effect of labeling on stigma. 22
For example, we find that for schizophrenia, the estimate of the effect of a mental illness label on the stigmatization of mental illness is much larger (.221 vs .143) when using causal inference methods that exact match on contact. This suggests that for symptoms of schizophrenia, some past research may have underestimated the effect of a mental illness label on stigma. This has important theoretical repercussions for considering how the type of mental illness label affects stigma.
Furthermore, in pursuit of simplicity, some influential past research has used pooled models that do not separate out different mental illnesses. Often, these studies will control for the type of mental illness but do not include an interaction term or estimate separate models for each mental illness and therefore do not allow for the effects of a label to vary based on the type of mental illness. Although efficient, these models mask the uneven effect of types of deviant behavior given that a mental illness label has effects on stigma for less than half of the illnesses included in the GSS vignettes. Therefore, while we strive to develop theories that span particulars, estimating empirical differences helps define theoretical scope more clearly.
Limitations and Future Directions
Although our findings have important implications for future research on contact, mental illness labeling, and stigma, there are always ways to increase the precision and theoretical robustness of findings. In the following, we discuss the existing limitations of available data and offer suggestions for future research looking to extend our work.
Labeling
Because there were so few individuals who did not label serious mental illnesses, such as schizophrenia, as a mental illness, the sample size for examining labeling process for serious mental illnesses was rather small. As a result, to have a large enough sample to confidently estimate our effect sizes, we had to pool samples across years. This was challenging because some measures, such as contact, had changed over time. In future iterations of this research, to ensure a large enough sample, we encourage researchers to collect larger sample sizes and/or illnesses that are less recognizable as such.
Contact
Our current measures of contact indicate that individuals with prior contact are more likely to label others with mental illness and desire less social distance from those experiencing mental illness symptoms. Importantly, a more detailed and consistent measure of contact would have facilitated our estimation. For example, knowing about an individual’s encounters with others with mental illness, their own experience with mental illness, the valance of that contact, and even the specific mental illnesses that individuals have encountered may have led to additional important insights. Indeed, our sensitivity analyses suggest some differences in effect sizes across these different types of contact, although we note the direction of the effect was always consistent.
With that said, we believe our contact measures, albeit coarse, were able to answer our questions. For example, in 2006, the GSS did not ask about individuals’ own experiences with mental illness. Importantly, however, most individuals who have experienced mental illness have also had contact with others with mental illness. Additionally, although the GSS did not explicitly ask about the valence of contact in all years (so we could not examine this effect across years), when it did ask, individuals overall reported relatively positive contact with people with mental illness (Perry et al. 2022; Pullen et al. 2022). The overall positive valance could be because most mental illnesses do not fall in the category of “serious mental illness” and therefore may cause less strain on a relationship than more serious mental illnesses (Perry 2011). Nonetheless, without knowing what illnesses individuals have encountered, it is difficult to know how/why the valance has been positive.
Finally, the variation in the contact measure across years created considerable issues for estimation. To measure change, the measure itself must remain consistent. Fortunately, for nearly every other measure associated with these vignettes, the researchers involved with the GSS National Stigma Studies have done an excellent job with being consistent. We encourage those involved in future iterations of the GSS National Stigma Studies to consider the changing measures of contact, perhaps using all the previous measures of contact in the next iteration for comparability and then moving forward with whichever is most robust while still financially feasible. Additionally, future GSS National Stigma Studies measures of contact with mental illness should include some questions about the nature of the relationship (e.g., amount, closeness, and valence of contact) and the illness (e.g., severity, symptoms) because these are important predictors of labeling and stigma (Felix and Lynn 2022; Perry et al. 2022; Pullen et al. 2022). In summary, future research might collect more robust and consistent measures of contact.
Types of labels
Depression and schizophrenia represent types of mental illness, one that is more fear-neutral and another that is fear-inducing. Because these illnesses are simply representations of important theoretical concepts, we recommend including a variety of illnesses that represent these broader “types”: regarding both fear and emotional excess. By including a variety of illness labels, researchers could be certain their theories generalize beyond depression and schizophrenia.
Relatedly, mental illnesses currently represent a concrete example of a stigmatized characteristic. We may be entering a point in time where some more common mental illnesses no longer fall under the umbrella of “stigmatized characteristic.” With the high rates of depression and anxiety in society, they are no longer as deviant or nonnormative and therefore may no longer be as stigmatizing. In contrast, rare mental illnesses characterized by fear and emotional excess (e.g., schizophrenia) are still quite deviant and nonnormative and therefore may still be highly stigmatized characteristics. Importantly, to determine what specific illnesses are “stigmatized,” the definition of a stigmatized characteristic must be made clear.
Additionally, we believe our theoretical framework can encompass not only a variety of types of illness but also perhaps characteristics that are not illnesses about which people might infer. For example, individuals may infer about others’ education-level, socioeconomic status, or sexual orientation. In general, we recommend that researchers consider the background of those who are inferring a label and how those individuals’ characteristics affect the likelihood of inference and resulting discrimination. Relatedly, with inferred labels, researchers should consider how the characteristics of the person being labeled may affect processes of labeling and discrimination.
Finally, although we are confident our models provide an accurate estimate of the effect of a label on stigma, they still do not explain why, in some circumstances, a mental illness label increases desired social distance. For a causal explanation of how/why a mental illness label affects desired social distance, researchers would need to explicitly design studies to test potential mechanisms. Some mechanisms have been proposed and preliminarily tested, for example, increased fear and unpredictability are thought to drive the relationship between mental illness labels and stigma (Huff et al. 2023; Manago and Mize 2022; Schnittker 2008). As more research comes to bear on this important relationship, we encourage researchers to update statistical models to appropriately estimate these relationships.
Conclusion
In conclusion, although the “gold standard” for estimating the causal effect of an applied label is random assignment in an experimental design, such random assignment is not possible for respondent-provided inferred mental illness labels. Nonetheless, inferred labels are practically and theoretically important to examine because they represent a common way in which people experience mental illness. However, inferred labels present both theoretical and empirical challenges that we outline in this article and offer one method for studying their effects. We recommend that researchers who use inferred or respondent-provided labels consider causal inference methods that can strictly account for potential confounds between labelers and nonlabelers. These methods allow us to uncover important insights about the causal impact of inferred labels on stigma that are difficult to otherwise examine.
Supplemental Material
sj-docx-1-srd-10.1177_23780231241274237 – Supplemental material for What Is the Effect of an Inferred Mental Illness Label on Stigma? Theoretical and Empirical Challenges
Supplemental material, sj-docx-1-srd-10.1177_23780231241274237 for What Is the Effect of an Inferred Mental Illness Label on Stigma? Theoretical and Empirical Challenges by Bianca Manago and Trenton D. Mize in Socius
Footnotes
Acknowledgements
Special thanks to Bernice Pescosolido, Alex Capshew, and Chanteria Milner.
Correction (December 2024):
This article has been updated since its original publication. Please see 10.1177/23780231241294066 for more information.
Notes
Author Biographies
![]() .
.
![]() .
.
References
Supplementary Material
Please find the following supplemental material available below.
For Open Access articles published under a Creative Commons License, all supplemental material carries the same license as the article it is associated with.
For non-Open Access articles published, all supplemental material carries a non-exclusive license, and permission requests for re-use of supplemental material or any part of supplemental material shall be sent directly to the copyright owner as specified in the copyright notice associated with the article.