
Abstract
Despite the popularity of generational labels like Boomers, Gen X, Millennials, and Gen Z in mass media, social scientists have debated their usefulness and accuracy in research. Consequently, little is known about the actual rate of self-identification with these generational labels in the U.S. population. This study investigated these labels as social identities and examined the extent of intragenerational variation in identification rates by birth year. Additionally, we explored the associations among political partisanship, demographic factors, and generational self-identification. Using logistic regression analyses of data from a nationally representative survey of 1,478 Americans, we find that a majority of respondents self-identify with a generational label, but individuals with birth years in the middle of the generational range exhibit much higher rates of self-identification. However, our analysis reveals little evidence for variation in generational self-identification based on party, race, or other demographic characteristics.
In 2021, Vice journalist Bethan Kapur reported on a phenomenon of “Millennials Who Wish They Were Gen Z” (Kapur 2021). Citing the stigma associated with Millennials (described in the article as “self-obsessed, extremely materialistic avocado-eaters”), the interviewees expressed a preference for identifying as “Gen Z.” At first glance, this appears somewhat peculiar. Over the past few decades, as the American public has been introduced to subsequent new generational labels, we have been instructed that these labels are attached to fixed birth year ranges. The Millennial generation, for example, includes those born from 1981 to 1996. One cannot change their birth year any more than they can change their place of birth. However, Kapur’s interviewees seemed to consider “Millennial” and “Gen Z” as social identities that could be chosen or rejected, raising questions about the extent to which the American public identifies with these socially constructed generational labels.
As generational labels become increasingly prevalent, certain social scientists have argued for their discontinuation, asserting that they are an inadequate form of cohort measurement and often perpetuate stereotypes (Cohen 2021). Other researchers have pointed out the divisive nature of generational discourse (Bristow 2016a; Duffy 2021; Elliott 2021). Despite the popularity of such rhetoric, we still know very little about these generational labels as social identities. This study fills this gap by addressing the following question: To what extent do Americans identify with the generational labels of Baby Boomer, Generation X, Millennial, and Generation Z? Building on the foundation of social identity theory (Brewer 2001; Roccas and Brewer 2002; Scheepers and Ellemers 2019), which holds that those who are more “central” to a social group are more likely to adopt a group identity, we also consider whether individuals born in the center of each generation’s birth range are more likely to identify with the label than those born on the cusps.
The proliferation of generational labels has coincided with the rise in partisan polarization, and much of the discourse surrounding generations has notably political dimensions. For instance, the widespread “OK Boomer” discourse often involves critiques of how Boomers allegedly “wrecked the environment” and “collapsed the economy” (Bristow 2016a; Elliott 2021). It is plausible that political partisanship may increase the probability that a person identifies with their appropriate generational label.
Despite the attention generational labels have received, social scientists have yet to rigorously examine them as social identity categories. In the present study, we investigated patterns of identification with popular generational labels (Boomer, Gen X, Millennial, and Gen Z) and explored their potential links to birth year and partisanship. We begin by reviewing relevant literature on generations, social identity theory, and partisan polarization. Next, employing a nationally representative sample of Americans (N = 1,478), we present a series of logistic regression analyses predicting the odds of identifying with each of the four generational labels. Our findings reveal that although a considerable proportion of Americans identify with one of the four labels, there is substantial intragenerational variation in identification rates. Although distinct differences exist in the partisan composition of the generational groups, our results indicate no significant pattern of partisans adopting a particular generational identity at a markedly higher rate after accounting for other characteristics. The findings of this study underscore the complexity of generational identification and highlight the need for further research to better understand the role generational labels play in culture.
Background
Generational Labels
Since the late 1990s, a new lingo of generations has emerged in popular culture (Bristow 2016b; Duffy 2021; White 2013). Although the term “Baby Boomers” had been used since the 1960s, drawing on a long lineage of quasi-scientific romantic historical generational thinking, Strauss and Howe (1992) helped popularize the current generational terminology by coining “Millennial” and promoting a cyclical theory of generational personas. In the decades since the release of Strauss and Howe’s influential book, the generational labels of “Baby Boomer,” “Gen X,” “Millennials,” and “Gen Z” have appeared in dozens of trade paperbacks, thousands of newspaper headlines, and all over social media. Each of these labels is associated with a package of supposed psychological traits, behavioral patterns, and political commitments typical of each respective generation (e.g., being narcissistic, parting one’s hair in the middle, destroying the global economy) (Agati 2012; Bristow 2016b; White 2013). Prior studies show that these labels are often used to voice “generational grievance” (Bristow 2021; Elliott 2021) and to narrate various sociopolitical conflicts (White 2013; Zeng and Abidin 2021). Researchers have documented the use of these generational labels in both the United States and United Kingdom with many of the same accusations and stereotypes. The easy movement of the labels between these very different demographic, social, and political contexts speaks to their potency as a rhetorical tool. They are also ruthlessly exploited by marketers to sell a wide range of goods and services tailored to age group (Duffy 2021; Menand 2021; White 2013).
Even as these generational labels have become far more common in popular discourse, there is significant debate about whether we should even be using them. In 2019, Pew Research Center, which regularly uses the terms “Boomers,” “Gen X,” “Millennials,” and “Gen Z” in their reports, altered the conventional starting and end points of these cohorts to standardize them (Dimock 2019). At least some social scientists defend the use of these labels, arguing that plenty of other socially constructed categories (e.g., racial and gender categories) are regularly used in research precisely because the public’s belief in them makes them consequential (Campbell et al. 2015). Others argue that these generational labels lack validity because they lump far too many birth cohorts (i.e., 16–19 years of birth cohorts) together to be a useful form of measurement (Agati 2012; Cohen 2021; Duffy 2021). This rift took an unexpectedly public turn when Cohen (2021) and more than 200 social scientists signed an open letter to Pew asking them not to use these labels. The Atlantic and The New Yorker chimed in with articles calling on journalists, scientists, and members of the public alike to quit using these generational labels (Menand 2021; Pinsker 2021). Much to their credit, Pew has since responded to criticism from researchers, saying they will generally refrain from the “use [of] the standard generational labels when they’re not appropriate . . . [to] . . . avoid reinforcing harmful stereotypes or oversimplifying people’s complex lived experiences” (Parker 2023).
Generations and Social Identities
All of this controversy raises an obvious question: Do members of the public actually identify with these generational labels? Or more generally, do they even know the “correct” generational label for their birth year? Although the field of generational research does exist, the evidence currently available to answer these specific questions is limited. In 2015, Pew found that 79 percent of people in the corresponding birth cohorts considered themselves “Boomers” (born 1946–1964) compared to 58 percent of “Gen Xers” (1965–1980) and only 40 percent of “Millennials” (1981–1996; Pew Research Center 2015). A 2021 YouGov poll commissioned by The Atlantic similarly examined the proportion of U.S. adults in each generation who “associate themselves with the label that’s applied to them” (Pinsker 2021). They found that 74 percent of Baby Boomers identify with the label compared with 53 percent among Gen X, 45 percent among Millennials, and 39 percent among Gen Z (born 1996 or after). These findings point to unevenness among birth cohorts in identifying with their assigned generational label. However, to the best of our knowledge, there have been no studies to date that examine intragenerational variation in identifying with their assigned label. For example, are people born in 1982 and people born in 1992 equally likely to identify as Millennials?
If generational labels have indeed crystallized into generational identities, they would become part of a larger set of social identities that people assume. Social identities consist of both ascribed statuses, such as race, gender, and place of birth, and achieved statuses, such as occupational attainment, and a wide range of group memberships, such as organizational affiliations (Brewer 2001; Gaertner et al. 1993; Hogg and Reid 2006; Scheepers and Ellemers 2019). As previously noted, birth year is a commonly used metric for determining one’s generational identity (Pew Research Center 2015). Birth year is an ascribed status, and because it is not a matter of choice, generational cohorts should be automatically assigned based on one’s birth year. Nevertheless, individuals’ generational self-identification is not always consistent with their birth year.
Studies suggest that among individuals who are members of multiple groups, certain group memberships and identities may be more significant than others (Champniss, Wilson, and Macdonald 2015; Garza and Herringer 1987; Hogg and Reid 2006). For instance, individuals may identify more strongly with their identity as Black rather than as a Gen Xer if their race has had a more noticeable impact on their life than their generational identity (Brook, Garcia, and Fleming 2008; Jones and McEwen 2000) even though both are ascribed statuses. This may occur because in comparison to their other identities, their generational cohort may feel less important, and people may not have acquired enough knowledge about their generation to accurately identify with it (Lyons and Schweitzer 2017; Markert 2004). Stryker and Serpe (1994) found that it is not the mere presence of an identity but the salience of particular identities that influences people’s decision-making and behaviors. Individuals tend to navigate situations by relying on the social roles and behaviors associated with their most important identities and those that are most relevant to the given context (Ellemers, Spears, and Doosje 2002; Stryker and Serpe 1994). If someone’s generational identity is not salient or is unknown to them, it will likely have minimal impact on their behavior and decision-making.
In addition, the way that mass media often represent particular generations is both stereotypical and strikingly exclusive. People may not identify with their assigned generational label because they do not “match” with some of the other identities that stereotypically overlap with the generations. For example, Boomers are often represented as White, and Millennials are typically depicted as college-educated and urban. For the non-White Boomer or the non-college-educated, rural Millennial, the generational label might not seem like a welcome identity to adopt. Similarly, people may dislike the stereotypical connotations associated with their assigned label. For example, someone who is aware of Millennials’ supposedly “cringeworthy” sense of humor (Jennings 2022) may be more inclined to identify as Gen Z despite their birth year being in Pew’s prescribed Millennial range (Dimock 2019). Likewise, someone who is technically a part of Gen X but has conservative politics may gravitate toward Boomers, despite their birth year, to be in a group of more politically like-minded people (Maniam and Smith 2017). These kinds of tensions are typical of a wide range of social identities, which Howarth (2002) observes, are bound to intersect with, compete with, and/or complement one another. Because generational identities seemingly walk the line between an ascribed status and an achieved status, people are capable of changing or being flexible with their identification depending on what is the most personally appealing.
Like any other social identity, generational identities may reinforce positive feelings about the group, resulting in a strong sense of allegiance toward one’s generational cohort. These identities may create opportunities to connect with others who share formative cultural and historical experiences. For instance, individuals who identify with the “Baby Boomer” generation may have a shared sense of historical events, such as the Vietnam War, civil rights movements, and iconic rock and roll music, which can foster a sense of community and belonging. Similarly, individuals who identify with the “Millennial” generation may have shared experiences, such as growing up with the internet and social media, that shape their worldview and identity. By identifying with a particular generational cohort, individuals may find opportunities to connect with others, share their perspectives, and gain a sense of belonging.
Social identities can also have downsides and are consequential for how people perceive out-group members. A substantial body of research suggests that group membership can impact the way people feel about those belonging to other groups, often in a negative way (Brewer 2001; Leidner et al. 2010; Mackie, Devos, and Smith 2000). Negative feelings toward the out-group are not necessarily fueled by blatant hate of others but, rather, a product of the strong attachments and allegiances within the in-group (Brewer, 1979, 2001; Halevy et al., 2012). For instance, members of different generations may mock one another on social media, feeling that their generation’s own way of doing things is superior to others’ (Elliott 2021; Lorenz 2019; Moore 2019; Zeng and Abidin 2021). But negative attitudes toward out-groups can also be much more consequential and may manifest into more tangible prejudice (Brewer 1999; Pedersen, Griffiths, and Watt 2008). In terms of generational identity, past research has demonstrated the prevalence of generational grievance, which are entirely consistent with out-group vilification (Bristow 2021; Elliott 2021; White 2013). It is quite possible that the entrenchment of negative rhetoric about generational out-groups may contribute to making generational identities more salient for many people.
With regular reinforcement of generational identities in various forms of media, it seems plausible that at least some portion of the U.S. public have adopted generational identities or, at the very least, hold some notions about different generational groups. Although this can take the form of “positive generationalism” toward their own in-group or “negative generationalism” about out-groups, past research tends to imply that at least some people now identify with or have some knowledge about these generational identities. As such, we hypothesize the following:
Hypothesis 1a: People born in the year range of each generational cohort (according to Pew Research’s definitions; Dimock 2019) will be more likely to identify with their “correct” generational label than people born in any other set of years.
For example, people born between 1946 and 1964 will be more likely to identify as Boomers than people born in any other set of years. Likewise, people born between 1965 and 1980 will be more likely to identify as Gen X than people born in any other set of years, and so on.
At the same time, as we have previously noted, there is clearly some ambiguity about generational labels. Some generational labels, like “Baby Boomer,” have been in use for nearly 60 years, whereas others, like “Gen Z,” are more recent, meaning that familiarity with the meanings associated with a generational term may vary among different groups and individuals within each generation. Strauss and Howe (1992) proposed one set of dates for the current generational groupings, which Pew Research later revised (Dimock 2019). This may have led to confusion about which generation people belong to, especially for those on the cusp of a new generation (referred to hereafter as “cuspers”) or those who were reclassified in Pew’s adjustment. Further muddying the waters have been attempts to popularize micro-generational labels, such as “Xennials,” “Geriatric Millennials,” and “Generation Jones,” which describe differences between people within just a few years (Hoffower 2021; Miller 2018; Werde 2023). The fact that these micro-generations exist implies that people on the cusp may have competing ideas about their correct generation and the traits that distinguish them from one generation or another.
Even holding aside Pew’s reclassification (Dimock 2019) and the newness of some labels, cuspers may generally feel less connected to one generational label than people born toward the center of the year range. Those born in the middle of a generation’s time range are likely to have less confusion and greater confidence about where they belong in their generation. Centrality is often important to a wide range of different social identities, including racial, gender, sexual, and intersectional identities (Brown 1990; Dworkin 2002; Gibbs 1987; Stroink and Lalonde 2009; Totelecan and Mann 2012). The person who was 5 years old when Woodstock took place may identify much less closely with the label of Baby Boomer than someone who was 20 years old. Accordingly, we also hypothesize the following:
Hypothesis 1b: People who are born in the middle five years of each generational grouping will be more likely to self-identify with that generation than people born either on the cusp of a generation (either five years before or after the indicated year range of a generation) or outside of the designated period.
For example, since the so-called Millennial generation extends from 1981 to 1996, people born between 1986 and 1990 will be more likely to identify as Millennials than either cuspers (people born 1981–1985 and those born 1991—1996) or those born before outside the Millennial time frame.
Generationalism and Partisan Polarization
A wide range of surveys reveals that the various age cohorts differ substantially both in terms of their partisan affiliation and political ideology. Older Americans (which surveyors often label as “Boomers” and “Gen X”) are far more likely to affiliate with the Republican party and place themselves ideologically as “conservative,” and younger cohorts are more likely to identify as Democrats and ideological “liberals” (Gonyea and Hudson 2020; Gramlich 2020; Maniam and Smith 2017; Mitchell 2020; Stoker 2020). According to Pew Research, Boomers and Gen X are split relatively evenly between the two major political parties, whereas approximately 60 percent of both Millennials and Gen Z lean toward or identify as Democrats (Gramlich 2020; Mitchell 2020). Even more notable are the ideological splits. Among so-called Boomers, 31 percent identify as “conservative Republicans,” and 17 percent identify as “liberal Democrats.” Among Millennials, these numbers are nearly reversed, with 27 percent describing themselves as “liberal Democrats” and only 17 percent saying they are “conservative Republicans” (Gramlich 2020; Maniam and Smith 2017). Because most members of Gen Z have been younger than voting age until recently, there are fewer attitudinal polls of that cohort. However, according to one poll of registered voters of the Gen Z age cohort, 38 percent identified as liberal, which was twice the amount of those who identified as conservative (Dugyala and Rahman 2020).
But a narrow focus on partisanship and ideology measures belies a wider divergence among cohorts in their cultural politics and issue stances. In terms of their views on race, gender norms, and sexual identity, younger generations tend to have more progressive views than their older counterparts (Katz et al. 2021; Mitchell 2020; Parker, Graf, and Igielnik 2019). For example, 35 percent of Gen Z and 25 percent of Millennials are familiar and comfortable with gender-neutral pronouns compared to only 12 percent of Boomers (Parker et al. 2019). Members of both Gen Z and Millennials (meaning adults under 40 in 2020) are often far more critical of the U.S. government and its handling of key political issues, such as racial inequality and climate change, and on the whole disapprove of the Trump administration at much higher rates than their older counterparts (Parker et al. 2019).
These differences in political attitudes across cohorts can be partly attributed to demographic differences in the composition of each generational grouping. Millennials and Gen Z are the most diverse generations to date (Katz et al., 2021; Stoker, 2020), with only 52 percent of Gen Z and 61 percent of Millennials being non-Hispanic White compared to 82 percent of Boomers 1 (Parker et al. 2019). A partial explanation for the difference in diversity among generational groupings is that more than 20 percent of Baby Boomers have already died and due to racial inequalities in morbidity and mortality, a disproportionate share of those still living are White (Fry 2020). The increased diversity in younger generations has heightened the salience of issues of racial justice among younger voters. Similarly, each generation has higher levels of education attainment than each previous cohort, with Gen Z expected to have the highest rate of college degree holders of any generation (Mitchell 2020). The diversity and education among younger people have contributed to the formation of more liberal social stances, including greater support for diversity and inclusion initiatives (Katz et al. 2021; Parker et al. 2019).
Both the notable age group cleavages in political attitudes and the heightened rhetoric of political “generational grievance” (Bristow 2021) have co-occurred with a rising tide of partisan polarization (Iyengar et al. 2019; Klar, Krupnikov, and Ryan 2018; Mason 2018). In terms of the U.S. public, this polarization has taken the form of more tidy issue-sorting among partisans so that Democrats and Republicans each tend to hold a more homogeneous set of policy stances (Mason 2015, 2016). At the same time, there has been substantial growth in “affective polarization,” or the pattern of people exhibiting positive feelings toward members of the same party and negative feelings toward members of the opposition party (Iyengar et al. 2019; Klar et al. 2018; Mason 2016; Törnberg et al. 2021).
As partisan identities have taken on new significance, religious, racial, and regional identities have all come to have strong political connotations. So, too, have generational identities. In recent years, Democrats have attracted younger, secular, coastal, more racially diverse, and more highly educated voters who hold progressive stances on social and cultural issues. On the other hand, the Republican Party is identified with a more homogeneous group of older, White, evangelical, non-college-educated voters who hold socially conservative stances (Gonyea and Hudson 2020; Mason 2018; Mason and Wronski 2018; Sides, Tesler, and Vavreck 2017). Millennials and Gen Z are closely associated with progressive political stances and the Democratic Party, and the Boomers are linked with the decline of the welfare state and other core issues of the Republican Party (Bristow 2021; Duffy 2021; Katz et al. 2021; Lorenz 2019). It is worth noting that in these politically tinged generational debates, Gen X is often left out. In most generational rhetoric, Gen X is not consistently associated with either the Democratic or Republican parties (Jones 2022).
Partisanship has become such a highly salient identity that these political connotations of generational labels may affect generational self-identification. If Democrats born between 1946 and 1964 understand “Boomer” as having conservative political connotations, they may be somewhat less inclined to self-identify with that generational label. Although one’s political party of choice clearly cannot affect one’s birth year, partisan leanings can shape whether people choose to identify with a generational label. As such, we theorize that generational identities have become politicized and, therefore, we hypothesize the following:
Hypothesis 2: Accounting for age, Democrats are more likely to identify as members of Generation Z or Millennials, and Republicans are more likely to identify as Boomers. Accounting for age, there will be no significant association between partisan identity and identifying as a member of Gen X.
The Current Study
Despite the popularity of generational labels on social media and in the news, to date, very little is known about the extent to which people identify as Boomers, Gen X, Millennials, or Gen Z. In this study, we used data collected from a nationally representative survey (N = 1,478) to analyze patterns of generational self-identification. In particular, we examine how birth year, partisan affiliation, and demographic controls may be associated with generational identification. The results help establish the extent to which generational labels have entered the general consciousness of the American public, 2 potentially shaping people’s self-conception and contributing to divisions in public discourse. The findings of the study also document the extent of intrageneration variation in self-identification, contributing to a larger area of study currently questioning the value of generational labels. We begin by describing the survey data and methods used to test our hypotheses. Then, we describe the survey results before offering a broader discussion of what the findings mean for generationalism in public life.
Methods
Data
Data collection was conducted via SurveyMonkey Audience, a widely recognized online polling platform utilized by news outlets, businesses, and academia, employing a nationally representative sampling frame. The authors developed original survey questions, which were administered between March 17 and August 3, 2022. SurveyMonkey Audience maintains an online panel consisting of 175 million individuals across over 100 countries who have provided basic demographic information (e.g., gender, age, race, income, geographic location). Panelists require internet access and may complete surveys using smartphones, tablets, or computers. Because the research question specifically targets self-identified Baby Boomers and subsequent generations, the sample was restricted to individuals born in 1940 or later. The survey was administered to noninstitutionalized U.S. residents ages 18 to 82, with demographic representation aligned with U.S. Census proportions. Upon completion of the survey, respondents earn credits exchangeable for contributions to various charitable organizations.
Out of the 2,002 respondents contacted and who agreed to participate, 1,941 (97 percent) successfully completed the survey, with a median completion time of 6 minutes. An attention check question was included three-quarters of the way through the survey (“Click #5 ‘Strongly Disagree’ for this question. This is an attention check”), which 387 respondents (20 percent) failed. Missing data on the dependent and independent variables were minimal (<4 percent) with the exception of income (8 percent). The final analytic sample was limited to those who passed the attention check and provided valid responses for all dependent variables (all missing cases were removed using listwise deletion), yielding a sample size of 1,478.
Relative to U.S. Census demographics, the sample exhibited overrepresentation of non-Hispanic White, female, and college-educated respondents. To address this, sample weights were generated by calculating representation ratios based on race, gender, and bachelor’s degree attainment, comparing U.S. Census data to the sample. These weights were then assigned to each respondent.
Measures
Dependent variable
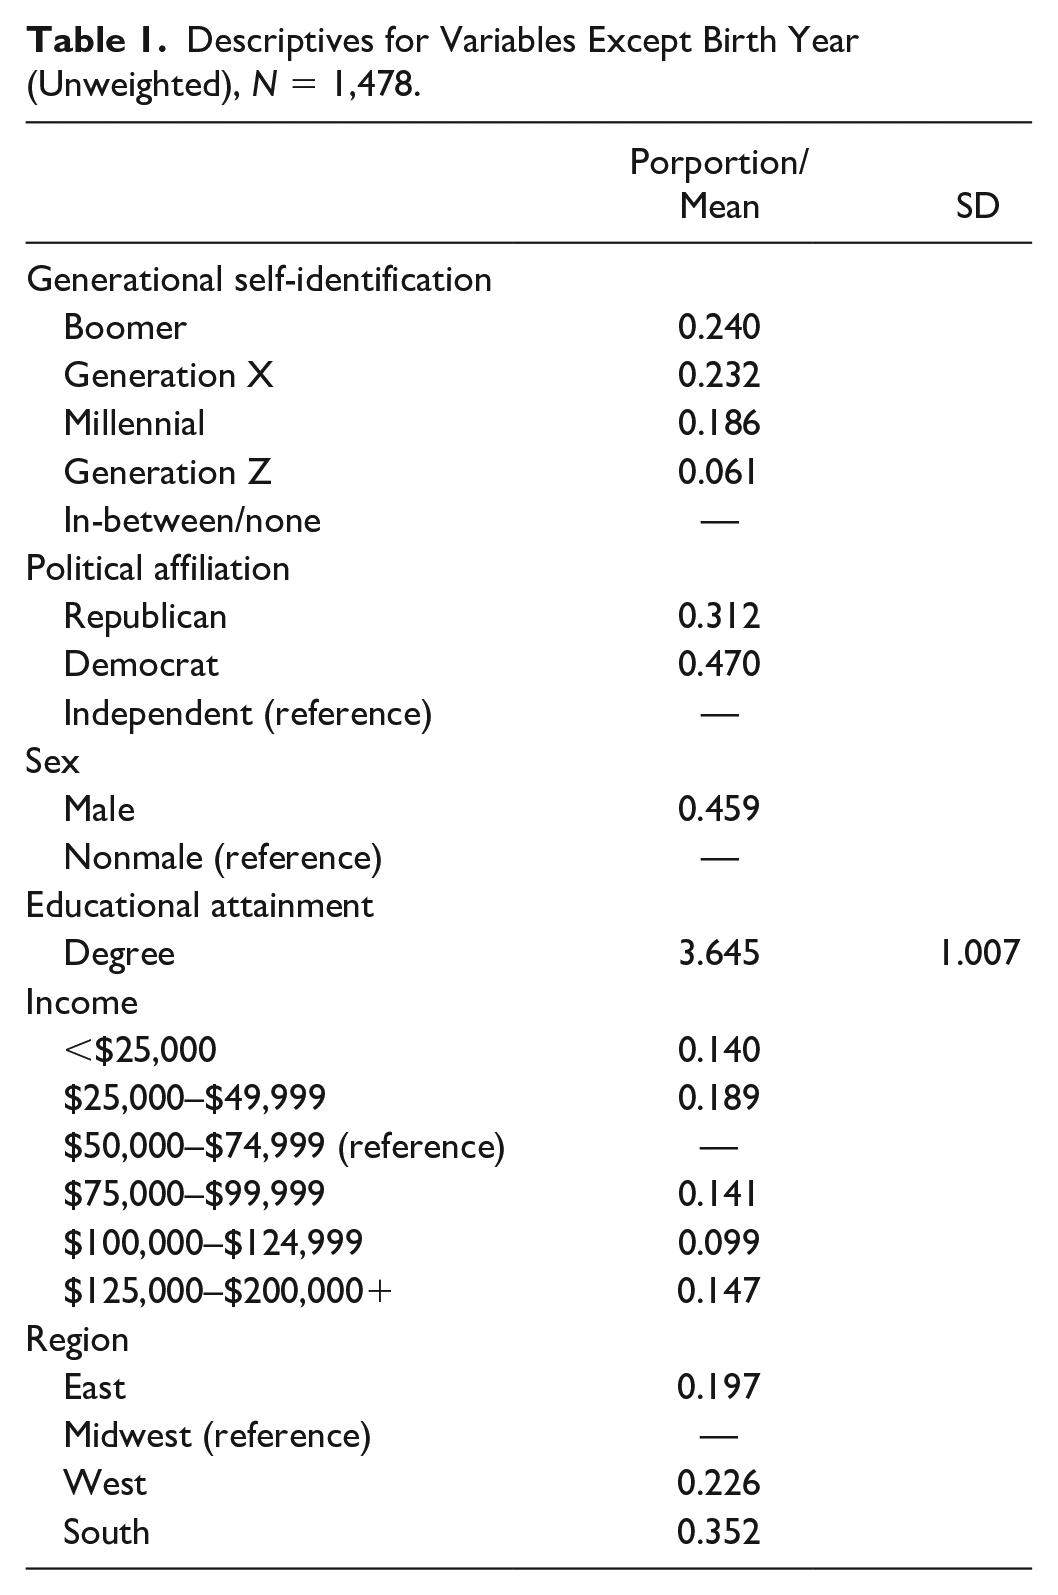
The dependent variable is generational self-identification. Respondents were asked, “Generally speaking, do you think of yourself as . . . ?” The response categories were Baby Boomer, in between Baby Boomer and Generation X, Generation X, in between Gen X and Millennial, Millennial, in between Millennial and Gen Z, Gen Z, and none of the above. The responses Baby Boomer, Generation X, Millennial, and Gen Z were each recoded as dummy variables (0, 1). Descriptive statistics for all measures other than birth cohorts can be found in Table 1.
Descriptives for Variables Except Birth Year (Unweighted), N = 1,478.
Independent variables
Dummy variables for birth year were created to represent five-year birth cohorts within each generational label’s year range. These year ranges are based on Pew Research Center’s definitions: Boomers (1946–1964), Gen X (1965–1980), Millennials (1981–1996), and Gen Z (1997–2012; Dimock 2019). Due to the uneven lengths of generational groupings, some cohorts span three, four, or six years. Two dummy variables were constructed for the early and late cuspers, representing the five-year cohort preceding and succeeding each generation (e.g., 1960–1964 and 1981–1985, respectively, for Gen X). Because Gen Z is ongoing at the time of data collection, it only has an early cusper dummy. The reference categories are as follows: Boomers, post-1969 births; Gen X, pre-1960 or post-1985 births; Millennials, pre-1976 or post-2001 births; Gen Z, pre-1992 births. Descriptive statistics for all birth year dummy variables can be found in Table 2.
Proportions for Birth Year Dummy Variables (Unweighted), N = 1,478.

Political party identification (partisanship) was measured with the survey question, “Generally speaking, do you usually think of yourself as a Republican, Democrat, Independent, or what?” The response categories ranged on a 7-point scale from “strong Democrat” to “strong Republican” with an “other party” category. These responses were recoded into a set of three dummy variables coded as Republican, Democrat, and Independent (reference group). Self-identified partisans and independents leaning toward a party were coded as the respective partisan groups. Additionally, no-lean independents and “other party” were coded as Independent.
Controls included the following. Gender was coded as 1 = male, 0 = female. Race was coded as 1 = White and 0 = non-White. The respondent’s educational attainment is an ordinal variable measured on a 5-point scale (1 = less than high school, 2 = high school, 3 = some college or junior college degree, 4 = bachelor’s degree, 5 = graduate degree). Income was coded into five different income ranges as dummy variables (0, 1). These ranges included respondents who reported income of $0 to $24,999, $25,000 to $49,999, $75,000 to $99,999, $100,000 to $124,999, and $125,000 to $200,000+. Income range between $50,000 and $74,999 was the reference category. Region was coded according to four main census regions and divisions. The regions were recoded into East, West, and South as dummy variables (0, 1). Respondents in the Midwest were the reference value.
Analytical Strategy
We first calculated and graphed the proportion of respondents in each birth cohort identifying as a member of the respective generation. We then estimated four separate progressions of logistic regression models for each of the generational groups. In each progression, the first model included only the birth year measurements. Next, in the second model, we included only the party identification variables to assess the direct effect of partisanship on generational identification. In the third model, we included both the birth year variables and the partisanship measure to assess potential spuriousness of any partisan effects. The fourth and final model added all control variables to account for any potential compositional effects.
Results
In our sample, approximately 70 percent of respondents identified as one of the four main generational labels, another 25 percent placed themselves “between” two generations, and about 5 percent chose none of the above. Figure 1 depicts the proportion of respondents identifying as each of the four generations in two ways. In Figure 1a, we treated birth year as a continuous variable, plotting the estimated proportion of respondents identifying with generations for each birth year from 1940 to 2004. In Figure 1b, we used the approximately five-year birth cohorts employed in our logistic regression models. Across both versions, one clear pattern is that the peak rate of identifying with the generational label is lower for each subsequent generation. In excess of 90 percent of those born in the peak years (1946–1955) of the Baby Boomer cohort identify as Boomers. For Gen X, the peak of identification is around 80 percent for those born between 1970 and 1974. Among Millennials and Gen Z, the peaks are only 66 percent and 73 percent, respectively.
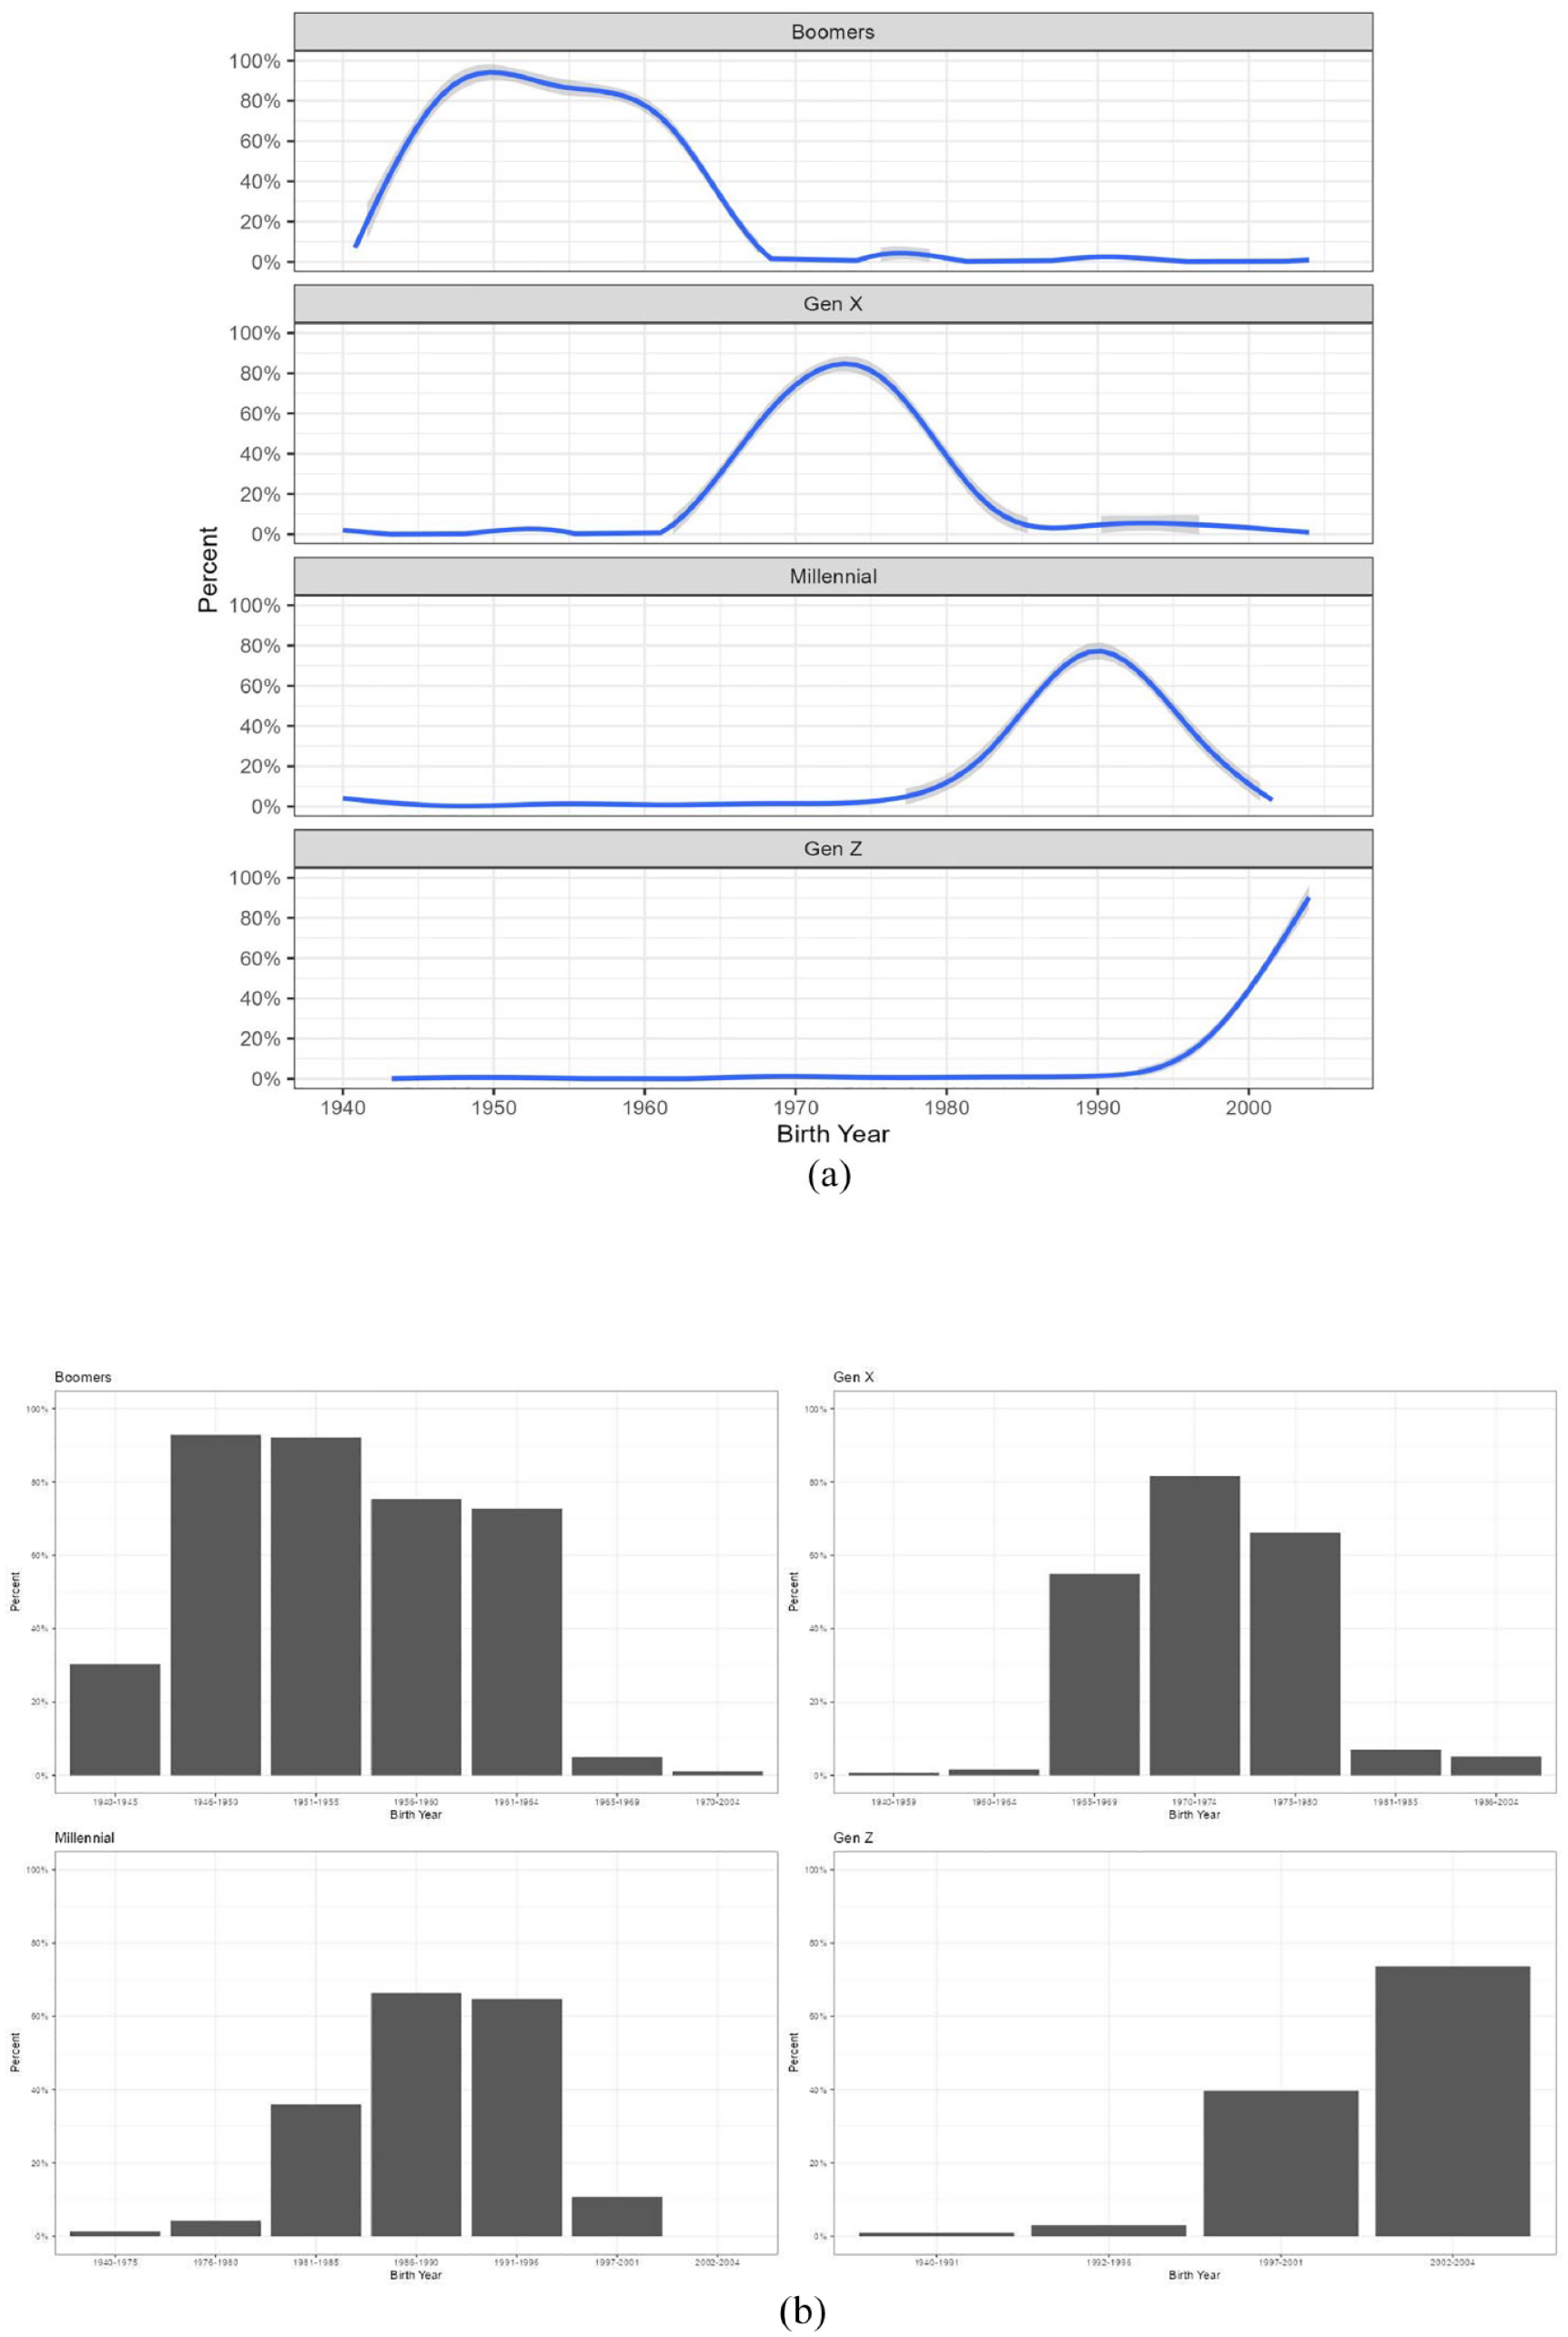
Proportion identifying as generations by birth year (unweighted): (a) using a continuous measure of birth year and (b) using five-year birth cohorts.
Straightforwardly, our first two hypotheses held that people born in the year range of each generational cohort will be more likely to identify with their “correct” generational label than people born in any other set of years (Hypothesis 1a) and that people born in the middle of each generational grouping will self-identify with that generation to a greater extent than people born on the cusp (Hypothesis 1b). The bell curve shape in each facet of Figure 1 offers strong support for both parts of this hypothesis at the bivariate level. For each generational group, very few people born outside of the grouping identify with that label. In the five years immediately preceding the Pew-defined (Dimock 2019) “start” of each generation, no more than 30 percent of respondents identify with the label. As the generation’s time period begins, the proportion identifying rises to a majority of all respondents in that birth cohort. With the exception of Gen Z (who are not all adults yet), that proportion identifying with the generation begins to decline after reaching the middle of the period.
In models with controls for the demographic composition of these cohorts, we still find strong support for both parts of Hypothesis 1. For example, in the full model of Table 3 (Model 3), holding all else constant, people born the period immediately prior to the start of the Baby Boomer generation (1940–1945) have 44.5 times the odds of identifying as a Boomer compared to people born after 1970 (p < .001). People born in the first five years of the Boomer cohort (1946–1950) have 2,041 times the odds of identifying as a Boomer as compared to the reference group (p < .001). The odds decline somewhat in the later part of the 1950s and further still for those born in the 1960s. For those born between 1965 and 1970—not Boomers according to Pew (Dimock 2019)—they still have about 10 times the odds of identifying as a Boomer compared to those born after 1970 (p < .001).
Logistic Regression for Self-Identifying as a Boomer (Weighted).

Note. N = 1,478. Odds ratios are shown with t statistics in parentheses.
p < .05. **p < .01. ***p < .001.
For the Gen X generation, the boundary is clearer. The cuspers (1960–1964 and 1981–1985) are not significantly different from the reference group (p > .05). Figure 1a displays an inverted U-Shape trend, where the odds keep increasing from the early cusp years toward the middle of 1970s and then decrease from the mid-1970s to the later cusp years. For those born in the peak years of 1970 to 1974, respondents had 84 times the odds of identifying as Gen X compared to the reference group (p < .001). Similarly, for Millennials, the early cusp (1976–1980) is not significantly different from the reference group (p > .05). During the peak birth years (1986–1990), respondents had 110 times the odds of identifying as Millennials compared to those born before 1976 or after 2001 (p < .001). For those born after 1996, the proportion identifying as Millennials decreases gradually. The early cusp period of Gen Z is also almost the same for the reference group. Those born from 1997 to 2001 have 62 times the odds and those born from 2002 to 2004 have 260 times the odds of identifying as Gen Z compared to those born before 1992 (p < .001 for both).
Turning to Hypothesis 2, we hypothesized that accounting for age, Democrats would be more likely to identify as members of Generation Z or Millennials and that Republicans would be more likely to identify as Boomers. However, we expected no significant association between partisan identity and identifying as a member of Gen X. Model 2 in Table 3 (for identifying as a Boomer) reveals that being a Republican gives respondents 2.5 times the odds of identifying as Boomers compared to Independents (p < .001). Compared to Independents, Democrats also have 1.5 times the odds of identifying as a Boomer (p < .05). However, in the full model (Table 3, Model 3), when accounting for birth year and demographic characteristics, there was no significant association between political party and generational self-identification (p > .05).
The models for Gen X were in line with our expectation of nonsignificance in Hypothesis 2. Model 2 in Table 4 shows no significant association with being a Democrat or Republican and identifying as Gen X compared to the reference group (p > .05). These results remain consistent with the addition of demographic controls and birth year variables. But contrary to our hypothesis, the nonsignificance of partisan affiliation extended to the Gen X and Boomer models. For Millennials, Model 2 in Table 5 shows that both Democrats and Republicans have similar odds (around 1) of identifying as Millennials compared to the reference category (p > .05). Additionally, these results are consistent even when accounting for birth year and adding demographic controls (Model 3). We find similar results for Gen Z as well. Model 2 of Table 6 shows no significant change in odds of identifying as Gen Z for either Democrats or Republicans compared to Independents (p > .05), and this remains consistent in the full model (Model 3). In terms of magnitude, the odds of a Democrat identifying as Gen Z is twice as high than the reference group compared to half those odds for Republicans identifying as Gen Z compared to the reference group. Although nonsignificant, these findings are directionally in keeping with our hypothesis in the sense that they show higher likelihood of Gen Z identification for Democrats.
Logistic Regression for Self-Identifying as Gen X (Weighted).

Note. N = 1,478. Odds ratios are shown with t statistics in parentheses.
p < .001.
Logistic Regression for Self-Identifying as a Millennial (Weighted).
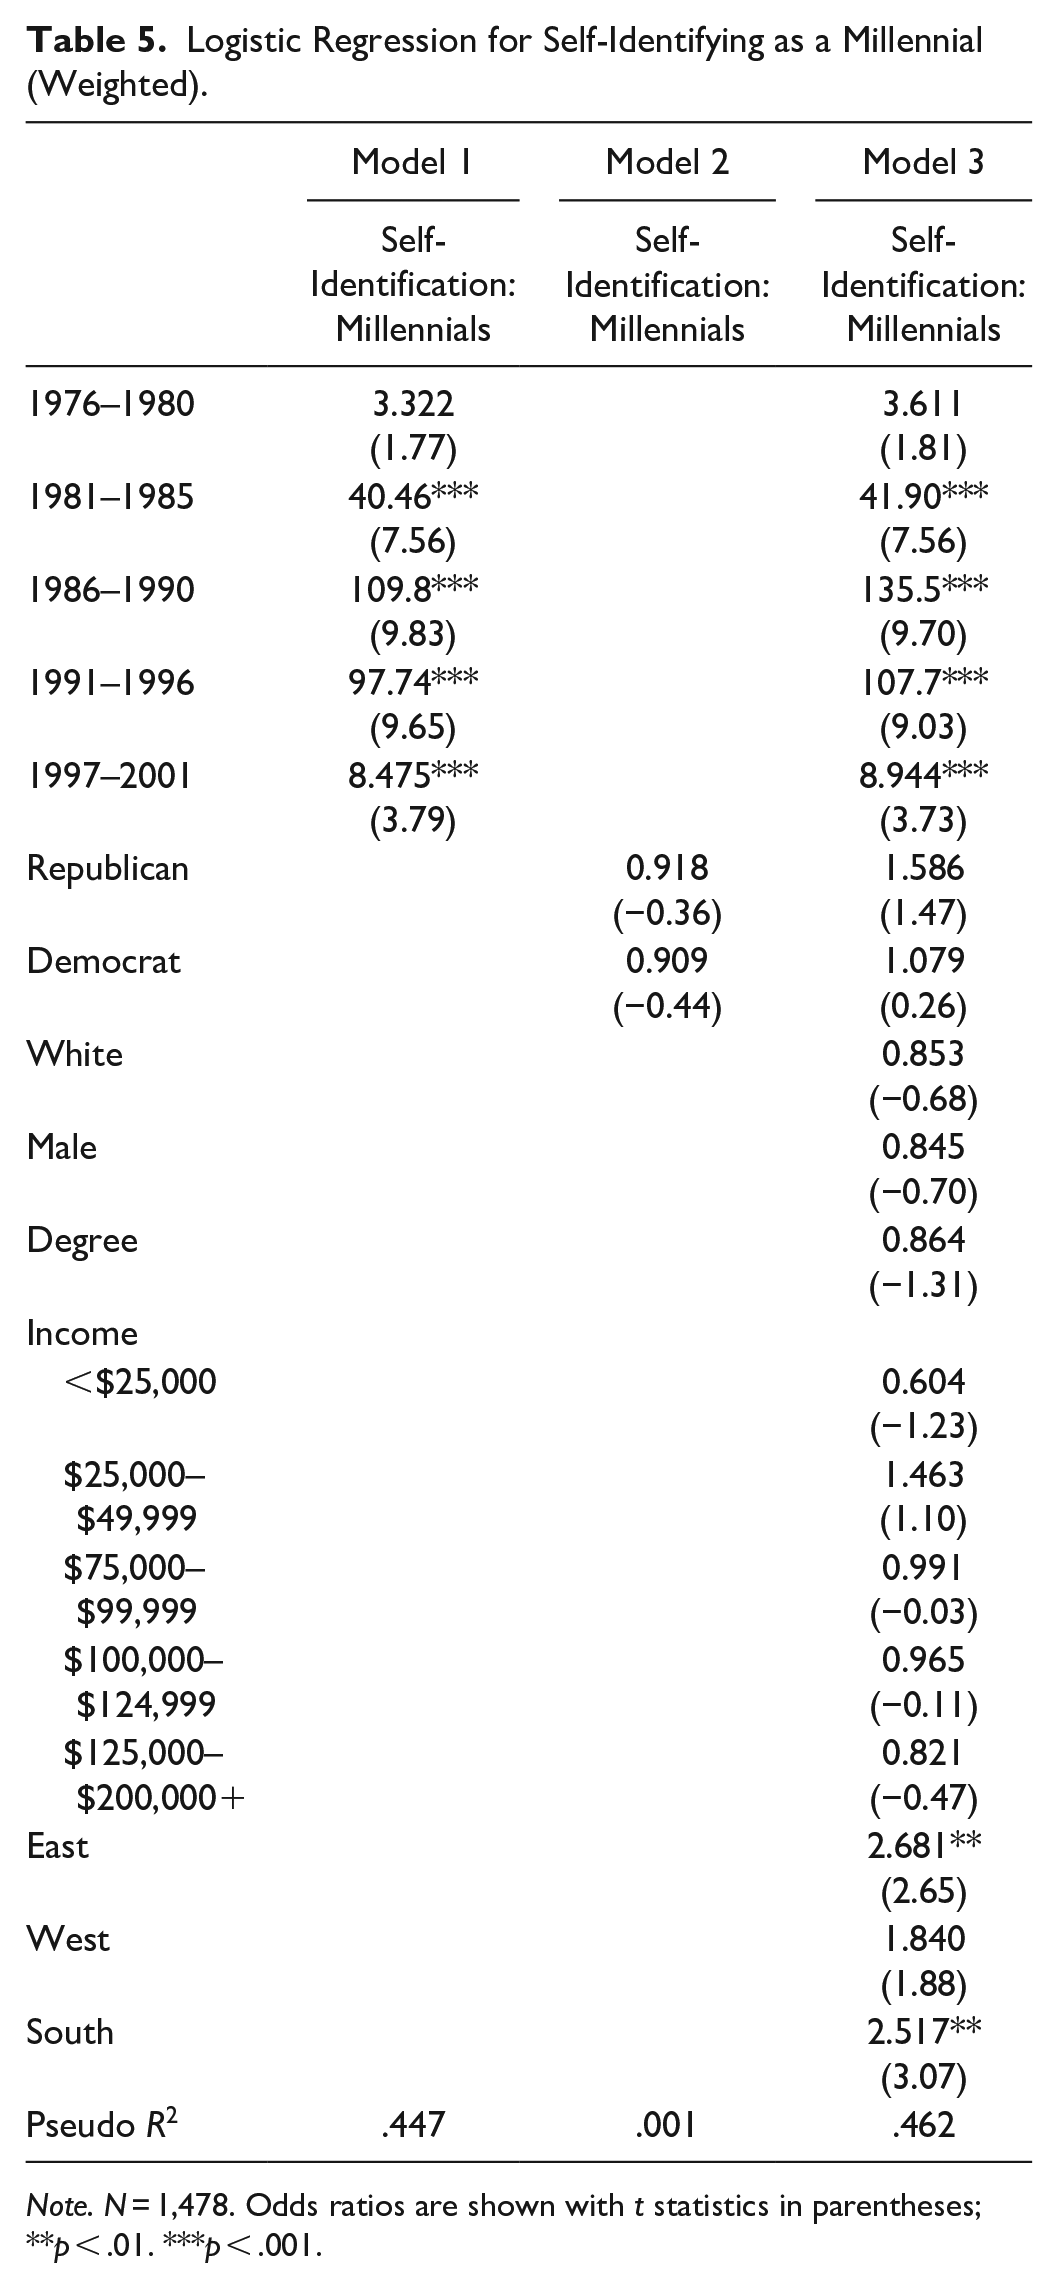
Note. N = 1,478. Odds ratios are shown with t statistics in parentheses;
p < .01. ***p < .001.
Logistic Regression for Self-Identifying as Gen Z (Weighted).
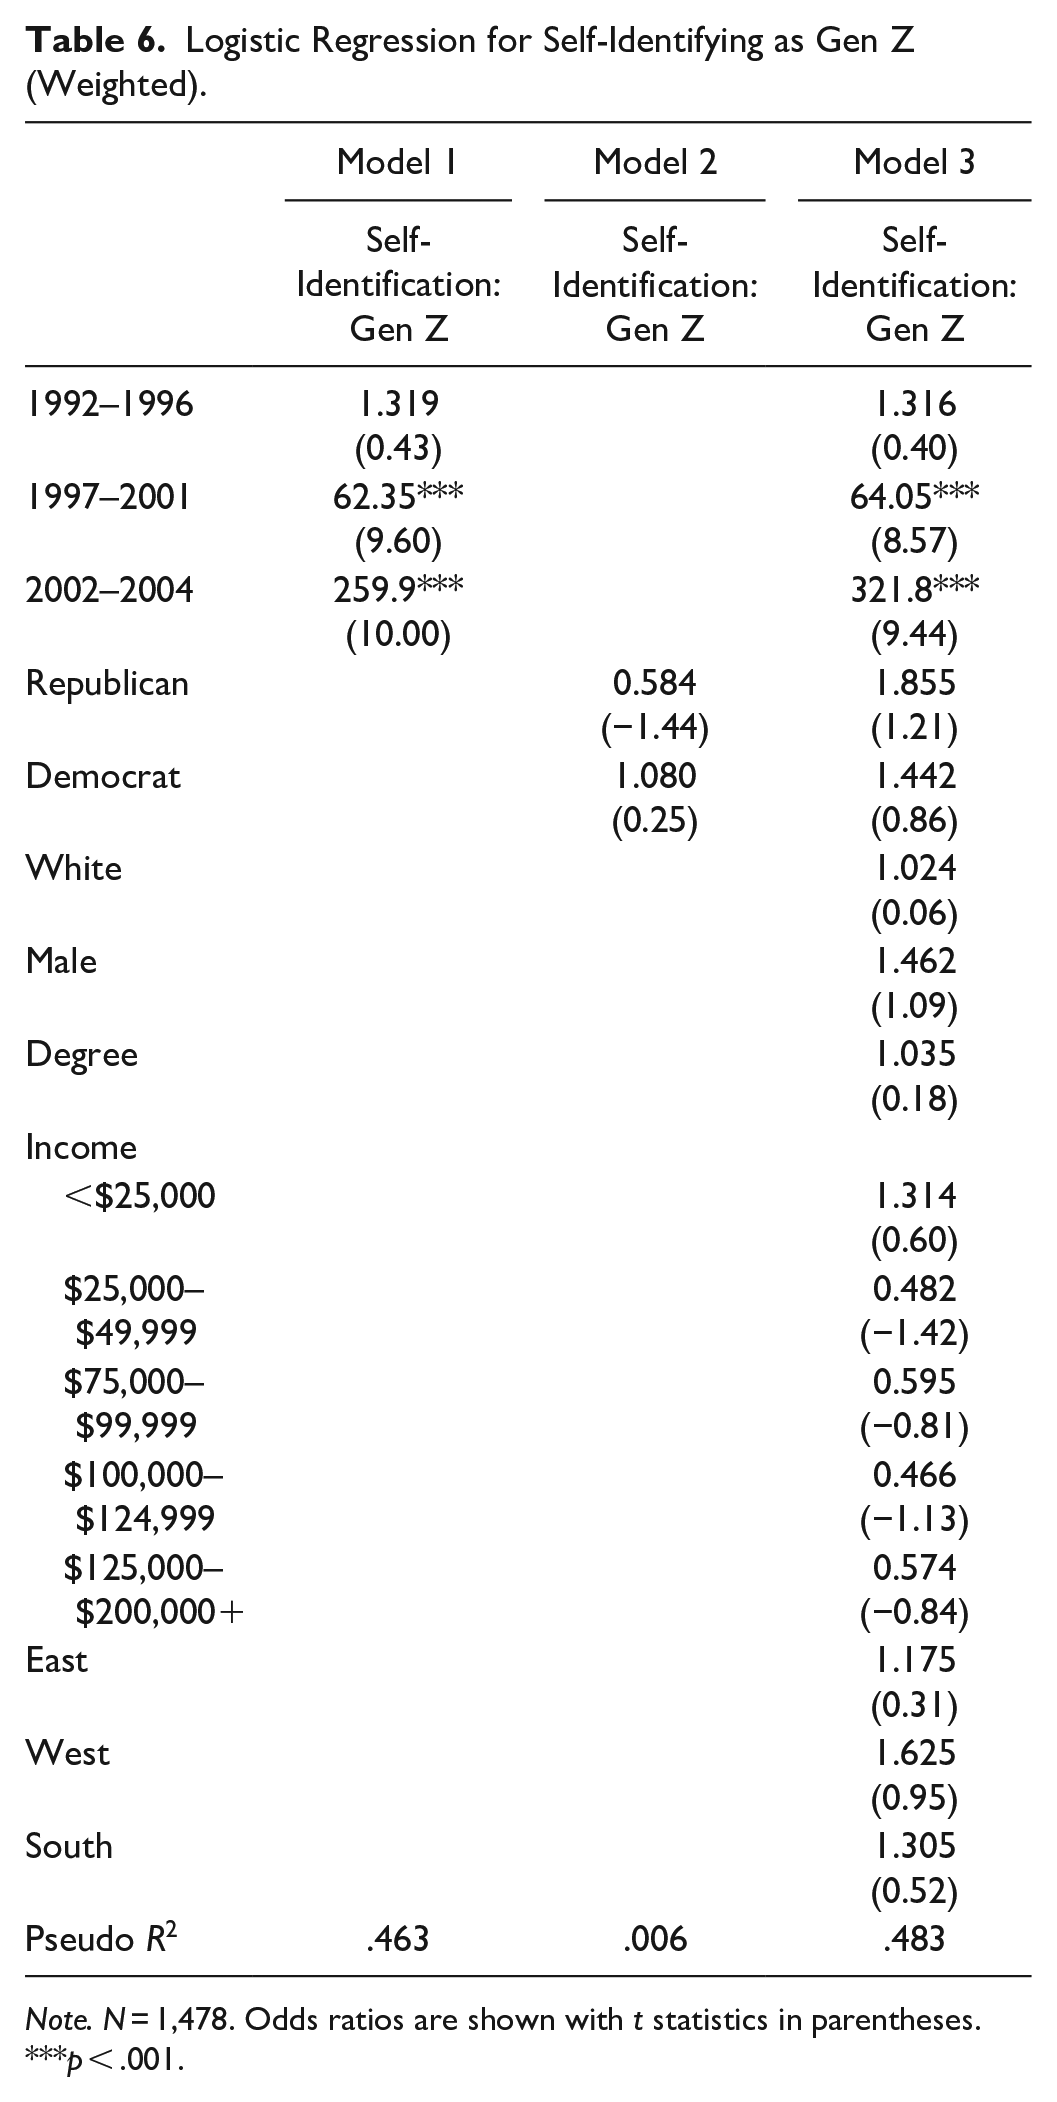
Note. N = 1,478. Odds ratios are shown with t statistics in parentheses.
p < .001.
Discussion
This study found that a majority of Americans do, in fact, self-identify with their “correct” corresponding generational labels, as defined by Pew Research Center’s birth year classifications (Dimock 2019). Yet, one important takeaway of this research is the remarkable extent of intragenerational variation in identifying with the group label. Within each generational grouping, there is a predictable pattern with the odds of identifying increasing from the early cusp years to a peak in the middle years of the cohort and then gradually declining to the later cusp years. Among all generational labels, the Baby Boomers cohort showed the highest peak of identification. Although the peak became lower for each subsequent generation, the other generations had the similar trend. Notably, these trends remained consistent even after controlling demographic composition of cohorts such as race, education, income, gender, and region. Although rates of affiliation with the Democratic and Republican parties varied by generational cohort, the study found no significant association between political partisanship and identification with any particular generational cohort, net of birth year.
These pundit-created, marketing-driven generational labels are a funny kind of social identity. In theory, they are tightly bound to a given set of birth years. But in practice, anybody can opt out or join a different cohort without suffering much cost from other social group members. Still, most people within each generational grouping do in fact identify with the “correct” generational label. Moreover, consistent with social identity theory (Brewer 2001; Brown 1990; Totelecan and Mann 2012), those who are more central to the in-group by dint of being born in the middle of generational range are more likely to adopt the generational identity. Although we have no measure of identity salience, it seems possible that those in the center of the birth range may also have stronger attachment to their generational identity. At the same time, our results indicate that the decision to identify with a generational label is not associated with partisanship or aligned with other identities (social class, gender, region, etc.). Given the strong social class and racial associations of many generational stereotypes, it is somewhat surprising to observe few differences in generational self-identification by class or race. What seems clear is that these generational labels have become recognizable social identities for a significant portion of the U.S. population and therefore merit further research. Still, for critics of these broad generational labels, this study also highlights the extreme intragenerational variation in identification with these cohorts.
One notable finding of our study is the extent to which the peak rate of identification is lower for more recent generations (90 percent for Boomers, 80 percent for Gen X, 66 percent for Millennials, and 73 percent for Gen Z). Partially, this trend may be a function of the longevity of the terms themselves. “Baby Boomer” has been around for at least 70 years, whereas “Gen X” and “Millennial” are 30 years old, and “Gen Z” has only been popularized since 2009. Although marketing firms are quick to use the latest generational moniker, many of the labels take time to become established in popular discourse and in the public imagination. It may be that “Gen Z” has not yet been fully adopted and is still fending off weaker contenders, such as “iGen.”
A second possibility is that older generations, especially Baby Boomers, may have higher (and although unmeasured here, perhaps stronger) generational identification because they are a less diverse cohort with more shared experiences. In addition to greater homogeneity in terms of racial, educational, and family structure, Boomers also had more of a shared set of pop cultural tastes. Younger groups, by contrast, may be responding to generational stigma. The especially low rate of identification for Millennials and the somewhat lower rate for Gen Z may reflect how frequently maligned those two generations are. Another possibility is that younger people may simply be more skeptical of these generational labels than older people.
Limitations and Future Research
Even as this research has advanced our understanding of generational self-identification, our study has some important shortcomings that point to unexplored avenues that warrant future consideration. Although SurveyMonkey uses a form of stratified random sampling from their enormous pool of willing participants to ensure a “nationally representative” sample and although we weighted the responses to national demographics, people who are willing to complete surveys online may be systematically different in some ways from other Americans. For example, they may spend more time online where generational rhetoric proliferates. Additionally, this study examined a sample of American adults, but we cannot be sure that the same findings would hold in other countries where such generational discourse is popular (e.g., UK) until they are replicated with a local sample.
In addition, in our survey, there was no measure of the intensity or salience of generational identification. That is, we knew how people identified but not to what extent or how relevant it was to them. One possible reason that generational identity did not correlate with other group-aligned identities is that people may be clearly but weakly identified with generational labels. Another possibility is that people born in the middle of cohorts may identify with their generation at higher rates is because it is simply easier to remember what one is “supposed to be” if one is not on the edge of a generational boundary. Without a measure of identity salience, we cannot establish what the identity means to respondents. Along the same lines, our survey did not offer respondents choices from the panoply of micro-generations, such as Generation Jones, Geratric Millennials, or Xiennials. Perhaps our survey did not capture enough nuance between the generations, and allowing for a wider range of identification categories may resonate more with people and encourage them to change their initial answers. In a related study using the same survey data, we examine how the generational identifiers differ from the cuspers in terms of in-group and out-group generational affect. How much people like or dislike their own generation relative to other generation begins to document the strength of generational identity (Lindner 2024). At the same time, we regard the current study as an initial venture in examining generational identity and hope that subsequent research will parallel research on other group identities in using salience measures.
Like all cross-sectional surveys, ours is a snapshot of one population at one point in time. At the time of our survey in 2022, only eight years of the Gen Z birth cohort had turned 18 (and were therefore eligible to be part of our sample). Future research ought to explore how identification trends develop in the future, especially as Gen Z comes of age, followed by the budding generation after them.
Conclusion
In conclusion, this study demonstrates that after decades of exposure to stories of Boomers and Millennials in mass media, Americans generally identify with one of four generational labels. The results suggest that these heavily marketed labels have solidified in social identities, providing a meaningful framework for differentiating their generational traits from those of out-groups. However, generational group identity appears to be much less clear-cut for cuspers compared to those born in the center of cohorts. Contrary to expectations, generational identity seems to be unaffected by partisan identity. Overall, the study’s findings indicate that although these generational labels have taken hold as social identities, they may not be as divisive as they appear to be in online communities.
Footnotes
Acknowledgements
We would like to thank the Skidmore College students enrolled in the Spring 2022 “Generations” seminar for their contributions to the survey design and John Brueggemann for providing feedback on earlier drafts.