
Abstract
Although rates of residential racial segregation and home prices are undoubtedly related, the temporal nature of the relationship has rarely been studied. Using fixed effects models in a cross-lagged framework, we examine how prior changes in segregation and home prices at the metro level predict changes in the other. Our findings suggest that increases in home prices predict increasing racial segregation years later, but increases in segregation fail to predict subsequent change in home values. Metros that experience a 1 standard deviation increase in home prices experience an associated 0.25 standard deviation increase in Black-White segregation 10 years later and a 0.18 standard deviation increase 20 years later. No relationship is observed for Hispanic-White segregation. We discuss implications for understanding the economic underpinnings of segregation. Findings also offer insight into future segregation trends and illuminate how changes in the housing market may drive demographic trends more broadly.
Home values vary for many reasons, although a central component of this variation is location. Indeed, some cities, and neighborhoods within cities, are deemed more desirable than others and command higher relative prices for homes. In U.S. cities, this spatial differentiation of place by value is also deeply intertwined with race. Despite minor declines in overall metropolitan residential ethno-racial segregation 1 after 1980, segregation remains a persistent feature of U.S. metropolitan life that has disadvantaged generations of residents in highly segregated neighborhoods (Krysan and Crowder 2017; Massey 2020; Massey and Denton 1993; Sampson 2012; Sharkey 2013). Although much is known about the relationship between home price and segregation at the submetropolitan level, there is scant research on the temporal nature of home values and segregation indices citywide. In this analysis, we ask the following research question: At the metropolitan level, what, if any, is the temporal relationship between changes in home values and changes in Black-White and Hispanic-White segregation?
To examine how prices and ethno-racial segregation are related over time, we gathered data on 398 metropolitan statistical areas (MSAs) for the years 1980, 1990, 2000, 2010, and 2019. Using fixed effect, cross-lagged regression analysis models, we analyze to what extent home prices in one year predict segregation levels 10 and 20 years later. We then switch the key variables to estimate how segregation in one year predicts prices 10 and 20 years later. We find that increases in home values at the metro level robustly predict increases in Black-White segregation indexes 10 and 20 years later but that changes in segregation do not precede any change in later home values. Additionally, we find that this temporal relationship does not exist for Hispanic-White segregation, suggesting ethno-racial nonequivalence in the home value/segregation relationship and alternative spatial assimilation patterns for Hispanic residents.
In the following, we draw on past work to posit three empirical scenarios regarding the temporal relationship between home values and segregation. We then analyze the data, revealing more precisely how changes in home values affect subsequent changes in segregation. We conclude with a discussion of likely mechanisms that underpin our findings and suggestions for future research. Our findings have implications for policies aimed at reducing segregation and the racial wealth gap (LaBriola 2023; Oliver and Shapiro 2013, 2019; Shapiro 2004) and for sociological theories about the role economic conditions play in altering ethno-racial segregation and how home values relate to and perpetuate racial-spatial inequality (Besbris 2020; Besbris and Korver-Glenn 2023; Taylor 2019).
Race/Ethnicity and Property Valuation
Decades of research have demonstrated the relationship between a neighborhood’s ethno-racial demographics and its home values. Home seekers pay more in Whiter neighborhoods, and it is generally the case that as the non-White (particularly Black) population in a neighborhood increases, property values decrease (Hipp and Singh 2014; Macpherson and Sirmans 2001; Moye 2014). This is borne out in studies of ethno-racially mixed neighborhoods, where residents tend to deem their neighborhoods as less desirable than homogeneous ones and where home values appreciate slower relative to neighborhoods with more White residents (Anacker 2010; Hipp 2009; Sampson 1991). As a result, Black and Hispanic homeowners have less wealth relative to White homeowners by way of home equity (Flippen 2001, 2004; Harris 1999; Oliver and Shapiro 2013).
Other work has pointed to the ways that race is consequential for home valuation. Real estate professionals of various kinds alert housing consumers to this value-race nexus. Real estate agents, for example, describe a particular unit’s desirability and potential for appreciation based on its location in a racialized hierarchy of neighborhoods within a given city (Besbris 2020; Besbris and Korver-Glenn 2023). Additionally, there is emerging evidence from news reports, audit studies, and publicized lawsuits that during real estate transactions, home appraisers undervalue homes owned by Black and Hispanic homeowners compared to similar homes owned by White homeowners (Hernandez 2021; Kenny 2023; Perry, Rothwell, and Harshbarger 2018). Appraisers likely exacerbate racially unequal property values by using a “sales comparison approach,” which associates homes with similar nearby properties (Howell and Korver-Glenn 2018, 2021). If historical processes have systematically undervalued homes in Black neighborhoods relative to homes in White ones, then the sales comparison approach reinforces these disparities.
Racialized property valuation has implications beyond individual home sale prices. In fact, different strands of research have shown how varying rates of appreciation of property values exacerbate racial wealth gaps. Indeed, racial disparities in home equity are the largest component of racial wealth gap (Shapiro, Meschede, and Osoro 2013). Furthermore, the home value gap is larger between high socioeconomic status (SES) Black homeowners and their White counterparts than it is between low SES Black homeowners and comparable SES White individuals, suggesting further socioeconomic nonequivalence in wealth generation for upwardly mobile Black homeowners (Thomas et al. 2018). This racial wealth gap has consequences for social mobility and inequality more generally (Aaronson, Hartley, and Mazumder 2021; Coate and Schwester 2011; Kim 2003; Shapiro 2004). Importantly for our purposes, the racial gaps in home value are also larger in more segregated places, and prior work has theorized the relationship between housing value and segregation as a primary way the racial wealth gap is maintained (Denton 2001; Oliver and Shapiro 2013).
Beyond household-level wealth disparities, low property values are a key component of socio-spatial inequality and spatial disadvantage. Because property tax revenue funds local social services, inequalities in home value produce inequalities in school funding, the building and maintenance of local infrastructure, and public transportation accessibility (Dreier, Mollenkopf, and Swanstrom 2014). Furthermore, this spatial inequality often follows racial lines in racially segregated cities. Neighborhoods provide access to a litany of resources that can promote or inhibit economic mobility, healthy environments, or positive social networks. Residents in majority White spaces with higher property values have, on average, greater access to resources (Krysan and Crowder 2017; Quillian 2014; Sampson 2012; Sharkey 2013).
Neighborhood racial composition and the racial identity of a home seller have clear implications for how property is valued during the real estate transaction process. However, extant research has overwhelmingly focused broadly on point-in-time and within-metro differences in segregation and aspects of housing inequality, including disparities in home value (Hwang and McDaniel 2022). What remains unclear is the temporal nature of the relationship between home prices and segregation at higher levels of geography.
Trends in Metropolitan Ethno-racial Segregation, 1980 through 2020
Segregation at the metropolitan level has seen modest average declines since 1980, although generally, Black and White residents remain segregated from each other. Increasing ethno-racial diversity in the U.S. population overall accounts for much of the changing rates of segregation in the United States (Frey 2021; Iceland and Sharp 2013). From 1980 to 2020, the percentage of Americans identifying as Hispanic increased from 6.5 percent to 19 percent, whereas those identifying as Black remained relatively constant at 11.5 percent to 12 percent. The share of White Americans declined from 79 percent in 1980 to 58 percent in 2020, driven largely by an older age structure, higher mortality rate, and a lower fertility rate relative to Hispanic and Asian residents (Frey 2022b; Lichter and Johnson 2020; Manson et al. 2023). These compositional dynamics are driving, in part, the overall modest declines in White/non-White segregation and declines in Black/Hispanic, Black/Asian, and Hispanic/Asian segregation (Logan and Stults 2022).
However, there are differences in how racial groups experience segregation from one another in terms of magnitude and rate of change. Metropolitan Black-White segregation declined relatively consistently from a dissimilarity index of 0.75 in 1980 to 0.55 in 2020 (Iceland and Sharp 2013; Logan and Stults 2022). This is the lowest level of Black-White segregation since the start of the post-civil rights era. Although Black-White segregation continues to fall at a faster rate relative to other race groups’ segregation from White individuals, it is still at the highest overall level compared to other ethno-racial group segregation from White individuals, and mobility patterns do little to bring Black-White segregation to parity with other race groups overall (Crowder 2000; Crowder and South 2008; Quillian 2002; South and Crowder 1997, 1998). In urban settings, Hispanic residents have had near-stable segregation levels from White neighbors but have increasingly shared residential space with Black neighbors over the same time frame (Iceland and Sharp 2013), and metropolitan Hispanic-Black segregation is decreasing at a much faster rate than Hispanic-White segregation (Lichter, Parisi, and Taquino 2015a). These patterns indicate different socio-spatial relations between different ethno-racial groups.
Indeed, these findings are supported by studies that identify a growing number of urban places where Hispanic and Black residents share neighborhoods (Lichter et al. 2015a). Yet despite the changing character of residential segregation, the persistence of metro-level segregation in the United States raises multiple questions. Segregation is linked to a host of adverse outcomes at the metro, neighborhood, and individual levels, including racial disparities in health, education, employment, development, intergenerational mobility, and wealth (Krysan and Crowder 2017; Quillian 2014; Sampson 2012; Sharkey 2013), and neighborhood racial composition and metropolitan segregation indexes remain highly correlated with home values.
The Current Study
The current study describes the temporal relationship between changes in home price and racial segregation at the MSA level. We focus our analysis on Black-White segregation and Hispanic-White segregation due to the relatively high shares of these groups in our MSA sample across the study years. Much is known about neighborhood-level residential mobility and racially discriminatory practices related to home values and racial segregation. These neighborhood dynamics may produce observable, metropolitan-level patterns between home price and segregation. Furthermore, given how housing costs (either in home prices or rental costs) inform future residential mobility options for movers and how neighborhood racial structure informs contemporaneous home valuation, we expect a sequential, MSA-level relationship between home price change and segregation.
We posit that three possible temporal scenarios may exist in the home price-segregation relationship at the MSA level.
Scenario 1a: Home Price Growth Predicts Subsequent Increases in Segregation
In this scenario, we expect a positive temporal relationship wherein increases in MSA home prices are associated with increased MSA segregation in later years. This is plausible given that rising housing costs limit housing options for movers. If housing in an MSA becomes more expensive, residents unable to afford the rising cost would subsequently relocate to more affordable places when they move and be replaced by upwardly mobile in-movers. This would stratify an MSA by SES and ability to achieve residential attainment in increasingly expensive housing options. These processes of economic stratification in residential mobility and attainment are also processes of racial segregation. People who identify as Black or Hispanic have lower average income, wealth, and occupational prestige than those who identify as White, and there is evidence that even when matched on similar household-level socioeconomic characteristics, Black movers are less able to achieve their residential attainment goals compared to White movers due to nonequivalences in lending, real estate discrimination, and information disequilibrium related to housing options (Krysan and Crowder 2017). This means White homebuyers and movers are more successful in moving to or staying in wealthier, Whiter places than are their Black counterparts (Iceland, Sharpe, and Steinmetz 2005; Pais, South, and Crowder 2012).
It is also possible that non-White movers are steered away from neighborhoods with rising prices by housing market intermediaries like real estate agents (Besbris 2020; Besbris and Faber 2017) or assume that they will face discrimination in high-value neighborhoods and do not seek housing in these neighborhoods (Krysan and Crowder 2017). Home values, racial disparities in residential attainment, and information disequilibrium pertaining to affordable spaces together are segregating processes, and as such, we expect overall increases in home values to predict subsequent increases in segregation. Race-based real estate valuation practices manifest at the macro scale via increases in average home prices evenly across the MSA or due to several rapidly inflating neighborhoods. These price increases maintain and produce further racial segregation by subsequently preventing non-White, particularly Black Americans from locating in certain areas via economic exclusion and racialized housing search processes.
Scenario 1b: Home Price Growth Predicts Subsequent Decreases in Segregation
The alternative to price change preceding segregation is a negative temporal relationship, or one in which increases in MSA home prices predict lower levels of MSA segregation in later years. Based on neighborhood-level processes of housing valuation, racialized housing searches, and ethno-racial segregation, we do not believe this is a likely outcome. Increasing costs, as mentioned previously, would work to further segregate based on the discriminatory processes of racially stratified residential mobility and attainment.
Scenarios 2a and 2b: Segregation Change Predicts Subsequent Home Price Change
The second possible scenario is that segregation levels predict—either positively (Scenario 2a) or negatively (Scenario 2b)—a change in home prices in later years, although we do not expect this to be the case. If an MSA’s segregation level is high, this indicates a greater number of segregated neighborhoods that are economically and institutionally disadvantaged. Furthermore, greater non-White resident share in these locations informs racialized notions of neighborhood quality, safety, and financial value on the part of real estate industry professionals. For both reasons, such places are—in the immediate and short terms—subject to low property appraisals and sale prices. The opposite is true for advantaged and predominantly White places commanding relatively high appraisals and sales prices. These processes of active and racialized over- and undervaluations of homes in different neighborhoods across an MSA occur at the neighborhood, not metropolitan, scale and occur contemporaneously. That is, perceptions of the immediate neighborhood simultaneously inform the valuation of homes. Thus, we do not expect to observe price changes 10 or 20 years after measuring changes in segregation.
Scenario 3: Home Price Growth and Segregation Predict Changes in One Another
In a final scenario, it is possible that home prices and segregation are so intertwined that both simultaneously co-occur with one another. That is, changes in each are statistically significantly related to subsequent changes in the other. Here, the home price-segregation relationship would occur simultaneously—a distinct possibility given the tightly linked nature of race and housing valuation in U.S. metropolitan areas. Still, the presence of this simultaneous relationship does not preclude the presence of temporal relationships as well, and indeed, we find evidence for simultaneity between home price change and both Black-White and Hispanic-White segregation.
But in an additional and novel finding, we find strong empirical evidence supporting Scenario 1a, where increases in MSA home prices precede increases in MSA Black-White segregation.
Data and Methods
Sample
To analyze the sequence of racial segregation and housing prices, we collected data on 398 MSAs in the United States for the years 1980, 1990, 2000, 2010, and 2019. We analyze MSAs—the Office of Management and Budget’s (OMB) measure of metropolitan areas—because housing markets span metro areas and the metropolitan segregation literature often uses MSAs as the superunit when measuring racial segregation. MSAs consist of one or more counties that are economically or socially connected and that contain at least one urbanized core of 50,000 people or more. The 398 sample MSAs are those with data on all variables for at least three years, and we use the OMB’s 2013 MSA boundaries to keep the geographies consistent over time (Executive Office of the President and Office of Management & Budget 2013). The MSAs in our sample were home to 82 percent of the U.S. population in 2019. We use the terms “MSA,” “metro,” and “metropolitan area” interchangeably.
Dependent and Explanatory Variables
Our variables of interest are housing prices and segregation. Housing price data come from the Federal Housing Finance Agency’s (FHFA) all-transactions index, which estimates MSA-level housing prices by combining sale prices and appraisal data on repeated sales for mortgages bought or guaranteed by Fannie Mae and Freddie Mac (FHFA 2023a). The index is calculated using differences in price for repeated, sequential, same-property sales. The index captures the percentage that housing prices change over time. It reflects percentage differences compared to the baseline year (FHFA picks 1995 as the benchmark year); therefore, it does not represent dollar amounts. It indicates whether average home costs in each metro in each year increased, stagnated, or decreased (Calhoun 1996). We annualized the data by averaging the quarterly figures and adjusted them for inflation using the Bureau of Labor Statistics’s “all items less shelter” consumer price index (U.S. Bureau of Labor Statistics 2023). The FHFA uses the latest available MSA boundaries retroactively, which were the 2013 boundaries at the time we accessed the data (FHFA 2023b). Changing MSA boundaries are not a concern because each observation year uses the 2013 MSA boundaries.
Our primary measures of segregation are the Black-White and Hispanic-White dissimilarity indices (D; Duncan and Duncan 1955), calculated using tract-level ethno-racial data from the U.S. decennial census (U.S. Census Bureau 1980, 1990, 2000, 2010) and the American Community Survey (ACS; U.S. Census Bureau 2021). The 2019 values of the segregation data are five-year estimates from the ACS, covering 2015 to 2019, so we averaged the housing price index across the same five years to generate a comparable value for this time period. We use the terms “Black” and “White” to refer to non-Hispanic people of each race. For this and all census variables, we use the 2013 MSA boundaries for all years by building MSAs out of counties using the 2013 delineations (Executive Office of the President and Office of Management & Budget 2013).
The housing price index is a change score capturing the percentage difference in an MSAs’ home values. The dissimilarity index represents the percentage of people who would have to move tracts for each tract in an MSA to share the racial makeup of the MSA as a whole. To make the two outcome measures reciprocally comparable, we standardize their raw values by subtracting each variable’s sample mean from each observation and dividing it by the within-unit sample standard deviation. This converts each value to its number of standard deviations from the mean.
Control Variables
To capture real estate market dynamics, we measure the percentage of housing units that are one-bedroom, the percentage that are owner-occupied, the percentage that are vacant, and the total number of units (scaled to 1,000s of units). As demographic controls, we include measures of MSAs’ total population (logged to reduce intense skewness), the percentage of men in each MSA, the median household income (inflation-adjusted $1,000s), and the percentage unemployed. We hold MSA boundaries constant over time, so population is also a measure of population density. We include two measures of racial composition, the percentage of each metro that is non-Hispanic Black and the percentage that is Hispanic. Because these variables are likely correlated with our segregation outcome measures, we estimated versions of our models omitting the related racial composition variable, and the results were nearly identical. All control variables come from the decennial census or the ACS. We linearly interpolated control variables for any MSA-years missing data.
Analytic Strategy
We analyze the sequence of segregation and home price fluctuations in cross-lagged fixed effects regression models (Allison 2009). Such an approach uses the panel structure of the data to first estimate how well changes in segregation are predicted by temporally lagged changes in home prices, and then it flips the model to estimate how well changes in home prices are predicted by temporally lagged changes in values of segregation. If one variable more strongly predicts the other variable than vice versa, we will say that the first variable precedes the other temporally. If both are statistically significantly related to future values of each and at a similar magnitude, we will say neither precedes the other temporally and that they occur simultaneously. Across the five time periods (1980, 1990, 2000, 2010, and 2019), we test both one-time-period lags (10 years) and two-time-period lags (20 years). We use 2019 as our last year because of concerns over 2020 census data quality (Jacobsen 2023). The different lengths between time periods will not affect our findings because we measure all variables at the same point in time.
To determine sequence, the cross-lagged approach analyzes the relationships of variables when lagged to past time points and when controlling for other possible correlates (Granger 1980). This approach has been used to examine the reciprocal relationships of crime and racial composition (Liska, Logan, and Bellair 1998), crime and home sales (Hipp, Tita, and Greenbaum 2009), and gentrifiers and housing prices (Zapatka and Beck 2021), among other dynamics. We use fixed effects models in the cross-lagged framework because fixed effects models analyze within-unit variation (in this case, within-MSA), thereby controlling for all time-invariant characteristics of MSAs, such as their geographic location, state laws, and history of racial exclusion, so long as those characteristics did not change during the study window (Wooldridge 2019). The MSA fixed effects also control for baseline (i.e., pre-1980) levels of housing price and segregation, allowing us to isolate the variables’ sequence to just the study years. This approach analyzes differences between years within MSAs, capturing change over time.
In the cross-lagged models, our unit of analysis is the MSA-year. We lose one year of outcome-variable data because the lag structure requires the explanatory variables be measured prior to the outcome. We drop any MSA-years missing data. This analytic approach generates a sample size of 1,311 MSA-years in the models with no lags and those with one-decade lags. The sample is 913 MSA-years in the models with two-decade lags. Models limited to only MSAs with no missing data for any years were substantively identical, as discussed in the following “Sensitivity Analyses” section. To mitigate the serial autocorrelation induced by drawing several observations (years of data) from the same place, we cluster the standard errors by MSA (Sayrs 1989). We measure the controls at the same time as the outcomes. Because segregation data are measured by the decennial census, our time periods are every decade, and our time lags are in 10-year increments.
Our models take the following forms:


where yit is the first outcome variable (the standardized segregation index score in MSA i at time t) in Equation 1. This variable moves to the right side of the equation in its lagged form yit–1 in Equation 2 to act as an explanatory variable. The variable xit represents the second dependent variable (the standardized home price index score in MSA i at time t) acting as the outcome variable in Equation 2 and an explanatory variable in lagged form xit–1 in Equation 1. The objects μ t and τ t are intercepts, β1 and δ1 are our coefficients of interest (estimands), zit represents a vector of control variables, α i and η i are the MSA-specific fixed effects, and ε it is the error term.
Results
Figure 1 shows the trends of home prices and segregation over time in the 398 sample MSAs. Here, segregation is measured every 10 years, and home prices are measured every year. In our sample MSAs, home prices and Black-White segregation were moving in opposite directions before about 2006, but both increased following 2012. Hispanic-White segregation and home prices tracked one another more closely. The trends in this graph differ somewhat from more comprehensive studies of segregation or housing prices (Frey 2022a; Logan and Stults 2022) because our missing data procedure requires us to analyze a smaller subset of MSAs than the more national measures and because we use 2019 ACS data rather than 2020 decennial census data. Because our goal is to analyze the segregation-price sequence and not national trends, this is not an issue for our findings but means Figure 1 should not be taken as a nationally comprehensive picture.

Black-White segregation and home prices in sample metros.
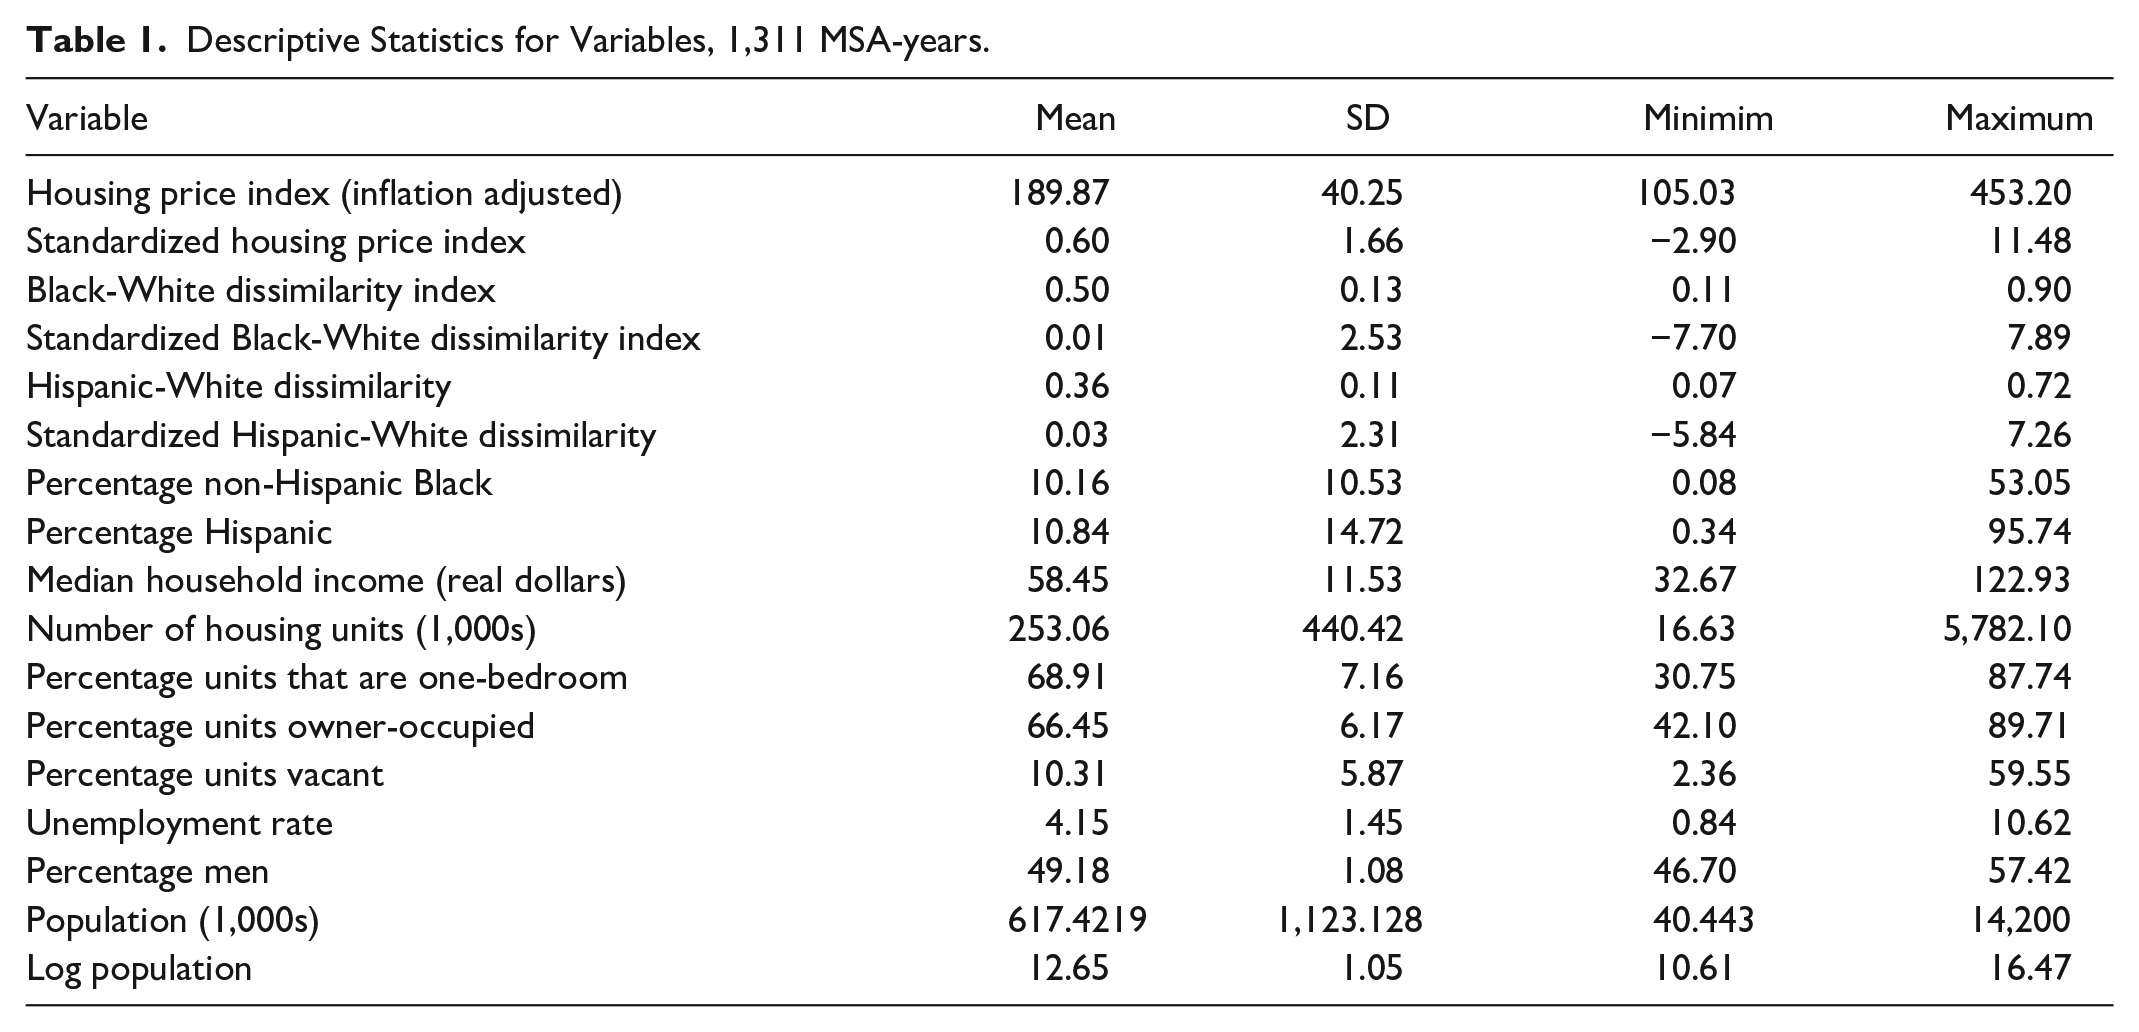
Table 1 provides a descriptive overview of the country’s housing market between 1980 and 2019. It depicts the variables we use in our multivariate analyses.
Descriptive Statistics for Variables, 1,311 MSA-years.
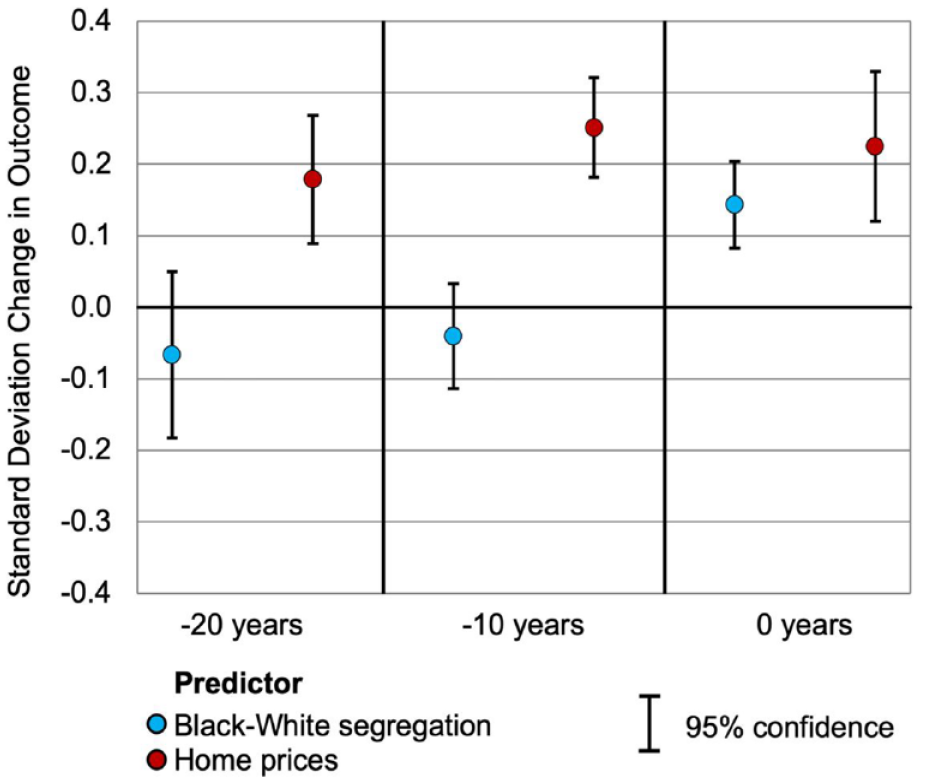
Figures 2 and 3 display the results of our cross-lagged fixed effects models. Each of the point estimates and 95 percent confidence intervals in Figure 2 come from separate regressions, and each includes all control variables. Figure 2 shows the results for home prices and Black-White segregation. Starting at the right, when measured contemporaneously (i.e., zero years apart), home prices and Black-White segregation have a reciprocal relationship. The darker, red dot represents change in segregation when the explanatory variable is home prices. A 1 SD increase in home prices was associated with a 0.22 SD increase in the outcome, segregation, in the same year. Metros that underwent a 1 SD increase in Black-White segregation (represented by the lighter, blue dot) experienced an associated 0.14 SD increase in home values in the same year. The 95 percet confidence intervals indicate the two coefficients are statistically significantly different than zero, meaning the two share an association, but they are not statistically significantly different from one another, meaning the two are co-occurring. This finding is consistent with the Scenario 3, described previously.
Coefficients for explanatory variables in Black-White segregation fixed effects models, all controls included.

Coefficients for explanatory variables in Hispanic-White segregation fixed effects models, all controls included.
Naive analyses of prices and segregation in the same year, however, provide an incomplete view of their relationship. To interrogate the aforementioned Scenarios 1a through 2b, we examine the temporality of the home price-segregation relationship. The middle pair of coefficients in Figure 2, those with 10-year lags, indicate that changes in home prices predict subsequent changes in Black-White segregation but not vice versa. Metros that experienced a 1 SD increase in home prices would be expected to experience, 10 years later, an associated 0.25 SD increase in the Black-White dissimilarity index of segregation (represented by the middle darker, red dot in Figure 2). The converse, however, is not true. Increases in segregation are unrelated to subsequent home price changes, as represented by the 95 percent confidence intervals for the 10-year-lagged value of segregation crossing the zero line (represented by the middle lighter, blue dot in Figure 2). There is no statistically significant relationship between changes in segregation and changes in home values 10 years later. The same pattern is true for 20-year lags, as indicated by the left-most pair of coefficients in Figure 2. A 1 SD increase in home prices was related to a 0.18 SD increase in dissimilarity 20 years later, but changes in the measure of dissimilarity were unrelated to changes in home prices 20 years hence, as indicated by the confidence bands for the 20-year-lagged housing price coefficient being statistically significantly different than zero and the bands for the segregation coefficient including the zero line. Thus, we find evidence supporting Scenario 1a for the relationship between home price and Black-White segregation.
Figure 3 repeats the analyses for Hispanic-White segregation. Here, a different pattern emerges. Changes in segregation and home prices in the same year are reciprocally related but in a negative direction, consistent with Scenario 3. Metros that saw more of one saw less of the other. Per the right-most pair of coefficients in Figure 3, a 1 SD increase in home prices was associated with a 0.26 SD decrease in Hispanic-White segregation, represented by the darker, red dot. When the variables are flipped, a 1 SD increase in segregation predicts a 0.22 SD decrease in prices, represented by the lighter, blue dot. Ten years out, neither force has a statistically significant relationship with future values of the other, as demonstrated by both confidence intervals crossing the zero line for the middle pair of coefficients in Figure 3. At the 20-year lag, changes in segregation have a slight suppressive relationship with future changes in home prices. For Hispanic-White segregation, we find only a weak temporal home price-segregation relationship, providing some limited evidence for Scenario 2b and no evidence for Scenarios 1a and 1b.
Table 2 displays the coefficients that underlie Figure 2, including those for the controls. As a reminder, outcomes and control variables are measured at the same time period, and only the key explanatory variables are lagged. In the models with Black-White dissimilarity, more housing units are associated with less Black-White segregation and higher prices. MSAs that added one-bedroom units had lower prices in all models. Unsurprisingly, home prices increased as incomes did in all models. MSAs that added Hispanic residents had less Hispanic-White segregation, but MSAs that added Black residents did not have less Black-White segregation. As metros became denser, their home prices increased in all models and had more segregation in two of the four models (because we hold MSA boundaries constant over time, population reflects population density).
Coefficients and Standard Errors, Fixed-Effects Models.

Note: Housing price and segregation indices are standardized.
p < .05. **p < .01. ***p < .001.
Sensitivity Analyses
To ensure our findings were not sensitive to modeling or sample choices, we ran a series of robustness checks, the results of which are displayed in Table 3. The top of each column indicates the outcome variable, and each cell contains the coefficients for the other of our two variables of interest (e.g., the “0.251***” in the first cell is the coefficient for housing price index in the model predicting segregation). The models here are identical to those in Table 2 except for the change indicated in the left column. For parsimony, we present only the results of the models with Black-White segregation here.
Coefficients and (Standard Errors) from Sensitivity Analyses for Models with Black-White Segregation.

Note: Housing price and segregation indices are standardized. The top of each column indicates the outcome variable, and each cell contains the coefficients for the other of our two variables of interest (e.g., the “0.251***” in the first cell is the coefficient for housing price index in the model predicting segregation).
p < .05. **p < .01. ***p < .001.
As the consistent coefficients indicate, the results are robust to a wide range of alternate specifications. The first row in Table 3 shows the baseline model identical to that in Table 2. The second row in Table 3 uses an alternate measure of segregation. The dissimilarity index we use in the primary models is a measure of evenness. It can be interpreted as the percentage of MSA residents of one race group that would have to move census tracts in order for every census tract to resemble the larger metro’s racial structure. Perhaps our results would be different if we used a measure of exposure, such as if we instead asked: How much contact do people of the non-White group have with White people? To capture “the extent to which minority members are exposed only to one another,” we reran our models replacing the dissimilarity index with the isolation index (Massey and Denton 1988). With this alternate measure, the results are the same. Housing price fluctuations predict segregation fluctuations 10 and 20 years later, but segregation does not predict housing prices.
Our third sensitivity analysis uses two-way fixed effects for both MSA and year, the latter of which controls for any nationwide events that happened in a year. Here, changes in Black-White segregation are statistically significantly related to future home price changes but in a negative direction. Including a lagged dependent variable in Analysis 4, which can control for historical trends in the outcome that might affect its current value, does not alter the baseline results.
The fifth and sixth robustness checks reveal an interesting heterogeneity in the home price-segregation relationship. Home price fluctuations in the 100 largest MSAs have a weaker relationship with segregation fluctuations than in the 297 smallest MSAs, as evidenced by the larger coefficients on home price when analyzing only the smaller MSAs. The nonsignificance of the relationship among the largest metros at the 20-year lag might be an artifact of the smaller sample size. This reveals that the home price-segregation relationship is stronger in smaller metro areas compared to larger ones.
As indicated by Analyses 7 and 8, changing our approach to population weighting or missing data does not alter the results. Nor does limiting the sample to places with at least 1,000 Black people, as indicated by the ninth analysis. More broadly, the consistent findings in Table 3 provide assurance that our findings are accurate and robust to alternate specifications.
Discussion
Our analysis provides strong evidence of a temporal relationship between home price change and levels of segregation, specifically, that increases in home prices at the metro level precede higher levels of Black-White segregation by 10 and 20 years. Additionally, our findings suggest that levels of Black-White segregation do not predict subsequent change in home prices. These findings hold through multiple model specifications and robustness checks. Overall, changes in home price are highly predictive of subsequent change in Black-White segregation. At the same time, we find no predictive temporal relationship between changing home prices and levels of Hispanic-White segregation.
Although our study does not address the mechanisms by which this relationship manifests, these findings suggest the pervasive role metro-level economic factors play in the subsequent Black-White segregation throughout the United States. As outlined in Scenario 1a, as housing costs rise on average across a metro area, those unable to afford the rising cost burden may eventually relocate to less expensive areas within the MSA. At the same time, upwardly mobile movers may ascend to the now vacant and more expensive spaces. This average MSA price increase may occur by either average uniform price increases across all MSA neighborhoods or, more likely, from price change differences between gentrifying neighborhoods and stable or declining neighborhoods.
This process may induce subsequent segregation for two reasons. The first is that SES is highly correlated with race across the study period. Thus, the processes of socioeconomic neighborhood stratification in terms of residential attainment are also processes of racial segregation. Socioeconomic nonequivalence in residential attainment further suggests that even equally resourced Black and White residents still may be residentially stratified by neighborhood home prices. Second, the housing search is racialized both with information disequilibrium in possible housing options (Krysan and Crowder 2017) and in how real estate professionals steer differently raced buyers based on assumed differences in neighborhood preference, buying power, and racialized notions of neighborhood space (Besbris 2020; Besbris and Faber 2017). In both scenarios, segregation follows home price increases.
Absence of Predictive Relationship for Hispanic-White Segregation
The lack of strong significant findings for Hispanic-White segregation suggests some level of racial socioeconomic nonequivalence between Hispanic and Black metro residents in terms of residential attainment and integration with White neighbors across a metro area. Other scholars have noted lower levels of White segregation for Hispanics compared to their Black counterparts (Lichter et al. 2015b, 2018; Rugh and Massey 2014), suggesting that the processes inducing and reinforcing segregation may vary across ethno-racial groups.
Black-White segregation is a result of early and mid-twenthieth-century de facto and de jure discrimination in housing. These policies and practices included Home Owners’ Loan Corporation redlining (Aaronson et al. 2021; Faber 2021; Mitchell and Franco 2018), race-restrictive covenants and land deeds (Gotham 2000), and legal industry discriminatory practices, such as blockbusting, racial steering, and mortgage and rent discrimination (Rothstein 2017; Schwartz 2021). The racially discriminatory policies and informal practices together with racialized mobility patterns of the early- and mid-twentieth century established and hardened spatial-racial boundaries between White and Black Americans and created the hyper-segregated metros of the 1960s and 1970s (Charles 2003; Krysan and Crowder 2017; Massey and Denton 1993). The majority of neighborhoods that were predominantly White or predominantly Black before large influxes of Hispanic and Asian migrants after 1980 remained so by 2010 (Holloway, Wright, and Ellis 2012; Hwang and McDaniel 2022; Massey and Tannen 2018).
Such extensive, racialized history is not necessarily applicable to the causes, trends, and magnitude of Hispanic-White segregation. Prior to 1980, there was a comparatively small U.S. Hispanic population that was primarily located in the Southwest and in dense enclaves in major cities (Reisinger and Tettey-Fio 2010). However, Hispanic immigration has increased dramatically since 1980, and the growing Hispanic population has settled in new and emerging destinations across rural and urban America (Lichter and Johnson 2020; Lichter et al. 2015a, 2018). This is to say that there are important differences in demographic trends, spatial distribution, and racialization processes across Black and Hispanic residents in the United States that matter for their segregation from White residents and their economic mobility and neighborhood attainment patterns. Still, ethno-racial discrimination against Hispanics intensified alongside Hispanic population growth (Galster 1990; Quillian, Lee, and Honoré 2020; Ross and Turner 2005), helping to maintain a relatively high and consistent average U.S. Hispanic-White dissimilarity index after 1980.
Limitations and Future Directions
This study is not without limitations. First, our analysis assesses the average relationship of home price change and Black-White segregation at the MSA level. It provides an important empirical point on a previously unknown relationship in urban America. But patterns of metropolitan segregation are becoming increasingly nuanced and differentiated. Although our findings uncover an average, predictable MSA-level temporal pattern, there may be spatial heterogeneity in the home price-segregation relationship. For instance, regional or state variation in housing policy regimes or housing stock characteristics may attenuate or exacerbate the strength of this relationship. Indeed, our sensitivity analysis suggests relationship heterogeneity related to MSA size, at least. To begin to address the issue of regional, state, and MSA heterogeneity in the home price-segregation relationship, researchers could apply a similar analytical framework but consider and include theoretically relevant city, state, or regional typologies to better explain the relationship between home prices and segregation.
Second, we cannot observe the presence or absence of within-metro spatial heterogeneity in the home price-segregation relationship. Because we are investigating this relationship at the MSA level, we do not observe if increases in home values are uniform across all neighborhoods or if there are heterogeneous changes in home values within MSA neighborhoods. Nor do we observe which subunits within the metro area are changing in racial composition to induce metro-level changes in segregation indices. Scholars may conduct a similar cross-lagged analysis but use census tracts or other smaller subunits within a single city. A study like this would allow the researcher to discover spatial nonstationarity in the home price-segregation relationship within metropolitan space. A subunit analysis may very well find the relationship between home prices and segregation that we have described to be the case only for neighborhoods with certain socioeconomic conditions or industry/urban development patterns or for residential spaces with specific racial compositions. These findings may expand our theoretical understanding of the role of compositional thresholds in neighborhood racial structure and the racial threat hypothesis on the temporal nature of segregation and home price.
Data availability is important to consider in future research because longitudinal data for home price variation is difficult to access and utilize. Within-metro studies demand price change data at the submetro scale, which is possible but time- and resource-intensive to collect through scraping and cleaning of county-level administrative records of parcel transactions (Molfino et al. 2017; Schachter and Besbris 2017; Weinberg 2015). Additionally, at such a small and interconnected scale, researchers should employ the use of spatial regression methods and theoretically informed spatial weights matrices. Such approaches could assess the role of theoretically relevant variable values in nearby tracts and account for possible spatial violations of ordinary least squares regression assumptions due to spatial autocorrelation in geospatial data.
Notwithstanding these limitations and opportunities for further study, our findings provide strong evidence that changes in metro-level home prices precede Black-White segregation levels. This is an important and salient point to consider as home prices soar to historic highs across the United States, suggesting continued or increasing segregation may soon follow.