
Abstract
Are associations between ratings of adolescents’ attractiveness and their adult health, cognitive functioning, and longevity plausibly causal, or are they confounded by factors correlated with judgements about attractiveness? How do these processes differ for women and men? Using data from the Wisconsin Longitudinal Study, the authors estimate the impact of judgements about adolescent facial attractiveness on 35 cognitive, health, and mortality outcomes through age 72. Ratings of adolescent facial attractiveness are predictive of later life outcomes among women, but mainly because ratings of young women’s attractiveness are closely connected with women’s socioeconomic standing and body mass in early life. The same is not true for men. People use different standards to evaluate the attractiveness of women and men; these differences induce largely noncausal associations between ratings of young women’s attractiveness and their cognition, morbidity, and mortality.
People routinely and critically evaluate the visible characteristics of other people’s bodies. In many cases—such as when consequential evaluations are based on skin tone, perceived ancestral origins, or perceived gender of the body—those judgements can intersect with cultural and political systems to support powerful structures of inequity and injustice (e.g., Eberhardt et al. 2006; King and Johnson 2016; Monk 2021a, 2021b). Other visible characteristics of bodies, such as height and weight, are also routinely and critically evaluated, often in ways that may affect socioeconomic and other life outcomes (e.g., Biener, Cawley, and Meyerhoefer 2018; Böckerman et al. 2019; Bossavie et al. 2017; Kim and Han 2017; Kim and von dem Knesebeck 2018).
An emerging strand of research has considered the impact of judgements about yet another visible characteristic of bodies—how beautiful or attractive their faces are—on social and economic outcomes like marriage prospects, wages, and occupational attainment (e.g., Deng, Li, and Zhou 2020; Gu and Ji 2019; Karraker, Sicinski, and Moynihan 2017; Monk, Esposito, and Lee 2021; Sala et al. 2013). A much smaller strand of research has estimated the impacts of how beautiful or attractive young people’s faces are judged to be on their subsequent morbidity and mortality outcomes (Henderson and Anglin 2003; Kalick et al. 1998; Kim 2014; Scholz and Sicinski 2015; Weeden and Sabini 2005).
Our goal is to expand and improve upon this body of scholarship on the effects of adolescent attractiveness on longevity and later life health and cognitive functioning. Although extant research is limited in crucial ways that we describe later, the conceptual premise that such effects may exist is sound. Isolating those effects, however, is complicated by the fact that in real life multiple characteristics of people’s bodies are viewed and judged simultaneously. Those judgements may be correlated with one another (e.g., such that in contemporary America heavier bodies may tend to be judged as less attractive) and may be biased by socioeconomic status, perceived intelligence, perceived healthiness, or other factors. As a result, identifying causal effects of attractiveness is challenging.
In this article we follow previous research by asking whether young people whose faces are judged to be more attractive tend to have better adult health, better adult cognitive functioning, and longer lives. We go beyond previous research by (1) focusing more carefully on whether those associations are plausibly causal or whether they may be confounded by factors correlated with judgements about facial attractiveness and (2) carefully considering whether and how these processes differ for women and men.
Ratings of attractiveness reflect cultural constructions of what counts as attractive and what does not; our ratings are discussed in detail in the data section of the article. Our goal in this study is to better understand whether people judged as attractive have better health and cognitive outcomes because of their perceived attractiveness alone or if attractiveness is merely acting as a proxy for other variables known to influence later life cognitive and physical health, namely, body weight and socioeconomic status.
Adolescent Attractiveness and Later Life Health and Mortality
There are two basic theoretical perspectives that support the premise that ratings of adolescents’ facial attractiveness are associated with their later life morbidity, cognition, and mortality. These theoretical perspectives each imply that we will see an empirical association between adolescent facial attractiveness and these outcomes. The perspectives differ, however, with respect to whether those associations are causal in nature.
First, from what we will call a beauty norm discrimination perspective, people with the power to allocate or withhold valued social and economic resources do so based in part on their judgements about other people’s attractiveness (e.g., Gu and Ji 2019; Mobius and Rosenblat 2006; Monk et al. 2021). People whose appearance fails to adhere to culturally defined beauty norms—either because their bodies simply differ from normative standards or because they do not or cannot afford to modify them in expected ways (e.g., through makeup, hair style, or fashionable clothing)—may be denied romantic affection, social network access, educational opportunities, job offers, salary increases, and other valued positions and resources. For example, Deng et al. (2020:1303) conducted a field experiment and found that “taste-based pure appearance discrimination exists at the pre-interview stage” in the Chinese labor market. Furthermore, those in power may inflict psychological distress upon those they judge to not meet cultural standards of beauty or attractiveness, thus exacerbating disparities between more and less attractive people (e.g., Gupta, Etcoff, and Jaeger, 2016).
Above and beyond discrimination based on skin color, sex, height, weight, and other bodily attributes, people whose appearance better adheres to dominant cultural beauty norms may enjoy social and economic advantages at key stages of the life course. From this perspective, attractiveness in adolescence has causal effects on subsequent social positions, economic rewards, and psychological well-being, which in turn shape health, cognition, and longevity. This perspective has dominated research on the impact of attractiveness on socioeconomic and psychological outcomes (e.g., Biddle and Hamermesh 1998; Deng et al. 2020; Gu and Ji 2019; Gupta et al. 2016; Jæger 2011; Liu and Sierminska 2014; Scholz and Sicinski 2015). Yet if facial attractiveness is mostly a reflection of one’s (or one’s parents’) ability to buy or otherwise obtain a culturally preferred look, then we may not be seeing the effects of facial attractiveness on later life outcomes so much as we are seeing ratings of attractiveness act as a proxy for socioeconomic status.
Second, and in sharp contrast, the mate selection perspective suggests that bodily (including facial) attractiveness is a signal of strength, healthiness, virility, and fertility and thus has a more biological basis (e.g., Gallup and Frederick 2010; Jæger 2011; Rhodes 2006; Singh and Singh 2011; Thornhill and Gangestad 1999). As Gallup and Frederick (2010) noted, “Features we find attractive in members of the opposite sex signal important underlying dimensions of health and reproductive viability” (p. 240). In support of this perspective, for example, Law Smith et al. (2006) found strong correlations between ratings of women’s facial attractiveness and their estrogen and progesterone levels, and Jokela (2009) found that adolescents who were viewed as more attractive went on to have more children. As reviewed by Gallup and Frederick (2010) and Thornhill and Gangestad (1999), there is also suggestive evidence of a positive relationship between men’s attractiveness and the quality of their sperm.
From this perspective, evaluations of the attractiveness of another person are really evaluations of the person’s desirability as a mate (in either the sexual sense or the long-term partnership sense). Furthermore, although norms about beauty differ across cultural contexts (Broer et al. 2014), those norms are to some unknown degree driven by mate selection processes and an evolutionary drive to reproduce (Grammer et al. 2003). From the mate selection perspective, it is not necessarily the degree to which a person’s appearance adheres to beauty norms that ultimately causally impacts (via discrimination) their later life morbidity, cognition, and mortality. Instead, factors such as early life healthiness, robustness, physical fitness, strength, and vitality—which are unconsciously the basis on which evaluations of attractiveness are founded—ultimately shape those outcomes. That is, the empirical association between ratings of attractiveness in adolescence and morbidity, cognition, and mortality later in life is mostly spurious, confounded by adolescent healthiness, robustness, and other proxies for being a good procreative partner.
Of course, both the beauty norm discrimination perspective and the mate selection perspective may have partial merit: attractiveness may be mostly a proxy for other factors such as wealth, healthiness, and/or virility and at the same time there may still be some discrimination against people whose appearance does not conform to prevailing beauty norms. If either perspective has merit, we expect to see that people who are rated as more attractive early in life enjoy better later life health and cognitive functioning and live longer.
As we describe later, estimating the degree to which those associations are causal in nature requires attention to the possibility that ratings of young people’s attractiveness are influenced by or are merely proxies for other factors that may themselves matter for later life well-being. The mate selection perspective would lead us to expect associations between facial attractiveness and later life outcomes to be partially confounded by indicators of healthiness and virility. However, it may also be that ratings of attractiveness are a proxy for other things—perhaps especially socioeconomic status and body mass—such that associations between attractiveness and subsequent outcomes are confounded by those attributes. If this is true, then neither the beauty norm discrimination nor the mate selection perspective may have merit; instead, it may be the case that ratings of attractiveness simply reflect other adolescent attributes that are known to have long-term health consequences.
Finally, associations between ratings of young people’s attractiveness and later life morbidity, cognition, and mortality likely work differently for women and men. From the beauty norm discrimination perspective, the societal penalties associated with having bodies that deviate from beauty norms may be more pervasive and more severe for women. From the mate selection perspective, the manner and degree to which attractiveness proxies for healthiness and virility and suitability as a mate may also differ for women and men. Likewise, the degree to which ratings of attractiveness serve as proxies for things, like socioeconomic status or body mass, may be different for women and men. For these reasons, we are attentive to gender differences in our analyses.
Current Evidence about the Association between Attractiveness and Health
Prior scholars have estimated the effects of adolescent attractiveness on later life health and mortality. Below we review the main research articles on this subject, describe their methodological limitations, and motivate the need for additional analyses.
In the earliest empirical work on this topic, Kalick et al. (1998) used longitudinal data on 164 male and 169 female (mostly working-class) residents of the Berkeley and Oakland, California, area to investigate the impact of young people’s facial attractiveness on medical professionals’ subsequent ratings of their overall healthiness. Using a model that adjusted for a measure of socioeconomic background, the authors found that baseline attractiveness did not predict doctors’ ratings of their healthiness in follow-up surveys for either women or men. Their longitudinal sample suffered from considerable attrition.
Henderson and Anglin (2003) had 20 undergraduate students view 50 yearbook photos from one high school in the 1920s; the students were asked to rate the healthiness and facial attractiveness of the person in each photo. The utility of those attractiveness ratings is potentially limited because the people doing the ratings came from a very different birth cohort than the people who they were asked to rate; the raters may thus have had different ideals of beauty and of healthiness. In any case, Henderson and Anglin then linked those attractiveness ratings to mortality records to ascertain longevity. Using a model that adjusted for no covariates, they found that ratings of facial attractiveness predicted longevity but that ratings of healthiness did not.
Three more recent studies have used data from the same cohort study that we use—the Wisconsin Longitudinal Study (WLS). The WLS, as we describe in more detail later, has followed a one-third random sample of the Wisconsin high school graduating class of 1957. In the mid-2000s, headshots from senior high school yearbooks were rated for facial attractiveness for 82% of the original cohort. Importantly, the individuals who did the rating were drawn from Wisconsin and from roughly the same birth cohort. First, Kim (2014) estimated the impact of ratings of facial attractiveness on mortality, self-assessed overall health, psychological distress, and a count of self-reported diseases decades later. Using models that controlled for family socioeconomic standing, IQ, religiosity, and personality, they found few effects on health outcomes; however, they did find that women who were rated more attractive lived longer. Unfortunately, their models inappropriately adjust for factors that are almost certainly mediators (e.g., midlife health behaviors), not confounders. It is thus difficult to discern the total estimated effects of facial attractiveness from their results. Second, Scholz and Sicinski (2015) likewise used WLS data to estimate the effects of adolescent facial attractiveness on longevity and self-assessed overall health from a model that adjusted for family socioeconomic background and IQ. They found no effects on either outcome. Third, Gupta et al. (2016) used WLS data to estimate the impact of facial attractiveness on psychological distress and well-being. Using a model that adjusted for midlife height and body mass index (BMI) and a measure of adolescent IQ, they found that people judged to be more attractive in adolescence had greater psychological well-being and less psychological distress in later life.
Although these articles have moved the field forward, they are severely limited in some important respects. First, only Kim (2014), Scholz and Sicinski (2015), and Gupta et al. (2016) used a large population-based sample. The external validity of the results of Kalick et al. (1998) and Henderson and Anglin (2003) is unclear. Like Kim et al., Scholz and Sicinski, and Gupta et al., we extend this field of study by using data from the WLS. The WLS cohort includes only high school graduates and almost all respondents are white: about two thirds of Americans in this cohort were white high school graduates (Herd, Carr, and Roan 2014).
Second, the ratings of facial attractiveness in the WLS were made by people in the same demographic group as the subjects of the ratings. If there are cohort differences in standards of attractiveness, then it is important to have raters be from similar birth cohorts as the people whose attractiveness is being rated. Although it is virtue of the WLS’s coding procedures that the evaluators came from the same state and birth cohort as the WLS graduates, it is a potential weakness that cultural norms of attractiveness may have changed in unknown ways between 1957 and the early 2000s. It is unclear how the coders’ ratings might have been different had they evaluated the photographs in 1957. Given that ratings were not done in the 1950s, we feel that this method represents a strong estimate of relative facial attractiveness in 1957. As discussed in the “Measures” section, the coders were trained and had rating scales developed from contemporary yearbook photos (Figure 1).
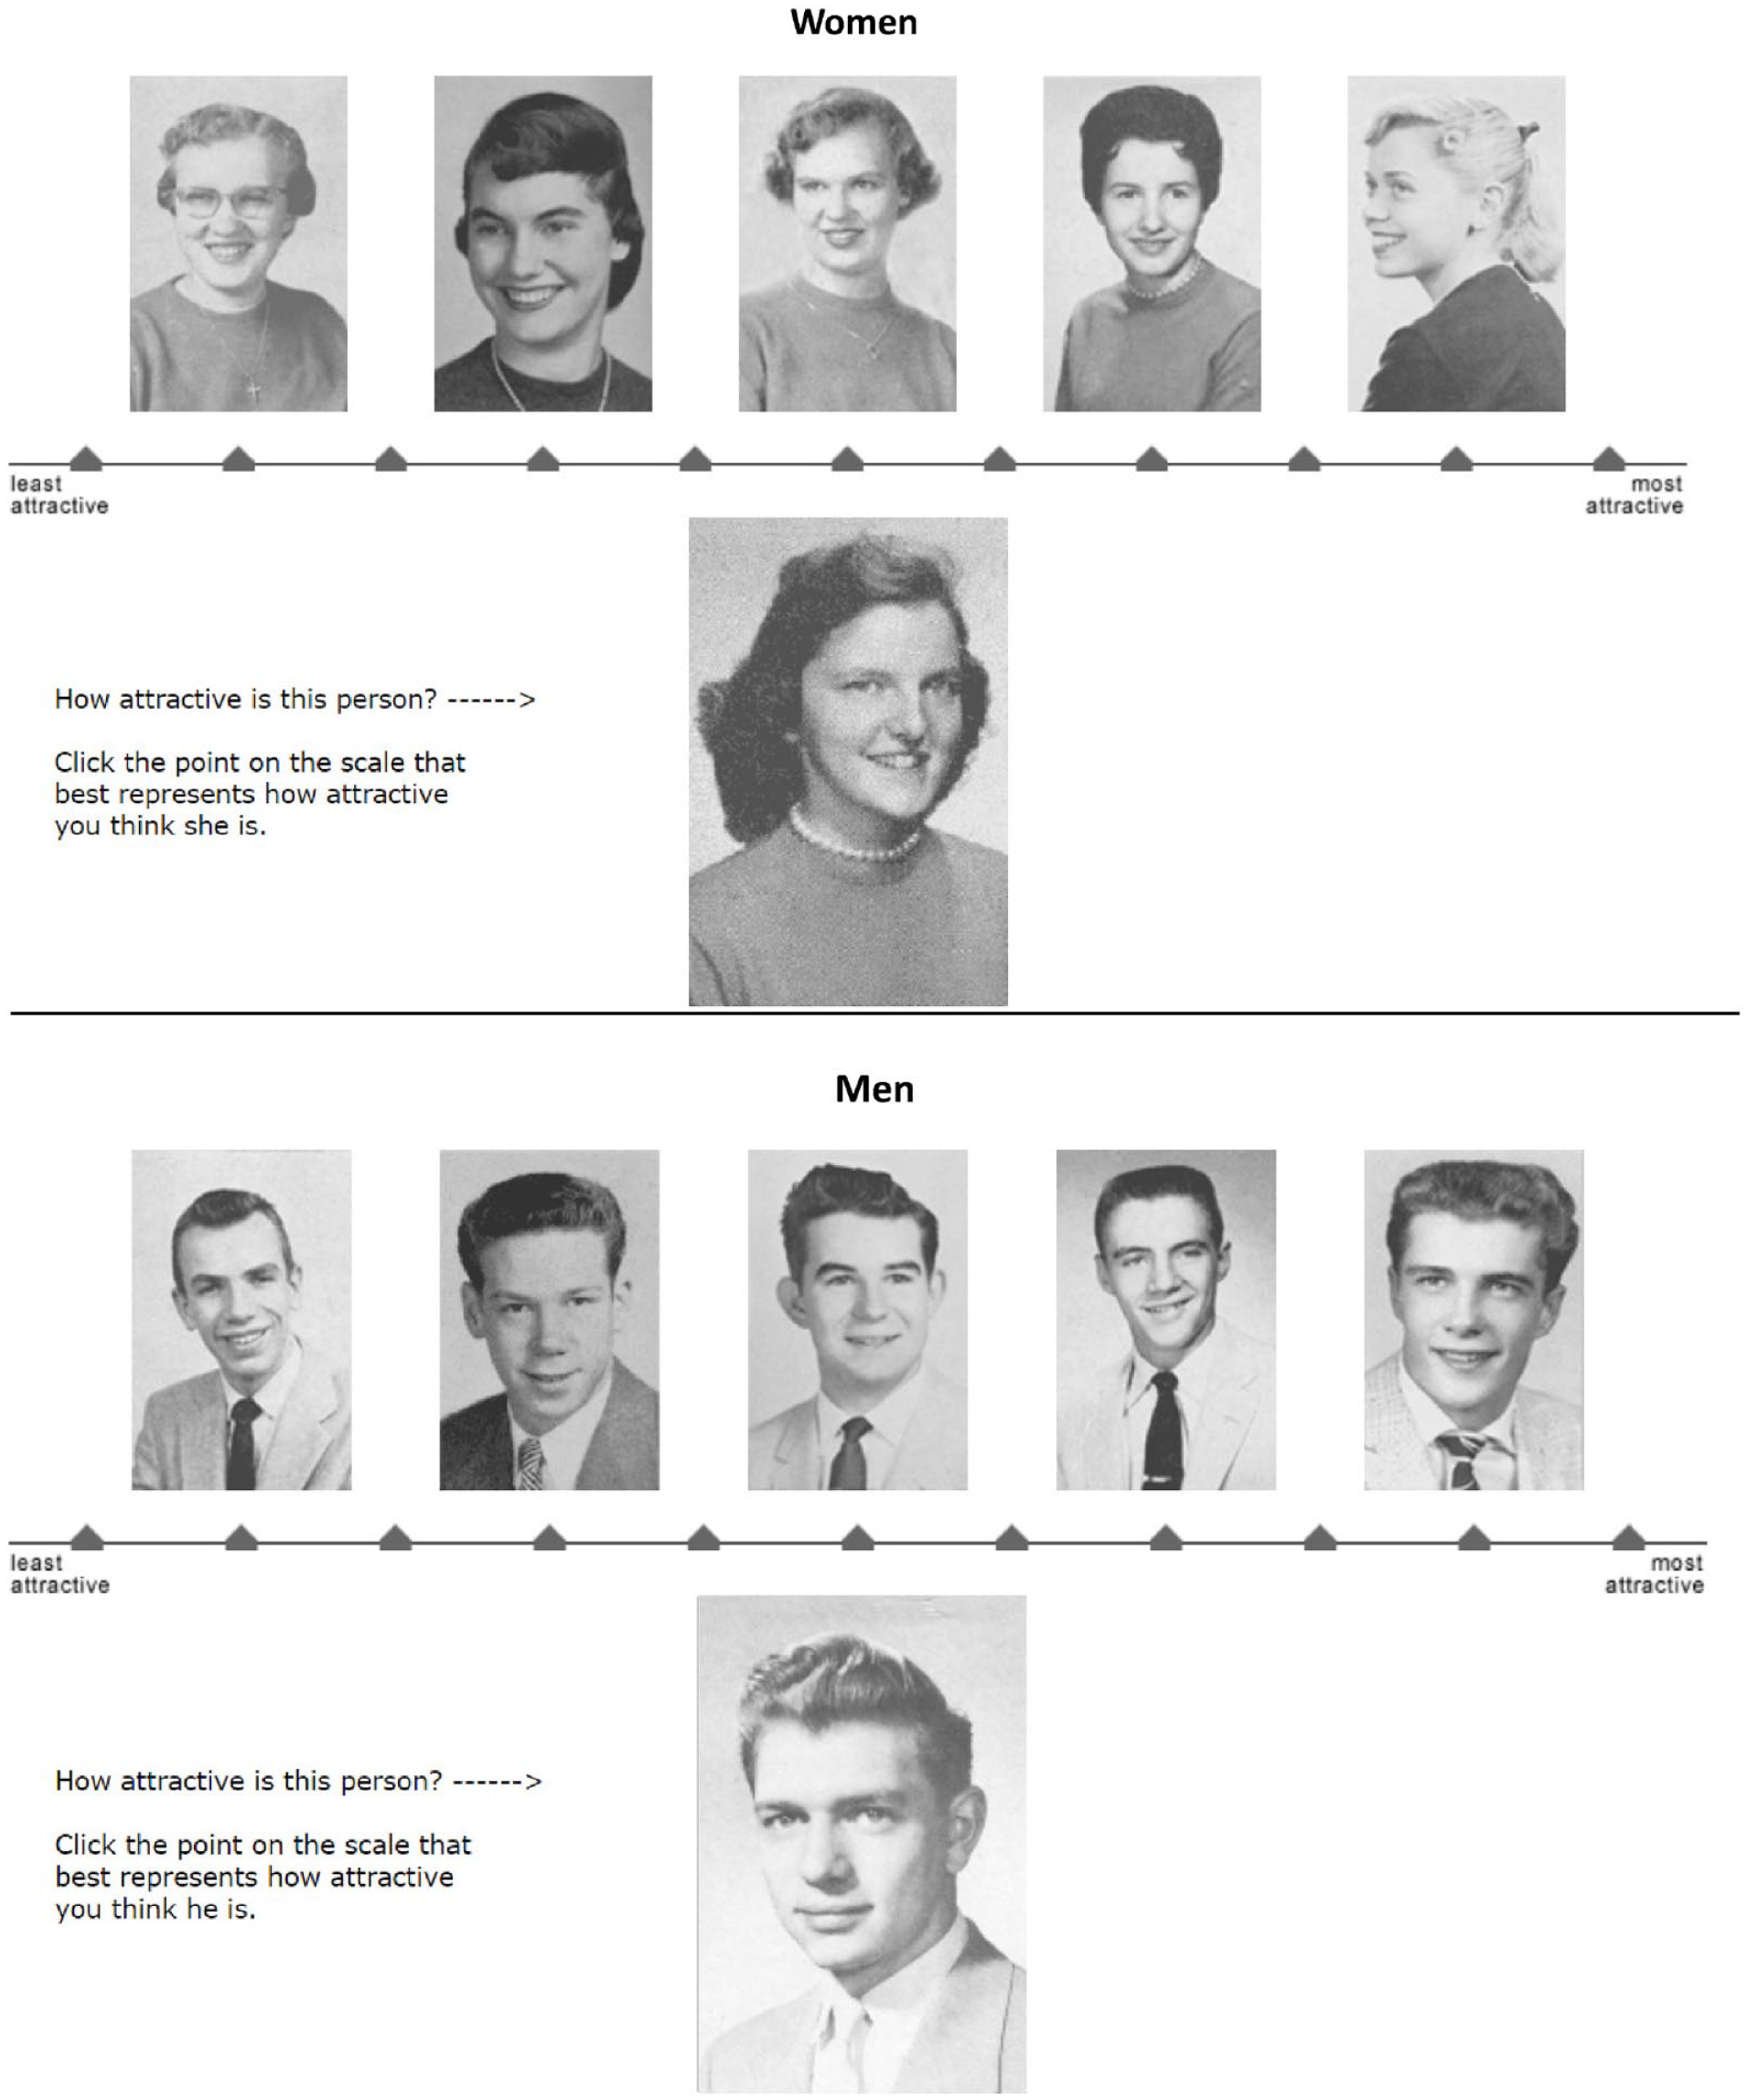
Wisconsin Longitudinal Study measure of adolescent facial attractiveness.
Third, none of these studies adjusted for an adequate set of confounding variables. As might be expected from the mate selection perspective—and as we show later—ratings of adolescents’ facial attractiveness are empirically correlated with adolescents’ relative body mass (RBM; Hume and Montgomerie 2001; Jæger 2011; Weeden and Sabini 2005), perceived healthiness (Foo, Simmons, and Rhodes 2017; Kalick et al. 1998; Shackelford and Larsen 1999; Weeden and Sabini 2005), family socioeconomic circumstances (Kalick et al. 1998), and intelligence (Langlois et al. 2000; Zebrowitz et al. 2002). None of these studies adjusted for adolescent health or body mass; only Kim (2014), Scholz and Sicinski (2015), and Gupta et al. (2016) adjusted for intelligence; and only Gupta et al. adjusted for adolescent socioeconomic standing. Our estimates, which adjust for all four, thus improve on our ability make inferences about the consequences of adolescent attractiveness.
Fourth, although many of the aforementioned studies analyzed sample data that include women and men, none gives adequate attention to gender differences. Scholz and Sicinski (2015) analyzed only data for men. Henderson and Anglin (2003) and Gupta et al. (2016) reported results only from “full sample” models that pool women and men and, thus, implicitly constrain the effects of facial attractiveness to be the same for women and men; they report no tests of the validity of this constraint. Kalick et al. (1998) and Kim (2014) estimated gender-specific models—thereby allowing the effects of adolescent attractiveness on health and mortality to differ for women and men—but they report no evidence about the statistical significance of differences in results across those models. In other words, none of the four studies performs formal statistical tests to support claims about gender differences or equivalencies in the effects of early life attractiveness. In our analyses, we estimate gender-specific effects and perform statistical tests to assess whether there are gender differences in the effects of early life attractiveness on later life morbidity and mortality.
Summary
Are societal judgements about people’s facial attractiveness—such as judgements about people based on their skin pigmentation, their sex, their height, and their conformity to norms about body size and shape—associated with people’s long-term health and longevity? If so, are these associations causal in nature—perhaps because of life-course-long biases against people judged to be less attractive? How do these processes differ for women and men?
Research Design
The WLS is a long-term study of a random sample of 10,317 men and women who graduated from Wisconsin high schools in 1957. WLS graduates were interviewed by telephone, mail, and/or in person in 1957, 1975, 1993, 2004, and 2011. The WLS graduate sample is broadly representative of white, non-Hispanic Americans who have completed at least a high school education, a group that includes about two-thirds of all Americans of this generation (Herd et al. 2014). Response rates to WLS have been remarkably high. In 1993, when most of the surviving graduates were age 53 or 54, 87 percent responded to the telephone survey and 71 percent responded to the mail survey. The corresponding response rates were 81 percent and 76 percent in 2004 and 72 percent and 65 percent in 2011. The largest source of survey nonresponse is mortality.
In the early 2000s, WLS staff members obtained 1957 high school yearbooks for 8,434 sample members (4,018 men, 4,416 women). As described later, two of our key measures, facial attractiveness and RBM, are derived from photographs in those yearbooks. Thus, our analytic sample is initially restricted to those 8,434 sample members (representing 82 percent of the full cohort of 10,317). All our cognitive and health outcome measures, except mortality, were ascertained in 2011 when sample members were about 72 years old. Consequently, our analytic sample is further restricted to the 4,905 sample members (2,264 men, 2,641 women) who responded to the 2011 survey.
Measures
Facial Attractiveness
Each yearbook photograph was rated by six men and six women using a photo-labeled, 11-point, gender-specific rating scale like the one depicted in Figure 1, with end points labeled as “least attractive” (1) and “most attractive” (11). The example photographs in Figure 1 were selected from non-WLS sample members in Madison, Wisconsin, area 1957 high school yearbooks. The choice and ranking of the example photographs followed psychometric methods for paired comparisons (Bock and Jones 1968; Torgerson 1958). Trained coders rated each WLS graduate in relation to the gender-specific 11-point rating scale. Coders were recruited between 2004 and 2008 from Wisconsin and from roughly the same birth cohort as the WLS graduates; judges ranged in age from 63 to 91 years (with a mean of 78.5 years) and were (like the cohort) almost all white. See Meland (2002) for details about how the coding system was developed, tested, and implemented.
To account for average differences in ratings across coders (i.e., one coder may average 5.5 on the 11-point scale, whereas another may average 6.0) we rescaled each coders’ rankings by subtracting the coder-specific mean from each score (e.g., such that −2 represents 2 points below average regardless of each coders’ average score). We then averaged across those 12 coders to construct our final measure of attractiveness (called “meanrat” in the WLS codebook). As shown in Table 1, the mean attractiveness score was 0.01. Men and women in the top and bottom quartiles of gender-specific attractiveness distributions averaged about −1.5 and +1.6, respectively.
Descriptive Statistics for All Measures, by Gender and Quartile of Attractiveness.

Note: The analytic sample is restricted to people who responded to the 2011 computer-assisted telephone interview survey and for whom attractiveness ratings of yearbook photographs are available. See text for more details. Avg = average; CES-D = Center for Epidemiologic Studies Depression Scale; HUI = Health Utilities Index; Max = maximum; Min = minimum; RBM = relative body mass; SF-12 = Short Form 12; WAIS = Wechsler Adult Intelligence Scale.
p < .05, **p < .01, and ***p < .001 for hypothesis tests about gender-specific differences in measures between those in the top 25 percent and those in the bottom 25 percent of the attractiveness scale.
Confounders
For reasons described earlier, to estimate the causal impact of early life facial attractiveness on later life morbidity and mortality, it is essential to statistically adjust for factors that may be correlated with ratings of attractiveness and may themselves impact later life health and longevity. In our analyses, these include adolescent RBM, height, childhood socioeconomic circumstances, adolescent IQ, and adolescent health. All are described in Table 1, separately for the full sample and for people in the top and bottom quartiles of the gender-specific distributions of facial attractiveness.
Adolescent RBM was measured in a manner much like facial attractiveness; see Figure 2 for the gender-specific rating scales. Between 2005 and 2008, the WLS team coded the senior yearbook photographs for RBM, which is a proxy for BMI. For every photograph, coders recorded an RBM score ranging from “not at all heavy” (1) to “extremely heavy” (11). To account for differences across coders in the mean and variance of ratings, we standardize ratings within coders before averaging across them (Reither 2004). As noted by Reither, Hauser, and Swallen (2009), “the RBM scale is reliable (α = .91) and meets several criteria of validity as a measure of body mass.” For example, it is correlated at r = .31 with BMI at ages 53 and 54 and at r = .48 with maximum BMI between ages 16 and 30.
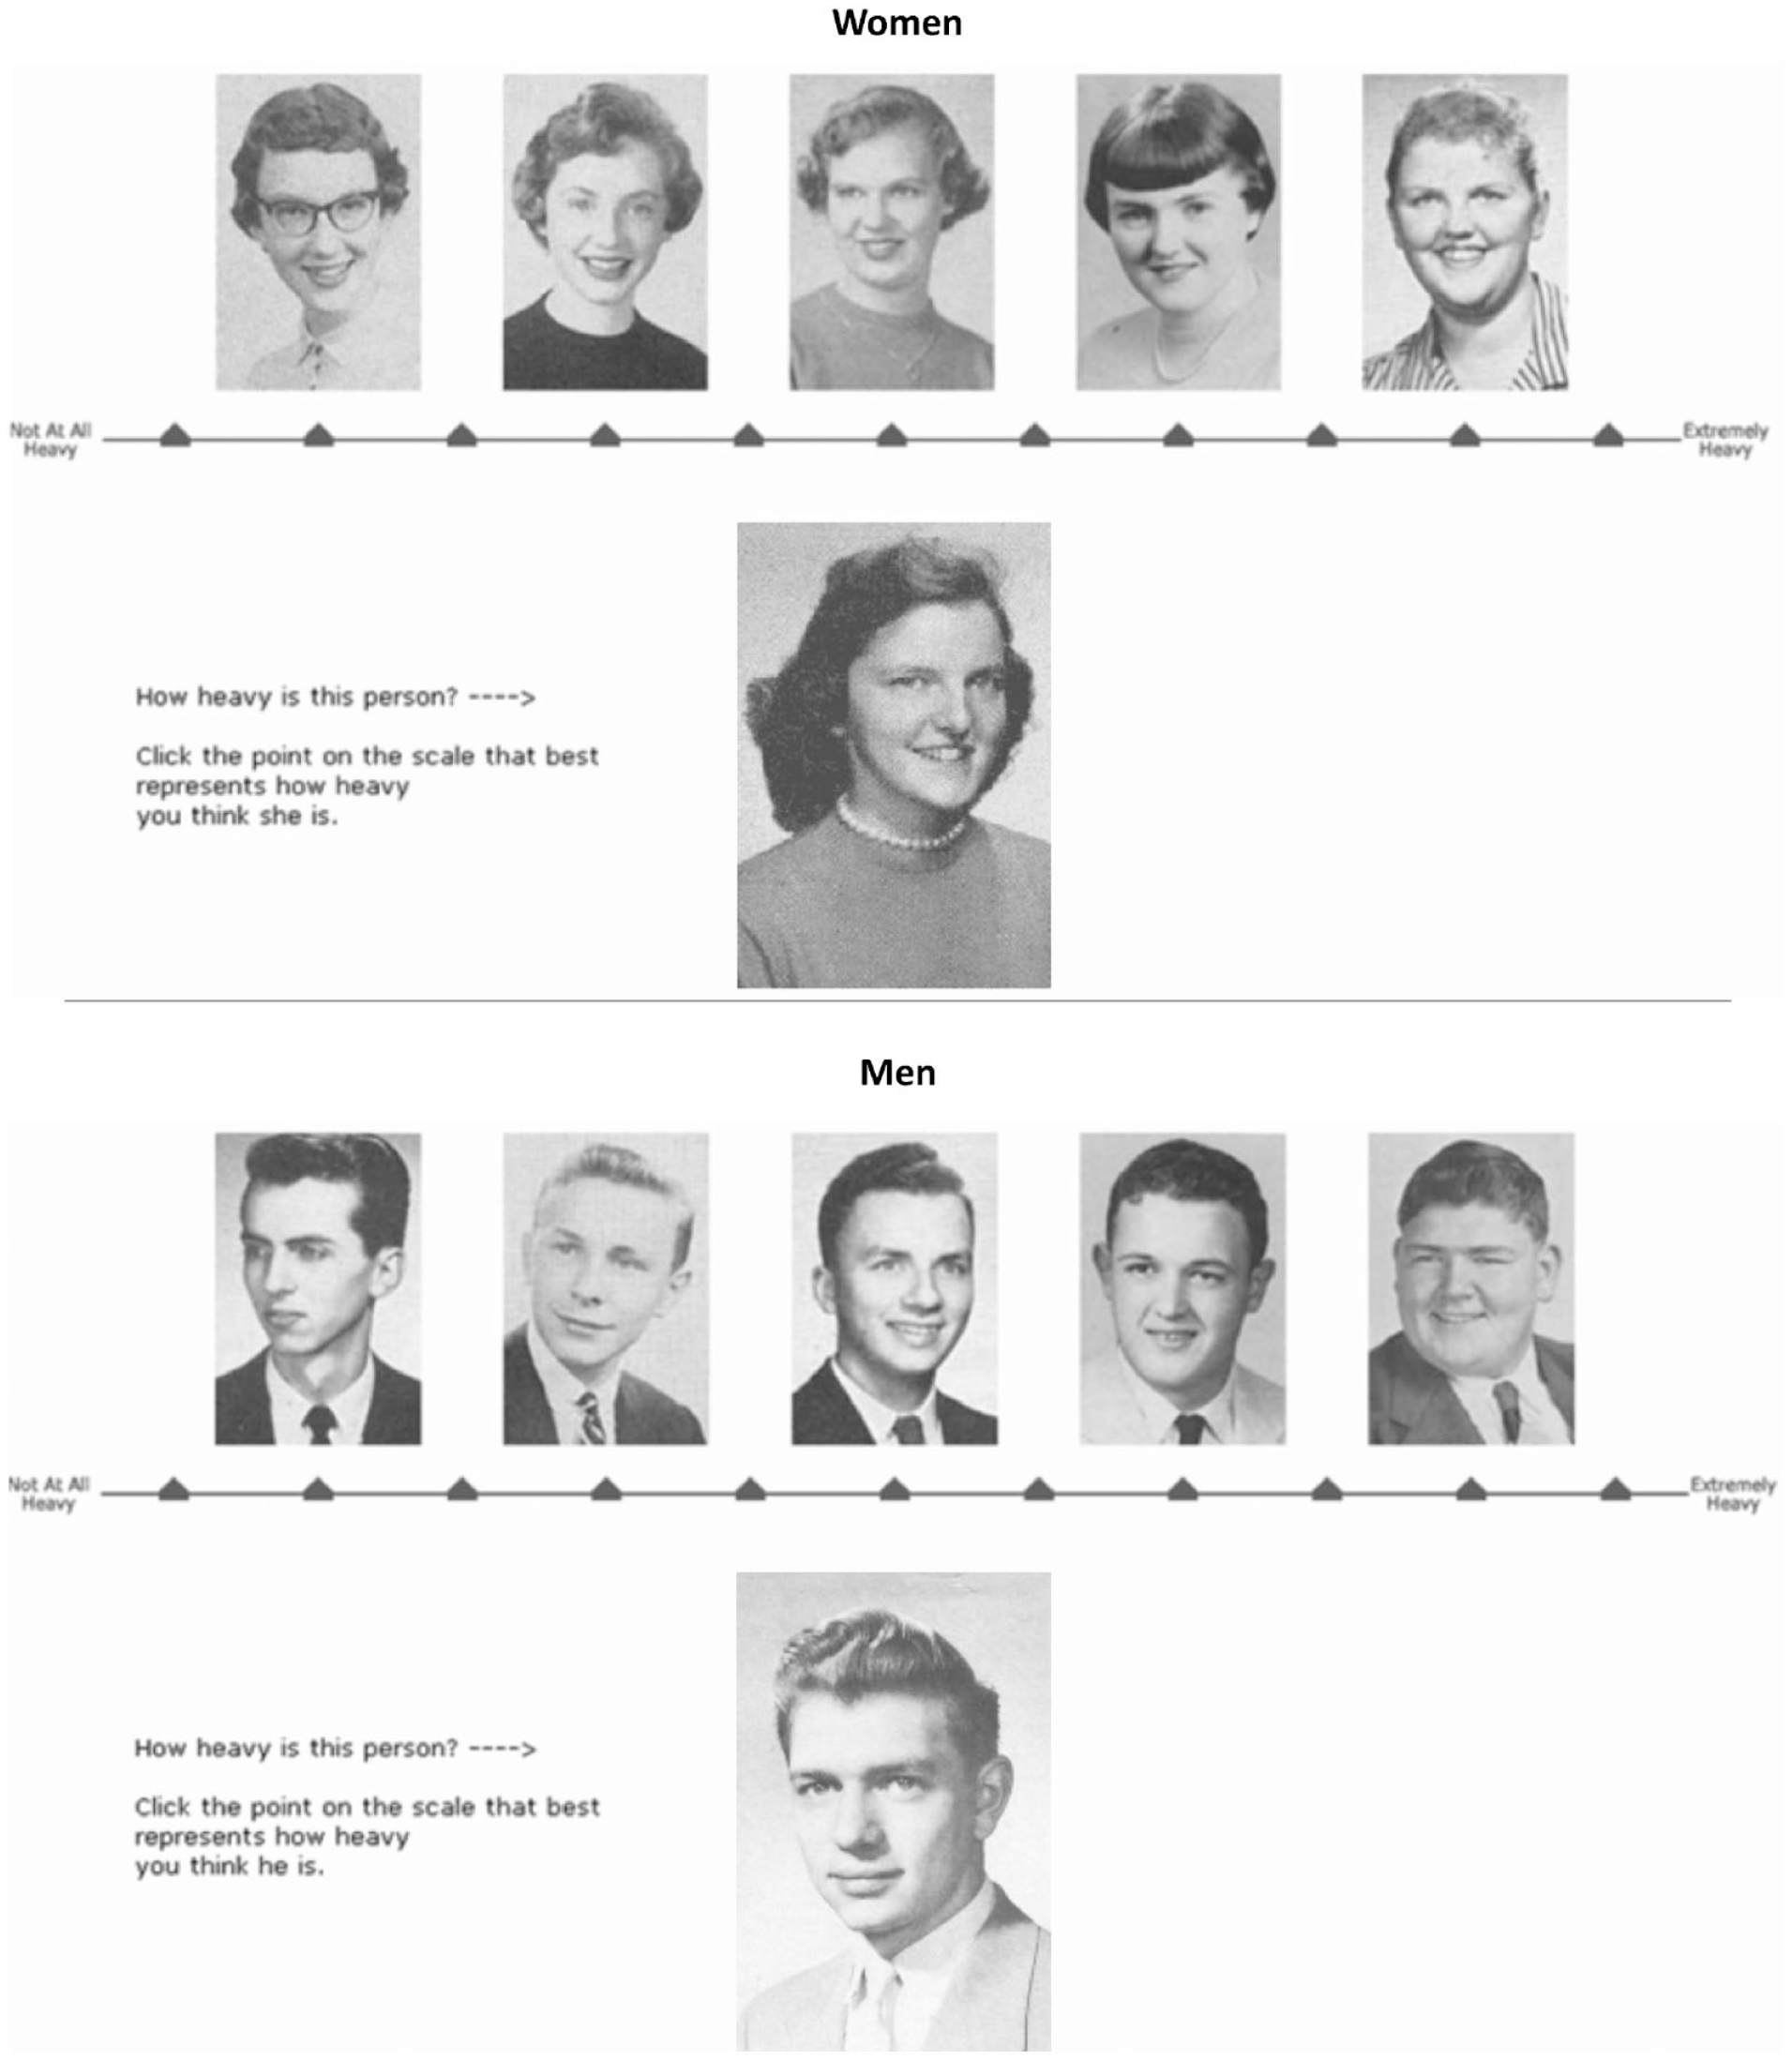
Wisconsin Longitudinal Study measure of adolescent body mass index.
Sample members’ height was self-reported in 1992 (at age 53). If it was unavailable from 1992, we use self-reported height in 2004 (at age 65) instead; if it was unavailable in both 1992 and 2004, we use the interviewer-measured height from 2011 (at age 72). Using heights from these later surveys is potentially problematic because people start to lose height after age 40 at an average rate of 1 cm per decade. This process is even more rapid, for most, after age 70.
Childhood socioeconomic circumstances were measured in 1957. We include indicators of sample members’ father’s occupation and family income, both from 1957 Wisconsin income tax records, and of their mother’s and father’s educational attainments. The latter were reported by sample members across various surveys and aggregated into a consensus measure.
Adolescent IQ, measured in high school using the Henmon-Nelson test of cognitive abilities, was ascertained from records of the Wisconsin State Testing Service. Using national norms by grade level for the Henmon-Nelson test as well as a renorming of raw scores for graduates for whom there were test scores in both the freshman and junior year, WLS staff members estimated junior-year raw scores on the Henmon-Nelson test for all of the graduates for whom any test score has been obtained. Finally, WLS staff members renormed the raw scores to a set of IQ equivalents, based on the percentile distribution of scores that were observed among all Wisconsin high school juniors in 1957. Thus, their norming of the Henmon-Nelson test scores does not depend on the obsolete concept of mental age used in the construction of Henmon-Nelson IQ scores.
Finally, adolescent health was measured retrospectively in the 2004 WLS using three sets of survey questions. First, self-assessed overall childhood health was measured using a survey question that asked, “How would you rate your health as a child?” Response options included “poor,” “fair,” “good,” “very good,” and “excellent.” Second, number of childhood illnesses was measured by summing the number of affirmative responses to 11 questions about whether graduates had asthma, frequent ear infections, a tonsillectomy or adenoidectomy, chronic bronchitis, whooping cough/pertussis, polio, diphtheria, hepatitis, pneumonia, meningitis, and infectious mononucleosis. Third, activity limitations in adolescence were measured by summing the number of affirmative responses to questions about whether graduates ever missed one month or more of school because of a health condition, were ever confined to bed for one month or more because of a health condition, or had their sports or physical activities restricted for three months or more because of a health condition. Prior evidence suggests that adults can retrospectively report childhood health conditions and related circumstances with a reasonable degree of reliability and validity (Haas 2007; Havari and Mazzonna 2015; Smith 2009).
Cognitive and Health Outcomes
We estimate separate models for a series of cognitive outcomes, measures of psychological well-being, anthropomorphic measures, self-reported physical health measures, and mortality. Except for mortality, which was assessed using administrative records from 1957 through 2017, all were measured at the time of the 2011 WLS.
Cognitive outcomes included a verbal fluency (letter F) measure (Lezak et al. 2004), a working memory (digit span) measure (Conway et al. 2005), immediate and delayed-recall tasks measuring memory and attention (Morris et al. 1989), abstract reasoning (Wechsler 1955), and a measure of inductive reasoning (using a number-series task; Lachman et al. 2014).
We included four measures of psychological well-being. First, a modified 20-item versions of the Center for Epidemiologic Studies Depression Scale expressed psychological distress and depression (Radloff 1977). Second, a seven-item anxiety index included questions such as “On how many days in the past week did you feel calm?” (Spielberger, Gorsuch, and Lushene 1970). Third, a seven-item anger index included questions such as “On how many days in the past week did you feel furious?” (Spielberger 1980). Finally, a three-item hostility index included questions such as “On how many days during the past week did you feel irritable, or likely to fight or argue?” (Spielberger 1988).
The 2011 in-person interview included a series of anthropomorphic measurements, including lung strength (using a peak flow meter), leg strength (using a chair rise task that timed how long it took graduates to rise from their chair into a standing position five times without using their arms), grip strength (using a dynamometer in their dominant hand), and walking speed (timed on a 2.5-m course while wearing shoes). Height and weight were also assessed; we include a measure of BMI as kilograms of weight per meters of height squared.
We estimated models predicting five sets of physical health outcomes. First, subjective overall health was measured twice: once by asking sample members, “In general, would you say your health is: excellent, very good, good, fair, or poor?” and once by asking a parallel question of interviewers about the sample member. Second, we use the Short Form 12 (Jenkinson et al. 1997), a well-validated assessment of general health and the impact of health on everyday life. Third, we use a self-reported measure of whether sample members had spent more than half a day in bed because of illness or injury in the preceding year. Fourth, we estimate separate models predicting whether sample members had ever been diagnosed with hypertension, high blood sugar, diabetes, cancer, heart disease, and a stroke. Finally, we model Health Utilities Index–Mark 3 scores that measure general health status and health-related quality of life (Horsman et al. 2003); we model the overall summary score and the vision, hearing, speech, ambulation, dexterity, emotion, cognition, and pain component scores.
Finally, we measure mortality and timing of death. WLS records are periodically linked to the National Death Index; the most recent data capture deaths between 1957 and 2017. We begin by modeling a dichotomous measure that expresses whether sample members were alive as of 2017. We then estimate Cox proportional hazard models to estimate impacts on timing of death (Cox 1972).
Analytic Approach
To assess whether young people who are judged to be less attractive tend to have worse adult health and shorter lives, we relied on careful consideration of the descriptive patterns in Table 1. To understand whether bivariate associations between attractiveness and our outcomes are causal in nature, we estimated a series of ordinary least squares regression models (for continuous outcomes), linear probability models (for binary outcomes), and event history models (for timing of death) that adjust for each of the confounders described earlier. We prefer linear probability models over logistic regression or probit models because they are easier to interpret; results from logistic regression models, which show substantively the same results, are available in the Appendix A.
All our models are estimated on pooled samples of women and men. We include interaction terms between all of our independent variables and gender; we then back out estimates of the effects of facial attractiveness for women and men separately and report the statistical significance of the interaction term between gender and facial attractiveness to inform our conclusion about whether the effect of attractiveness differs by gender.
As shown in Table 1, there is relatively little missing data on our confounding variables; we have no missing data on facial attractiveness (because of our sample selection criteria). To maximize sample size, we have imputed missing values on all confounding variables—but not on dependent variables—using chained equations as implemented in Stata’s ICE routine (Royston 2009; Royston and White 2011). We imputed 20 datasets. Also, to account for potentially selective patterns of nonresponse to the 2011 survey (from which we obtain most of our outcome measures), we construct and use in all multivariate analyses a poststratification weight; to construct the weight, we compute the inverse of the probability of responding in 2011 modeled as a function of gender and childhood socioeconomic background.
Results
All measures are described in Table 1, separately for the full sample and for women and men in the top 25 percent and bottom 25 percent of the gender-specific distributions of facial attractiveness; for ease of discussing Table 1, the top 25 percent will be referred to as the “attractive” and the bottom 25 percent will be referred to as the “unattractive.”
Among both women and men, the attractive and unattractive differ substantially and significantly with respect to all four measures of childhood socioeconomic circumstances. The attractive come from higher income families, better educated parents, and fathers with better jobs.
However, for the other potential confounders of the association between adolescent attractiveness and later life morbidity, cognition, and mortality—adolescent RBM, height, IQ, and adolescent health—Table 1 shows significant and sizable differences between attractive and unattractive women but not between attractive and unattractive men. For instance: Attractive women are almost a standard deviation lower in RBM than unattractive women; attractive and unattractive men have statistically equivalent RBMs. Attractive women’s IQ scores are about a quarter of a standard deviation higher than unattractive women’s IQ scores; there is no such difference among men. Attractive women were in better self-assessed overall health in adolescence than unattractive women; the same is not true among men.
In Figure 3 we explore this finding further. Separately for women and men, we report correlations (and 95 percent confidence intervals) between our measure of facial attractiveness and measures of RBM, selected measures of childhood socioeconomic circumstances, IQ, and selected measures of childhood health (specifically, the count of childhood illnesses). Facial attractiveness and childhood health are basically uncorrelated for both women and men. Facial attractiveness is positively and statistically significantly correlated with childhood socioeconomic circumstances and IQ; notably, those correlations are substantially larger—about twice as large—for women compared with men. Remarkably, whereas the correlation between facial attractiveness and RBM is essentially zero for men, it is significant and remarkably large (−0.34) among women. As we explore later, this basic empirical finding has important implications for our understanding of associations between adolescent facial attractiveness and later life health.

Correlations between facial attractiveness and adolescent body mass index, childhood socioeconomic status, IQ, and childhood health, by sex.
The next sections of Table 1 report descriptive statistics for our measures of cognitive, psychological, physical health, and mortality outcomes. For men, only two of these many measures (hostility, lung capacity, and leg strength)—about as many as we would expect by chance—differ significantly between attractive and unattractive men; if we applied a Bonferroni correction, none would achieve statistical significance. That is, at the bivariate level, male adolescents who are judged to be attractive fare no better (or worse) decades later than male adolescents who are judged to be unattractive.
In contrast, among women we see statistically significant and substantively meaningful differences on about half of outcomes between those judged to be attractive and those judged to be unattractive; most achieve significance even when applying a Bonferroni correction. For example, women judged to be attractive in adolescence do much better decades later on four of the six cognitive measures; they have lower levels of psychological distress; they have lower adult BMIs; they have better self-assessed overall health; they are less likely to report having been diagnosed with hypertension, high blood sugar, or diabetes; and they are less likely to be dead. In other words, adolescent facial attractiveness is predictive of a wide range of cognitive, health, and mortality outcomes—but only among women.
Are these associations between adolescent attractiveness and later life morbidity and mortality, at least for women, confounded by adolescent RBM, socioeconomic circumstances, health, and/or IQ?
In Table 2, we report the results of multivariate models that estimate the independent effect of adolescent facial attractiveness on cognition, psychological well-being, and anthropomorphic outcome measures net of the set of confounders described earlier and in Table 1. In Tables 3 and 4, we estimate similar models for self-reported health outcomes and mortality. In all three tables, we report estimated effects for women, estimated effects for men, and the significance of gender differences in those estimated effects.
Regressions of Cognitive, Psychological Well-Being, and Anthropomorphic Outcomes at Approximately Age 72 on Ratings of Facial Attractiveness at Approximately Age 18.
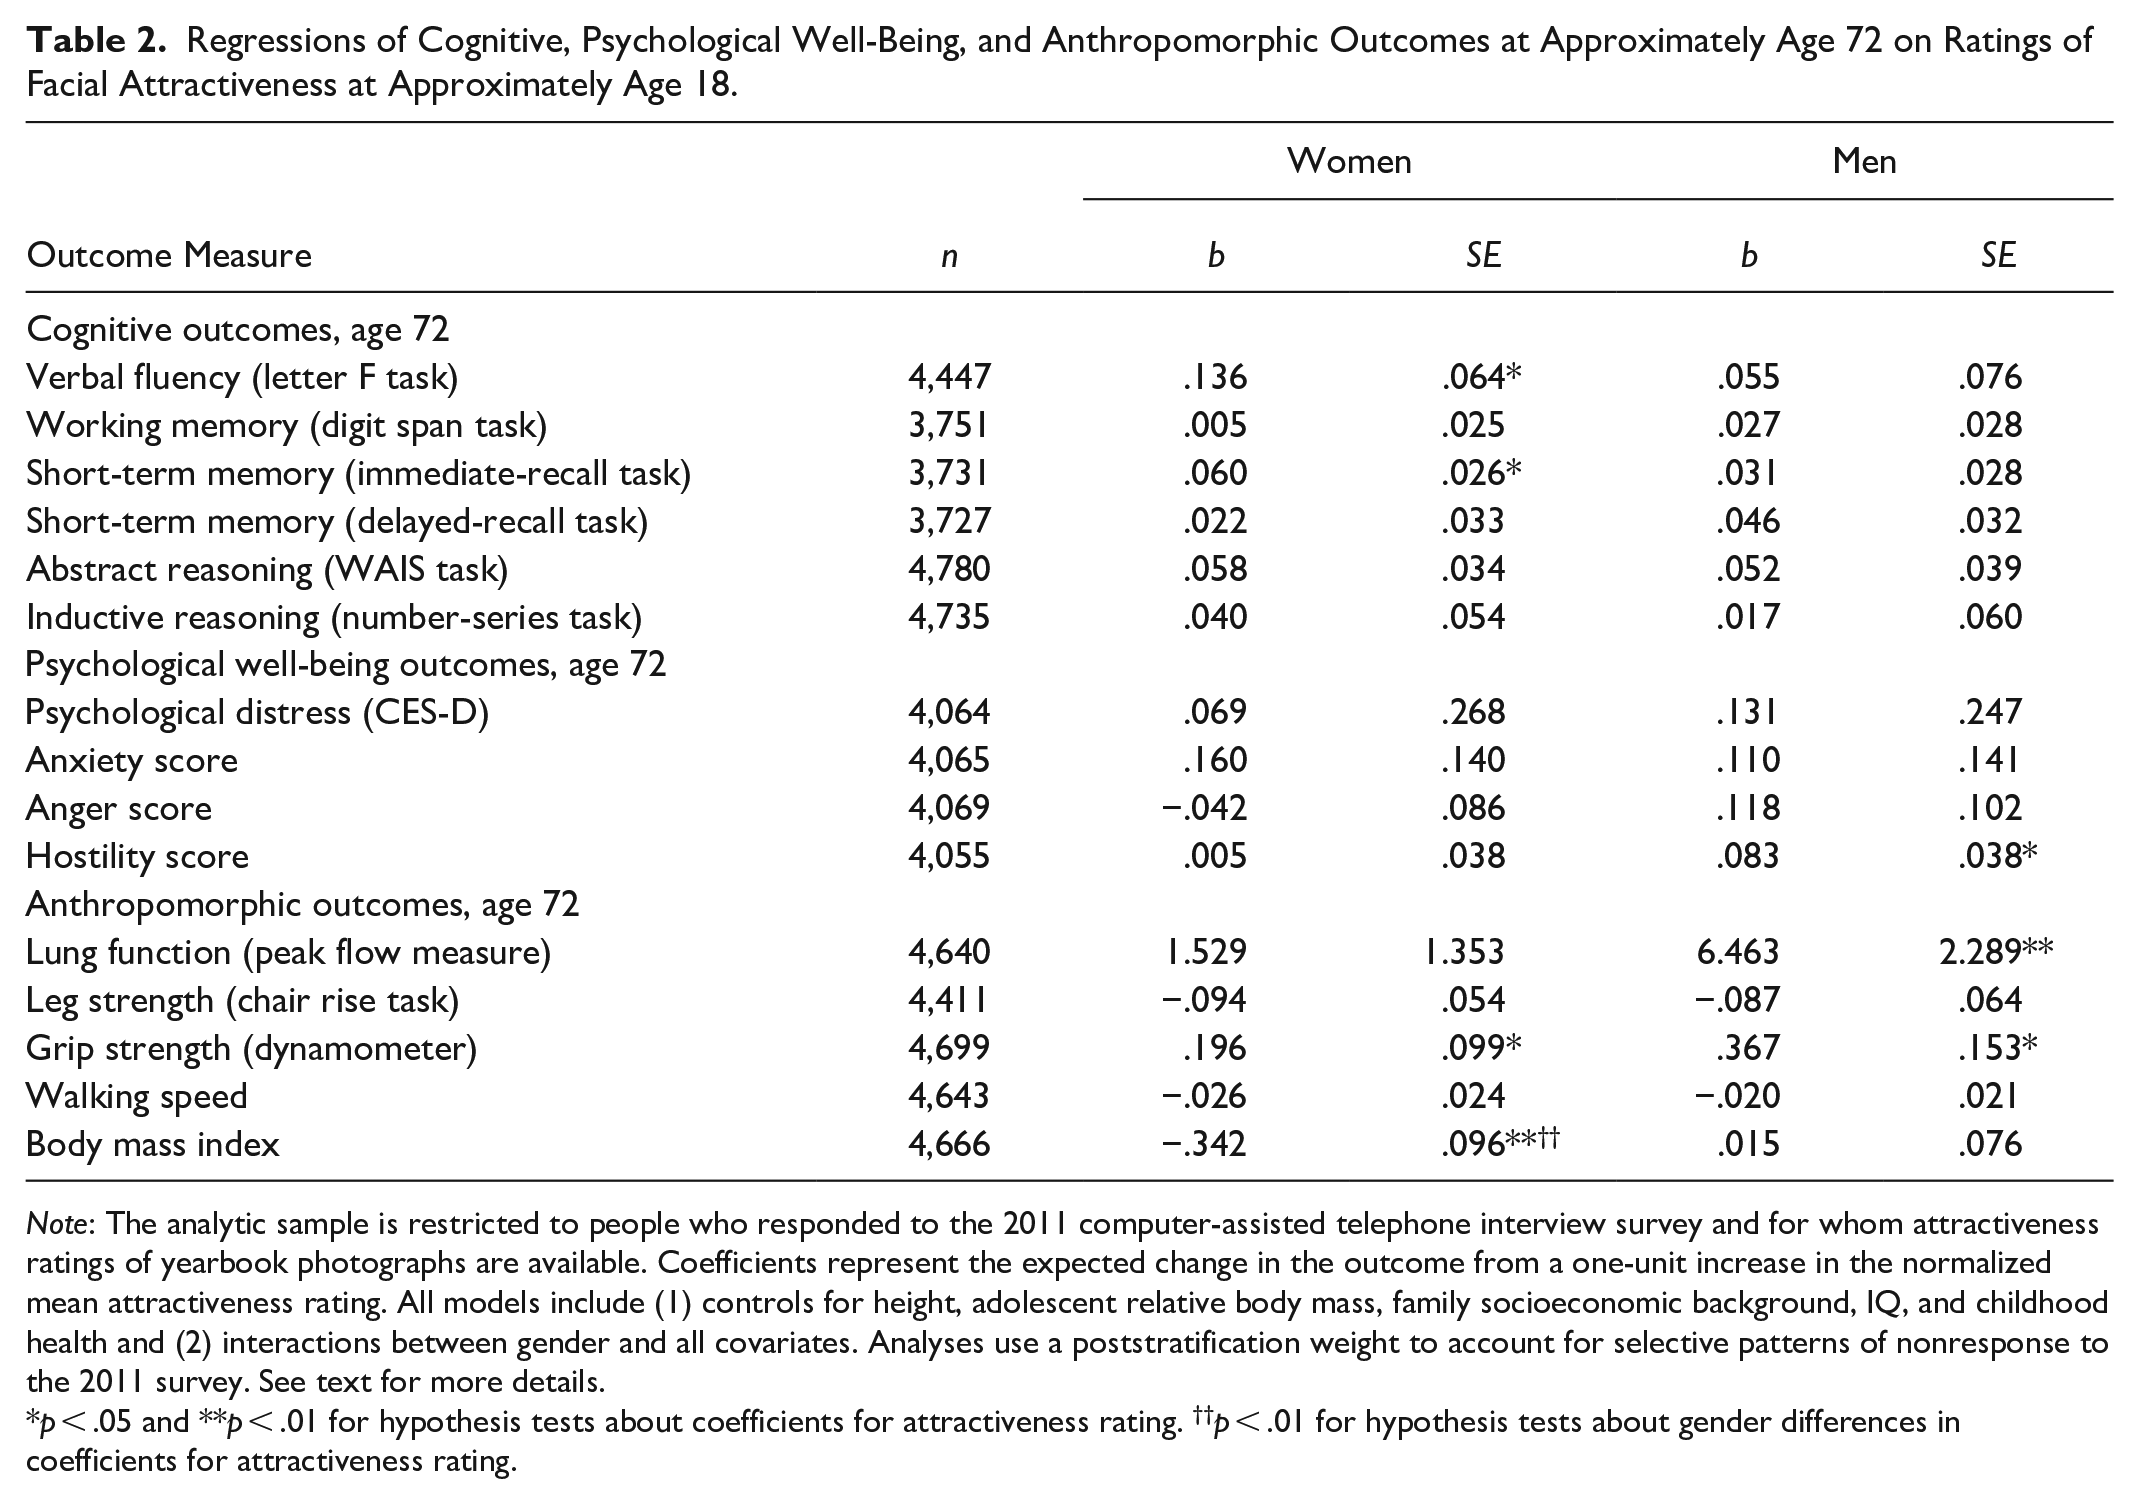
Note: The analytic sample is restricted to people who responded to the 2011 computer-assisted telephone interview survey and for whom attractiveness ratings of yearbook photographs are available. Coefficients represent the expected change in the outcome from a one-unit increase in the normalized mean attractiveness rating. All models include (1) controls for height, adolescent relative body mass, family socioeconomic background, IQ, and childhood health and (2) interactions between gender and all covariates. Analyses use a poststratification weight to account for selective patterns of nonresponse to the 2011 survey. See text for more details.
p < .05 and **p < .01 for hypothesis tests about coefficients for attractiveness rating. ††p < .01 for hypothesis tests about gender differences in coefficients for attractiveness rating.
Regressions of Physical Health and Mortality Outcomes at Approximately Age 72 on Ratings of Facial Attractiveness at Approximately Age 18.

Note: The analytic sample is restricted to people who responded to the 2011 computer-assisted telephone interview survey and for whom attractiveness ratings of yearbook photographs are available. Coefficients represent the expected change in the outcome from a one-unit increase in the normalized mean attractiveness rating. All models include (1) controls for height, adolescent relative body mass, family socioeconomic background, IQ, and childhood health and (2) interactions between gender and all covariates. Analyses use a poststratification weight to account for selective patterns of nonresponse to the 2011 survey. See text for more details. HUI = Health Utilities Index; SF-12 = Short Form 12.
p < .05 and **p < .01 for hypothesis tests about coefficients for attractiveness rating.
Regressions of Selected Morbidity and Mortality Outcomes at Approximately Age 72 on Ratings of Facial Attractiveness at Approximately Age 18, Net of Mediating Variables.

Note: The analytic sample is restricted to people who responded to the 2011 computer-assisted telephone interview survey and for whom attractiveness ratings of yearbook photographs are available. Coefficients represent the expected change in the outcome from a one-unit increase in the normalized mean attractiveness rating. All models include (1) controls for height, adolescent relative body mass, family socioeconomic background, IQ, and childhood health; (2) interactions between gender and all covariates; and (3) mediators, including education and midlife socioeconomic status, family history, health behaviors, and psychological measures. Analyses use a poststratification weight to account for selective patterns of nonresponse to the 2011 survey. See text for more details. HUI = Health Utilities Index.
p < .05 and **p < .01 for hypothesis tests about coefficients for attractiveness rating. †p < .0.5 and ††p < .01 for hypothesis tests about gender differences in coefficients for attractiveness rating (in unmediated model).
Among men, Tables 2 through 4 show that (net of confounders) adolescent facial attractiveness is significantly associated with just four of 35 outcomes. For two of the four—the hostility scale and self-reported stroke—more attractive men had worse outcomes. Thus, for only two outcomes—lung function and grip strength—did we observe that men rated as attractive in adolescence enjoyed better health outcomes (all else equal) in later life. Only the coefficient for grip strength is statistically significant if we apply a Bonferroni correction. However, for these two outcomes the implied effect sizes are very small (with a full standard deviation increase in attractiveness leading to increases in lung function and grip strength of about 1/16th and 1/19th of a standard deviation, respectively). In short, for men we found little descriptive evidence in Table 1 that adolescent attractiveness was associated at the bivariate level with our outcomes; net of confounders, we find virtually no evidence of meaningful effects of adolescent attractiveness on men’s morbidity or mortality.
Among women, Tables 2 through 4 tell a somewhat different story. For 11 of the 35 outcomes, women rated as more attractive in adolescence enjoyed better cognitive, health, and mortality outcomes (all else equal). Net of confounders, more attractive women had better short-term memory; better verbal fluency; lower BMIs; better grip strength; less hypertension, high blood sugar, and diabetes; better HUI speech and ambulation scores; and lower rates of mortality. However, in contrast to the descriptive results in Table 1, (1) only one coefficient is statistically significant if we apply a Bonferroni correction, and (2) many of the implied effects sizes for women are modest. The lone exception—and the lone statistically significant result if we apply a Bonferroni correction—is that a 1 standard deviation increase in adolescent attractiveness is associated with a reduction in women’s BMI at age 72 (all else equal, including adolescent RBM). For only two outcomes—BMI at age 72 and self-reported high blood sugar—do our models suggest that (all else equal) the effects of adolescent attractiveness on these outcomes are statistically significantly different for women and men.
In short, we find limited evidence of independent effects of adolescent attractiveness on cognitive, health, and mortality outcomes among women; those effects are generally small in magnitude, at least compared with the descriptive results in Table 1. This suggests that the associations we observe among women in Table 1 are mainly spurious, confounded by factors such as adolescent health, adolescent RBM, and IQ. We find almost no evidence that adolescent attractiveness affects men’s later life cognitive, health, or mortality outcomes.
Discussion
We investigated the long-term cognitive, health, and mortality consequences of people’s evaluations of how attractive other people’s faces are judged to be. These evaluations can have profound consequences for the individuals whose bodies are being evaluated, especially when those evaluations are connected to social, cultural, or political systems of racism, sexism, or ablism.
We went beyond previous research by (1) focusing more carefully on whether associations between ratings of facial attractiveness and life outcomes are plausibly causal or whether they may be confounded by factors correlated with judgements about attractiveness and (2) by carefully considering how each of these processes differ for women and men.
At the outset we discussed two theoretical perspectives that suggest we might expect to find a correlation between facial attractiveness in adolescence and later life cognitive and health outcomes. From the beauty norm discrimination perspective—the idea that associations between adolescent attractiveness and later life health and well-being are due to lifelong patterns of discrimination against people whose appearance does not meet conventional standards of beauty and attractiveness—we expect that associations between adolescent attractiveness and later life outcomes should be at least partly causal. Through various discriminatory processes, those judged to be less attractive experience negative social and economic consequences; those consequences have negative long-term implications for health and well-being. We found little empirical support for this perspective, especially among men.
We also have reason to be skeptical that the second theoretical perspective, the mate selection perspective, explains why more attractive (female) adolescents had better health and cognitive outcomes decades later. For one thing, the correlations between ratings of attractiveness and things like healthiness, intelligence, and socioeconomic resources in Figure 3 were small in magnitude, especially among men. If attractiveness is a proxy for attributes upon which people base mate selection decisions, it is (empirically speaking) not a very good proxy.
We suspect that what is going on has more to do with (1) gendered differences in cultural expectations of attractiveness and the cost of buying that attractiveness and (2) gendered differences in the nature and size of biases against overweight or obese people. First, we suspect that men are less able and perhaps less motivated to buy culturally defined beauty. Whereas men in this cohort wore similar clothes and had similar hairstyles (see Figures 1 and 2), women’s fashion and hairstyles were more variable and more expressive—and thus more amenable to improvement through spending money.
Second, RBM may mean different things for young men and women. Among men, it is perhaps difficult to distinguish obesity from muscularity in a facial photograph; few women are visibly muscular, and so nonthin women are more likely than nonthin men to be perceived to be overweight. We also suspect that people evaluating attractiveness may more harshly penalize heavier women in their ratings than they do heavier men. This would explain the very strong correlation between RBM and adolescent facial attractiveness among women and the nonexistence of that correlation among men. Because adolescent obesity is predictive of later life health problems, and because ratings of attractiveness are so closely tied to weight among women, we should neither be surprised at gender differences in the bivariate associations shown in Table 1 nor by the attenuation of those associations in Tables 2 and 3.
Our first main conclusion, then, as illustrated in Figure 3, is that when people evaluate women’s facial attractiveness, they also (at least implicitly) consider women’s socioeconomic status and their RBM. In contrast, when they evaluate men’s physical attractiveness, they consider men’s socioeconomic status—although not to the same degree as for women—but not their weight. Apparently, what raters evaluate when they look at women’s faces differs from what they evaluate when they look at men’s faces.
The standard that people use when evaluating young men’s attractiveness is modestly correlated with their socioeconomic circumstances: advantaged men tend to be judged more attractive, perhaps because they are able to purchase somewhat more fashionable clothes, afford better haircuts or dental care, or otherwise pay for style. However, ratings of adolescent men’s facial attractiveness do not depend on their intelligence, their healthiness, or their weight; the latter may have to do with the fact that it is difficult to discern a very muscular man from an overweight man in a facial photograph. A man can be heavier, less intelligent, or less healthy and ratings of his facial attractiveness will not suffer.
In contrast, the standard that people use when evaluating young women’s facial attractiveness is more highly correlated with those things, especially RBM. Women who are judged to be more attractive tend to come from socioeconomically advantaged families, but they also tend to have lower RBM. Heavier women are judged to be less attractive. Although we do not formally test this idea in our analyses, we speculate that socioeconomic status may ultimately drive many of these patterns. Adolescent intelligence, weight, and healthiness are all influenced by childhood family socioeconomic status; advantaged families can use their resources for improved nutrition, better educational opportunities and experiences, better pediatric medical and dental care, and health-inducing recreational activities. We also speculate that gender differences in the correlations between attractiveness and socioeconomic status may be related to differential investments in young boys and young girls in this era, especially in families with constrained resources.
These findings about how people differentially rate the attractiveness of men’s and women’s faces is fundamentally interesting, but it also has major implications for our main research objective: especially for women, bivariate associations between ratings of adolescent facial attractiveness and any health or mortality outcome later in life are confounded by factors such as early life health, IQ, family socioeconomic standing, and, especially, body weight. As we reviewed earlier, prior research on the impact of adolescent attractiveness on subsequent health and well-being has not adequately accounted or adjusted for these confounders; their results are thus of questionable validity, especially as they pertain to women.
Our second main conclusion is that associations between ratings of adolescent facial attractiveness and later life health and cognition are mostly nonexistent among men and mostly spurious among women. In our descriptive analyses, we see sizable and statistically significant associations between ratings of adolescent facial attractiveness and many cognitive, health, and mortality outcomes later in life, but only for women. When we adjust for childhood socioeconomic status, adolescent body mass, adolescent health, and intelligence, we observe that among women those associations are considerably attenuated and smaller in magnitude. Ratings of adolescent attractiveness have little or no causal impact on later life health and mortality, and then only among women. This basic conclusion stands in sharp contrast to earlier research, even using WLS data; those prior findings were driven by their failure to adjust adequately for the confounding roles of factors associated with ratings of women’s facial attractiveness.
Four limitations of our analyses are worth noting. First, our data include no high school dropouts; thus, the generalizability of our conclusions is somewhat limited. Second, because our data are from a predominantly racially white state—and because whites were overrepresented among high school graduates in this place and time—we can say nothing about how any of these processes work among people racialized as Black and Latine or other groups. Third, it is not ideal that ratings of attractiveness happened so many years after 1957. Although it is a virtue that we rely on ratings by people from the same state and birth cohort, it is a possible weakness that beauty norms may have changed in ways that altered our findings. In the end, the virtues of our data outweigh their limitations, but we encourage others to collect and analyze data that overcome these shortcomings. Fourth, there may have been some selective mortality prior to 2011 such that those who survived until that year exhibit different relationships between predictor and outcome variables.
We conclude that ratings of adolescent facial attractiveness have little causal impact on later life health, mortality, or cognition; any causal effects are small in magnitude and seen only among women. Our analyses point instead to the pervasiveness of gender differences in the nature and bases of beauty norms. The structure and functioning of these beauty norms induce largely spurious correlations between adolescent attractiveness and later life outcomes.
Footnotes
Appendix
Logistic Regressions of Physical Health Outcomes at Approximately Age 72 on Ratings of Facial Attractiveness at Approximately Age 18.

| Women | Men | ||||
|---|---|---|---|---|---|
| Outcome Measure | n | exp(b) | SE | exp(b) | SE |
| Other physical health outcomes, age 72 | |||||
| Self-assessed overall health | 4,904 | 1.025 | .033 | 1.055 | .036 |
| Interviewer-assessed overall health | 4,799 | 1.050 | .033 | 1.039 | .036 |
| Hypertension (self-reported) | 4,897 | .919 | .033* | .998 | .036 |
| High blood sugar (self-reported) | 4,886 | .898 | .042* † | 1.026 | .040 |
| Diabetes (self-reported) | 4,894 | .874 | .046** | .989 | .044 |
| Cancer (self-reported) | 4,898 | 1.049 | .042 | 1.000 | .044 |
| Heart disease (self-reported) | 4,894 | .955 | .042 | .986 | .038 |
| Stroke (self-reported) | 4,895 | 1.039 | .074 | 1.166 | .072* |
Note: The analytic sample is restricted to people who responded to the 2011 computer-assisted telephone interview survey and for whom attractiveness ratings of yearbook photographs are available. Coefficients represent the expected change in the outcome from a one-unit increase in the normalized mean attractiveness rating. All models include (1) controls for height, adolescent relative body mass, family socioeconomic background, IQ, and childhood health and (2) interactions between gender and all covariates. Analyses use a poststratification weight to account for selective patterns of nonresponse to the 2011 survey. See text for more details.
p < .05 and **p < .01 for hypothesis tests about coefficients for attractiveness rating. †p < .05 for hypothesis tests about gender differences in coefficients for attractiveness rating.
Acknowledgements
This article was prepared for presentation at the 2021 meetings of the American Sociological Association. Generous support for this project has been provided by the Minnesota Population Center, which receives core funding (P2C HD041023) from the Eunice Kennedy Shriver National Institute for Child Health and Human Development. We sincerely thank Joe Savard, Kamil Sicinski, and Carol Roan at the WLS for help with technical support and Katie Berry, Eric Grodsky, Jonas Helgertz, and several anonymous reviewers for useful feedback. However, errors and omissions are our responsibility.