
Abstract
The implicit association test (IAT) is designed to reduce socially desirable responses and capture implicit associations between two social categories. Prior work has used and expanded on the IAT to capture implicit status beliefs, but tests of the specific images and words used to denote status and gender are lacking. Here, the authors (1) identify specific images to best elicit implicit stereotypical gender differentiation, (2) identify specific words to best distinguish relative status, and (3) assess the test-retest reliability of a full and a brief gender status IAT. First, the authors find that images presented in grayscale, rather than images presented in color, best elicit implicit gender categorization. The authors also identify five male and five female images that best elicit implicit stereotypical gender categorization. Second, the findings show that status words and evaluation words load on unique factors (highlighting that the status words are not merely capturing evaluations), and the authors identify five specific words that best distinguish implicit relative status. Third, the authors find that the standard long-form IAT has a more acceptable test-retest reliability than the brief IAT. The authors conclude with suggestions on how to further refine the measure and how it might be applied in research.
Gender inequalities are documented in many domains. Female-dominated activities and occupations, for example, remain culturally devalued and underpaid compared with male-dominated occupations (Dwyer 2013; England 1992; Kilbourne et al. 1994). This trend persists despite the rising number of women in male-dominated fields (England 2010; England, Levine, and Mishel 2020) and merit-based achievements such as higher college completion rates and grade point averages (DiPrete and Buchmann 2006; Quadlin 2018). Both macro (Kanter 1977; Risman 2018; Williams 1992) and micro (Ridgeway 1997, 2009; West and Zimmerman 1987) explanations for gender inequality play a role. At the micro-level, individuals automatically gender-categorize others on the basis of their appearance (Fiske 1992; Ridgeway 1997; West and Zimmerman 1987). Automatic gender categorization elicits status beliefs about the relative worth and competence of an individual on the basis of their gender, leading to gender inequality during interactions (Berger et al. 1977; Ridgeway 1991, 1997).
One mechanism maintaining gender stratification is status processes (Ridgeway 2014). Status characteristics theory (SCT; Berger et al. 1977; Correll and Ridgeway 2003) posits that, in collective task groups, status differences lead to differential expectations of competence that favor those of higher status. If an individual perceives another as a member of a specific gender, they will treat them as if they are a member of that category. Gender is one category that individuals will automatically categorize other group members on the basis of physical presentation (Fiske 1992; Ridgeway 1997; West and Zimmerman 1987). For example, if one person perceives another individual as a woman, meaning that the individual presents in a way considered stereotypically feminine, one will automatically categorize that individual as a woman and implicitly activate gender status beliefs about women. The differential expectations of competence and worth (i.e., expectation states; Berger et al. 1977; Ridgeway and Correll 2006) that stem from states of status characteristics are the causal mechanism that lead to, and maintain, inequality during social interactions. SCT also highlights the importance of status beliefs (i.e., broad cultural beliefs about a nominal characteristic; Ridgeway 2018) as a factor in the development of expectation states. Therefore, it is important to accurately measure status beliefs to better understand their impact on individual behavior and perceptions.
Status beliefs are broad cultural beliefs that associate greater levels of competence and social worth with states of categorical distinctions (Ridgeway 2018). Traditional gender status beliefs, for example, associate competence and worth with men (Pugh and Wahrman 1983). These beliefs are not assumed to be conscious, but guide behavior “as if” they are (Berger et al. 1977). Status beliefs are typically measured using explicit questionnaire items (e.g., Rashotte and Webster 2005; Thye 2000; Zeller and Warnecke 1973), which are still routinely used in research (Webster and Walker 2022). These questionnaire items capture individuals’ beliefs related to differences in competence and social worth between two groups that differ on some nominal characteristic (e.g., gender). Although these measurement items are still used in sociological research, they do suffer from the potential for social desirability bias, even if participants hold beliefs that one group is more competent or socially worthy than another, they may not be willing to tell the researchers. Similarly, subtle forms of bias are outside of conscious awareness, implying that participants may not even be aware of their biases (Swim and Cohen 1997). A recent alternative to directly measuring status beliefs is to use response latencies from sorting images of category members and words that denote status. Melamed et al. (2019, 2020) developed a racial status implicit association test (IAT) that shows promise for measuring racial status beliefs. Here we develop and evaluate a gender status IAT.
Generally, the IAT (Greenwald, McGhee, and Schwartz 1998) and the brief IAT (BIAT; Sriram and Greenwald 2009) are intended to measure the strength of automatic associations between concept(s) (e.g., gender and status) while reducing social desirability biases (Greenwald et al. 1998; Sriram and Greenwald 2009). Participants sort evaluative words to differentiated images or names, while the response latencies provide a measurement of the implicit evaluative beliefs of the target concept (e.g., gender). For example, prior IAT research has identified implicit associations of men with mathematics (Nosek, Banaji, and Greenwald 2002b). Improvements have been made to the psychometric properties associated with aggregating response latencies into a measure of bias (Greenwald, Nosek, and Banaji 2003; Nosek, Greenwald, and Banaji 2005). Additionally, prior work has identified that the specific stimuli in the IAT can influence an individual’s implicit biases (Bluemke and Friese 2006), indicating that further testing of the individual stimuli in the IAT is needed. Traditional IATs focus on evaluative words (e.g., good and bad) as opposed to words that indicate status differences (e.g., competence and social worth). Although there have been critiques and questions about what concepts the traditional IAT measures, and its ability to measure those concepts (Arkes and Tetlock 2004; Gawronski, Brownstein, and Madva 2022; Gawronski, Ledgerwood, and Eastwick 2022; Kurdi et al. 2019; Payne, Vuletich, and Lundberg 2017), research still highlights that the measurement tool has potential for capturing biases that individuals are unwilling to openly state in explicit measures (Gawronski, Ledgerwood, et al. 2022; Melamed et al. 2019, 2020).
In this work we develop the measurement of the gender status IAT by identifying images and words used to distinguish gender and status, respectively, and assesses the test-retest reliability of our gender status IAT and BIAT. In study 1 we determine whether an image presented in grayscale, as is customary (Nosek, Banaji, and Greenwald 2002), or in color better elicits gender differentiation. Additionally in study 1, using a crowdsourced sample, we seek to identify an optimal subset of images that best evoke implicit gender differentiation. In study 2 we identify the optimal subset of words that implicitly distinguish status from mere positive and negative evaluations. Again, we use a crowdsourced sample to identify these status words that best elicit implicit distinctions between words that denote competence and social worth (i.e., status) and positive and negative evaluations (i.e., valence). In study 3 we examine the test-retest reliabilities of our newly developed gender status IAT and BIAT. We use student panel data to determine these reliabilities of the standard long-form IAT and the BIAT. Collectively, the three studies refine a novel gender status measure. We conclude with directions for further research.
Theoretical Background
Status Characteristics, Processes, and Beliefs
Status characteristics are attributes with widely held cultural beliefs attaching greater worth and competence to one category than another (Berger et al. 1977). Status generalization is the process by which status distinctions become salient during, and influence qualities of, social interactions (Webster and Driskell 1978). The widely held cultural beliefs surrounding a status characteristic (e.g., gender stereotypes) transfer to beliefs about specific individuals with specific states of the status characteristic. For example, in collective task groups, the gender stereotype that men are more competent and worthy than women leads to individuals behaving as if female group members are not as competent as male group members, resulting in the female group members’ contributions being undervalued or ignored. This generalization occurs when the status characteristic is salient and happens regardless of no objective gender differences in task competence (Berger et al. 1977).
As mentioned above, for a status characteristic to influence behavioral outcomes, the characteristic must be salient. Status characteristics become salient during interactions when they differentiate group members. For example, in a mixed-sex group, individuals will automatically categorize fellow group members on the basis of gender presentation (Fiske 1992; Ridgeway 1997; West and Zimmerman 1987). Once individuals have automatically categorized their fellow group members, they call upon cultural assumptions of competence and worth (i.e., status beliefs) to understand the group’s hierarchy.
For our purposes, it is important to distinguish among three forms of status beliefs: first-order, second-order, and generalized second-order beliefs. First-order beliefs are those personally held by an individual. Second-order beliefs are those that an individual believes a specific other personally holds. Generalized second-order beliefs (Mize 2019) are those that an individual believes most other people hold. These status beliefs may exist below conscious awareness (Rashotte and Webster 2005) and relate to assessments of an individual’s competence and social worth. It is important to accurately capture these status beliefs because they often explain inequality in outcomes on the basis of social category membership (Ridgeway 2018).
Traditional measures for these various forms of status beliefs include explicit questionnaire items. For example, prior research on gender status beliefs tends to use explicit questionnaire measures to capture perceptions of competence and social worth (Dippong 2015; Rashotte and Webster 2005; Thébaud 2015). Although these traditional questionnaire items have been shown to be good predictors of behavior (Rashotte and Webster 2005; Thye 2000; Zeller and Warnecke 1973), they may suffer from social desirability bias and researchers using these measures attempt to control for this issue (Rashotte and Webster 2005). The IAT is designed to reduce social desirability biases rather than to control for them (Greenwald et al. 1998; Sriram and Greenwald 2009).
Recently, Melamed et al. (2019) adapted an IAT to measure racial status beliefs, which the authors suggested are first-order status beliefs. The IAT relies on response latencies rather than questionnaire items. Individuals are asked to sort images of people from different groups while also sorting high- and low-status words. Sorting images of individuals allows the measurement of the automatic categorization process. If an individual automatically categorizes a group member as a man, that individual will call upon gender stereotypes to form beliefs of competence and worth. These status beliefs lead to expectations that favor the behavior and beliefs of high status group members. The ability to better measure these automatic processes allows a greater understanding of the connection between status and forms of gender inequality. To better measure this process, the images that an individual sees must elicit automatic gender categorization. Considering the relative success of the IAT, and the fact that it is relatively unobtrusive, we developed a gender status IAT on the basis of stereotypical masculine and feminine gender presentation that measures the implicit status beliefs toward men and women. Below we describe the mechanics of IATs in general, and then we describe the specifics of our measure.
The IAT and the BIAT
The IAT was developed to measure the strength of automatic associations between two paired concepts (e.g., gender and math ability) and reduce socially desirable responses by asking participants to sort items as quickly as possible (Greenwald et al. 1998; Greenwald and Nosek 2001). For example, the gender-math IAT (Nosek et al. 2002b) is designed to identify the strength of the stereotypic association between men and presumed math ability and women and presumed arts ability. The racial status IAT (Melamed et al. 2019) is designed to identify implicit status beliefs of white individuals compared with black individuals. An individual who is faster at sorting one characteristic than another to a concept illustrates an implicit association between the two concepts. For example, if an individual is faster at sorting images of men to high-status words, that individual implicitly associates men with high status. The association between concepts is assumed to be nonconscious (as is explicitly stated in SCT), yet the design of the IAT allows researchers to capture these implicit cognitive associations.
Prior research developing status IATs has suggested that the IAT measures first-order status beliefs (Melamed et al. 2019). However, other researchers suggest that individuals are drawing on broader cultural beliefs that are captured by the IAT (Arkes and Tetlock 2004; Payne et al. 2017). These broader cultural beliefs are related to generalized second-order status beliefs (i.e., beliefs that an individual believes “most other people think”). Whether a status IAT captures first or generalized second-order status beliefs, the measurement tool still has promise at capturing status beliefs that affect individual interactions and behaviors, from a bottom-up perspective, and broader trends, from a top-down perspective. First-order status beliefs may directly influence an individual’s behavior when interacting with another individual of a particular social group. These micro-level interactions can have rippling effects that result in macro-level trends (Grow, Flache, and Wittek 2017; Ridgeway and Erickson 2000). For example, if an individual exhibits hiring preferences based on an applicant’s gender, we will see broader societal trends in gendered division of labor. Generalized second-order status beliefs work from the top down. If the broad cultural stereotype is that men are more competent than women, we will see these stereotypes manifest during interactions by shaping an individual’s expectations of their group members (Correll and Ridgeway 2003; Ridgeway 2018). An IAT designed to capture these status beliefs, whether first or generalized second order, provides the opportunity to better understand behaviors at the micro-level and broader trends at the macro-level.
IATs instruct participants to quickly press computer keys to pair evaluative words (e.g., high or low status) to a target concept (e.g., men or women). The pairing of concepts takes place in trials that are divided into phases. In a standard long-form IAT (Greenwald et al. 2003), there are 20 trials in each of the practice phases and 40 trials in the two test phases. During a trial, a participant is asked to use the “e” and “i” keys to pair evaluative words with images or words depicting a social category. The images and words in a trial are randomized and phase order ensures that participants pair both categories with both types of evaluative words.
The BIAT is a shortened version of the long-form IAT and is designed to capture the same implicit associations (Sriram and Greenwald 2009). Participants in a BIAT still pair items using the “e” and “i” keys; however, the focal category of a BIAT will always appear on the right-hand side. For example, the focal category for a BIAT could be high status, and all pairings for high status will be completed using the right hand (i.e., using the “i” key) with all other pairings completed using the left hand. Where the long-form IAT consists of seven phases (Greenwald et al. 2003), the BIAT only consists of four (Sriram and Greenwald 2009). As with the long-form IAT, the response latencies between focal categories (e.g., high status and men and high status and women) are compared with identify the implicit associations between high status and states of gender.
Improvements have been made to the algorithms used to aggregate the response latencies (Greenwald et al. 2003; Nosek et al. 2005), and researchers have created new versions of the IAT (Sriram and Greenwald 2009). However, as the IAT continues to be refined and used as a measurement tool to capture cognitive biases (Melamed et al. 2019, 2020; Greenwald et al. 2022), we believe it is important to identify specific items used in IATs that best represent the underlying concepts the IAT is designed to capture. Prior IATs intended to uncover implicit gender or race associations present gendered and racialized names rather than images (Dasgupta and Asgari 2004; McConnell and Leibold 2001; Nosek et al. 2002b; Rudman and Ashmore 2007; van Ravenzwaaij, van der Maas, and Wagenmakers 2011). Using gendered names allows researchers to avoid using images that some participants may not automatically gender categorize. However, not all names can be easily gender categorized (e.g., Taylor or Jayden), and face-to-face interactions that initiate automatic gendered categorization are based on physical appearance and gender presentation (West and Zimmerman 1987). Therefore, we believe it is important for gender status IATs to present images and to determine which photographs best elicit implicit gender categorization.
Previous status IATs present images on the basis of Nosek et al.’s (2002a) original image presentation. Images are presented in grayscale, cropped just above the eyebrows and between the upper and lower lips and cropped to exclude the ears. This technique is used to frame the face of the individual in the photograph. Although this is the standard image presentation, whether certain color formats and specific images best elicit implicit status beliefs has yet to be identified. Prior research has indicated a need for researchers to formally test image presentation in IATs; however, these studies have focused on images’ color formatting for studies that focus on racial categorization (Smith-McLallen et al. 2006; Stepanova and Strube 2009, 2012). The importance of testing images relates to the automatic categorization process. Individuals automatically gender-categorize group members (Ridgeway 1997; West and Zimmerman 1987); images in a gender status IAT need to elicit this automatic gender categorization to capture the implicit gendered beliefs of competence and worth. However, some of these categorizations are easier than others (Doan, Quadlin, and Powell 2019). Therefore, we create a gender status IAT on the basis of stereotypical masculine and feminine gender presentations.
Typically, the IAT uses a variety of valence words (i.e., words that denote good and bad evaluations; Greenwald et al. 1998) or leader and supporter words (e.g., assertive and compassionate; Dasgupta and Asgari 2004) that tend to highlight associations between demographic characteristics and assumptions of ambition and determination. We choose to use a set of words that are not used in traditional IATs but instead used to determine whether a demographic characteristic has status value. Therefore, we use words that have been used in status questionnaires (Rashotte and Webster 2005; Thye 2000; Zeller and Warnecke 1973) rather than the valence or leader and supporter words used in other IATs. Status IATs use words that have previously been established to capture beliefs about competence and worth of an individual or group (Melamed et al. 2019). That being said, critiques of the status IAT focus on the meaning of the words (Bursell and Olsson 2020) and potential redundancy between IATs designed to capture attitudes (i.e., valence IATs) and IATs designed to capture stereotypes (i.e., beliefs IATs; Kurdi et al. 2019). These discussions and critiques of the traditional IAT and its variations warrants further testing of the words used in the IAT that determine whether the IAT is capturing mere valence or status beliefs. It is important to distinguish status (i.e., competence and worth) from mere evaluations (i.e., good and bad). Status often entails an evaluation (e.g., it is better to be competent or worthy than incompetent or unworthy), but prior research has demonstrated that status words hold a distinctly different meaning from mere evaluations (Melamed et al. 2020). Because of these recent discussions, it is necessary to identify the status words that best elicit meanings of competence and worth.
Given the prior research on image presentation (Smith-McLallen et al. 2006; Stepanova and Strube 2009, 2012) and the automatic categorization of people in group settings (Fiske 1992; Ridgeway 1997; Turner and Tajfel 1986), and recent work suggesting that status beliefs can be measured with an IAT (Melamed et al. 2019, 2020), in this work we develop and evaluate a gender status IAT. More specifically, we identify whether grayscale or color images best elicit implicit gender categorization. We also present a specific set of images that best evoke implicit stereotypical gender categorization (study 1). In addition to identifying a set of images, we also identify a specific set of words that best differentiate between status and evaluation (study 2). Finally, we assess the test-retest reliability of the gender status IAT and BIAT (study 3).
Study 1
Participants
We used Prolific, an online crowdsourcing platform, to recruit 499 participants, who were each paid $1.50. Prolific is a crowdsourcing platform that has responded to concerns about data quality on other crowdsourcing platforms (i.e., Amazon Mechanical Turk). The sample was 68 percent white, 8 percent black, 12 percent Asian, and 5 percent Hispanic; 7 percent identified other races. The sample was 56 percent female, with an average age of 36 years. We measured education on a seven-item ordered scale ranging from less than a high school degree to a doctorate/professional degree. On average, respondents had attained slightly higher than an associate’s degree. Income was measured as a continuous variable, with respondents’ income averaging about $53,000 per year. We measured political alignment on a six-point scale ranging from “very conservative” to “very liberal.” On average, respondents identified between “slightly liberal” and “liberal.” Finally, we asked respondents to report the number of IATs they have previously completed using an ordinal scale; on average, respondents previously completed between one, and two or three IATs.
Overview
In study 1 we assess whether images presented in grayscale or color better evoke implicit gender differentiation; additionally, this study identifies a subset of specific images that best elicit implicit gender differentiation. The images used in study 1 are based on individuals with stereotypical masculine and feminine gender presentations. On the basis of these images, in study 1 we can identify only images that individuals implicitly categorize as stereotypically masculine or feminine. It is important to identify the images that elicit gender differentiation due to the automatic categorization process. During interactions, individuals automatically gender-categorize others (Ridgeway 1997; West and Zimmerman 1987). To create an IAT that accurately captures gender status beliefs, the images presented in the IAT should also elicit this automatic categorization process. The IAT uses responses latencies to capture this automatic categorization process. If an individual is faster at sorting an image to a gender category, it indicates that the specific image is better at eliciting implicit stereotypical gender differentiation.
To this end, we collected response times as participants sorted images of men and women over many trials. Participants completed four phases. Each phase entailed participants sorting 22 grayscale or color images. The order of images was randomized, as was whether the participant first sorted color or grayscale images. Upon completing the sorting task, participants completed a brief survey and were debriefed.
Procedure and Manipulation
Participants sorted images by pressing the “e” key for women or the “i” key for men. Respondents were instructed to identify images as quickly as possible. An image remained on the page until the participant sorted the image to the gender presentation of the person in the photo; the time it took a respondent to identify the image was recorded. The order of the images was randomly assigned within phases at the programming stage, meaning that each phase had a single randomized order. The specific images were taken from Google Images and an online database (https://generated.photos). The images were cropped to only show the face of the individual (Nosek et al. 2002a). Images varied the gender (man or women) and race (white, black, Hispanic, and Asian) of individuals. 1 They all appear to be people in their late 20s to late 30s.
There was a single manipulated factor: whether participants completed a grayscale or color phase first. Each phase entailed sorting 22 images. In one condition, participants sorted grayscale, color, grayscale, and color photos. In the other condition, participants sorted color images first, followed by grayscale images, and so on. We manipulated this factor to ensure that sequence effects do not explain our results.
Response Times
Across the four phases, participants completed 88 trials of timed categorization. Each of the 22 images was sorted twice each in color and grayscale. Response times greater than 10 seconds are excluded from our analyses to avoid influencing overall results (Greenwald et al. 2003). In phases 1, 2, 3, and 4, we excluded 29 (.07 percent), 18 (.04 percent), 19 (.05 percent), and 47 (.12 percent) of the participant-trials, respectively. We report results for 448 participants and 39,424 participant-trials.
Analysis
We used a series of exploratory factor analyses to determine which images are best driven by stereotypical gender differentiation, and then we used confirmatory factor analysis to determine whether grayscale or color images best represent the underlying construct. Separately for the response latencies for color and grayscale images, we estimated a series of exploratory factor analyses. As participants sorted each image twice, we had 44 response latencies for the color images and another 44 for the grayscale images. Our first factor analysis model included all 44 response latencies. We cut the response latencies corresponding to the same image on the basis of the smallest factor loading. In this way, cutting one image results in cutting two variables, as the response was measured twice. We repeated this several times, each time cutting the latencies associated with a single image. We stopped when we got to 10 images: 5 men and 5 women. Finally, we compared the results from confirmatory factor analyses of the grayscale and color images to determine which is preferred.
Results 2
Table 1 shows the final set of 10 grayscale and color images, 3 and reports the average response times by participant gender. The only apparent pattern in the response times is that men are slower to respond on average (Greenwald et al. 2022). Table 1 also shows results from the exploratory factor analyses for the final sets of grayscale images and color images. There are two means and factor loadings for each image because each image was sorted twice. The first mean and factor loading corresponds to the time taken to sort the image the first time the participants view the photo; the second mean and factor loading corresponds to the second time participants view the photo. Each image loads on factor 1 with a result of .4 or greater, except for one grayscale image. This image loaded on factor 1 with a score of .4 or greater until the final round of factor analyses. The image was kept in the final set to balance the number of white women and white men.
Images, Response Means in Seconds, and Factor Loadings for the Final Exploratory Factor Analyses.
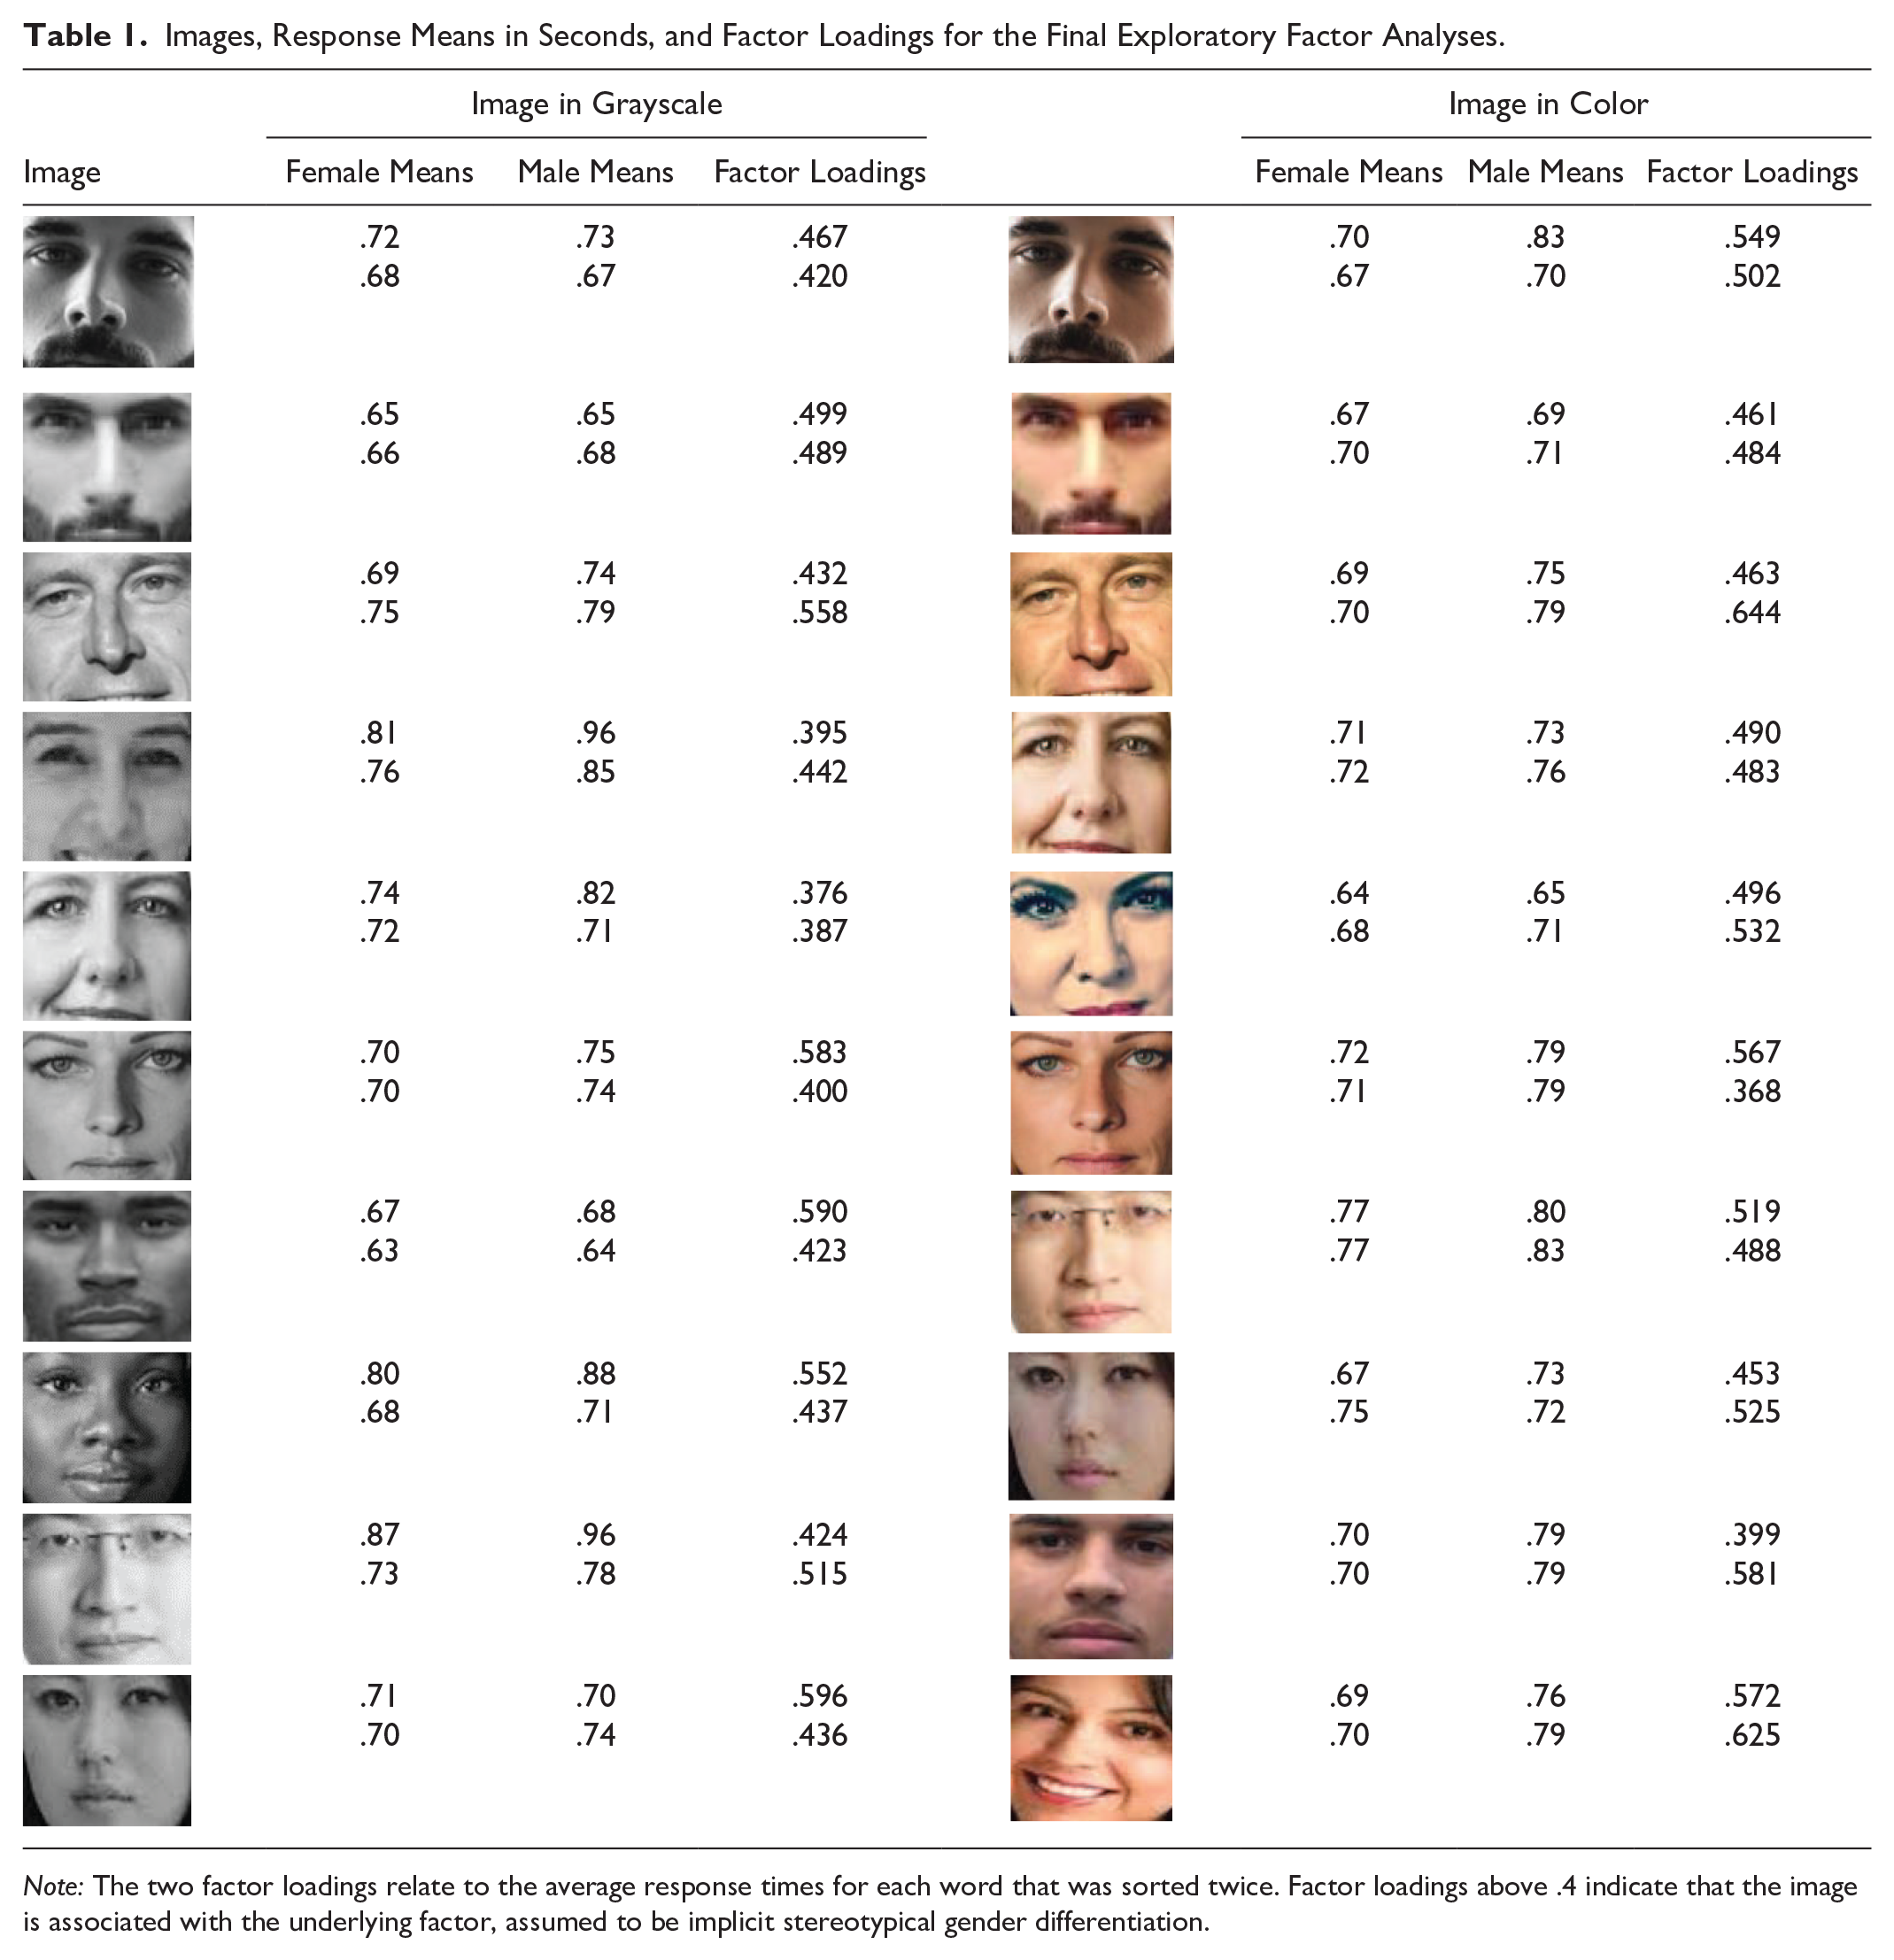
Note: The two factor loadings relate to the average response times for each word that was sorted twice. Factor loadings above .4 indicate that the image is associated with the underlying factor, assumed to be implicit stereotypical gender differentiation.
For both grayscale and color images, we assume that factor 1 represents implicit gender differentiation. This is due to stereotypical gender differences being the primary difference between the images. Table 2 shows the eigenvalues and proportion of variance explained for the factors influencing results of the final sets of grayscale and color images. Approximately 74 percent of the variation is explained by implicit gender differentiation for grayscale images, and 69 percent is explained by implicit gender differentiation for the color images. Color images also load on factor 2 with an eigenvalue above 1. Factor 2 explains approximately 18 percent of the variation. 4
Eigenvalues and Proportions of Variance Explained.

Note: Factor 1 is assumed to be implicit stereotypical gender differentiation and explains approximately 74 percent of the variation for grayscale images. Factor 1 explains approximately 69 percent of the variation for color images.
Table 3 illustrates the results from confirmatory factor analyses, with a single underlying factor predicting the response latencies. We estimated separate models for the grayscale and color items. The results show that the final set of grayscale images yields both a lower Akaike information criterion score and a lower Bayesian information criterion score compared with the final set of color images. This indicates that the final set of grayscale images fit the data better than the final set of color images. Table 3 also reports root mean square error of approximation (RMSEA) statistics, showing that the model for grayscale images fits the data better than the model for the color images. 5
Results from Confirmatory Factor Analyses.

Note: Lower AIC and BIC scores indicate that images presented in grayscale better fit the data. Nonoverlapping confidence intervals for RMSEA statistics also indicate that grayscale images fit the data better than color images. AIC = Akaike information criterion; BIC = Bayesian information criterion; CI = confidence interval; RMSEA = root mean square error of approximation.
p < .001.
For the grayscale data, there is only one eigenvalue larger than 1. For the color images, there are two eigenvalues larger than 1. This indicates that differences in response times for grayscale images are due to implicit stereotypical gender differentiation, whereas differences in response times for color images are due to stereotypical implicit gender differentiation and another latent variable. This provides further evidence that the final set of grayscale images are preferred to the final set of color images for gender status IATs. That is, the grayscale images result in better model fit and the factor structure is more in line with expectations.
The results from this study align with previous IATs regarding color presentation. Previous studies follow Nosek et al.’s (2002a) original color format by presenting images in grayscale. Other studies have suggested that color images may be preferred for race IATs (Smith-McLallen et al. 2006; Stepanova and Strube 2009, 2012). For stereotypical gender differentiation, grayscale presentation fits our data best. We now turn to an investigation of the words used in an IAT to induce status differentiation.
Study 2
Participants
We used Prolific to recruit 500 participants, who were each paid $1.50. The sample was 74 percent white, 5 percent black, 9 percent Asian, and 7 percent Hispanic; 5 percent identified other races. The sample was 58 percent female, with an average age of 33 years. Education, income, political alignment, and experience with IATs were measured the same as in study 1. On average, respondents had attained slightly higher than an associate’s degree. Respondents’ income averaged about $43,000 per year. On average, respondents identified between “slightly liberal” and “liberal.” Finally, on average, respondents previously completed between one, and two or three IATs.
Overview
The goals of study 2 are twofold. First, we seek to establish which status words that are used in traditional status questionnaires (Rashotte and Webster 2005; Thye 2000) are the best at discerning implicit status categorization. Second, we seek to determine whether status categorization and mere evaluations (i.e., good and bad words) load on a single underlying factor, or on two distinct factors. Study 2 follows the same logic as study 1. If participants are faster at sorting certain words to the “status” category, it indicates that those words elicit status categorization. We collected response times as participants sorted status words (e.g., capable and incapable) and evaluation words (e.g., angry and glad) over many trials. Participants completed four phases. Each phase entailed participants’ sorting 11 high-status words and 11 low-status words (Rashotte and Webster 2005) or 10 evaluation words: 5 good words and 5 bad words (Melamed et al. 2019, 2020). The chosen status words stem from traditional status questionnaires (Rashotte and Webster 2005; Thye 2000; Zeller and Warnecke 1973), while the chosen valence words stem from previously tested IATs (Melamed et al. 2019). The goal is to determine which of these words frequently used in explicit status measures, which have already been assessed for reliability and validity, best elicit implicit status categorization. Prior research has demonstrated that a subset of these status words and valence words load on separate underlying factors (Melamed et al. 2020); however, to our knowledge, this is the first study to test each word from traditional status questionnaires to determine which best elicit implicit status categorization and further ensure that these status words are distinct from mere valence words. The order of words was randomized, as was whether the participant first sorted status or evaluation words. Upon completing the sorting task, participants completed a brief survey and were debriefed.
Procedure and Manipulation
During the status sorting phases, participants sorted words by pressing the “e” key for low status and the “i” key for high status. During the evaluation sorting phases, participants sorted words by pressing the “e” key for bad and the “i” key for good. Respondents were instructed to sort words as quickly as possible. A word remained on the page until the participant sorted the word to the correct category; the time it took a respondent to sort the word was recorded. The order of the words was randomly assigned within phases at the programming stage, meaning that each phase had a single randomized order.
There was a single manipulated factor: whether participants completed a status or an evaluation phase first. Subjects sorting status words first identified 22 status words, 10 evaluation words, 22 status words, and 10 evaluation words. Those sorting evaluation words first would work in the opposite order as those in the status condition. We manipulated this factor to ensure that sequence effects could not explain our results.
Response Times
Across the four phases, participants completed 64 trials of categorization. Each of the 22 status words and 10 evaluation words was sorted twice. As with study 1, response times greater than 10 seconds are excluded from analysis to avoid influencing overall results. In phases 1, 2, 3, and 4, we excluded 34 (.11 percent), 8 (.03 percent), 5 (.02 percent), and 3 (.01 percent) of the participant-trials, respectively. We report results for 459 participants and 29,376 participant-trials.
Analysis
Prior research on status IATs have used factor analysis to investigate whether status and valence words measure different underlying constructs (Melamed et al. 2020), a method well suited to this task (Kim and Mueller 1978). For the response latencies for status words, we estimated a series of exploratory factor analyses. Factor analysis is based on the assumption that observed variables are correlated because of an underlying latent factor (Hatcher and O’Rourke 2013; Kim and Mueller 1978). The observed variables for study 2 are the response times of sorting words to either status or valence. SCT and expectation states theory (EST) (Berger et al. 1977; Correll and Ridgeway 2003) suggest that status is related to expectations of competence and social worth, which is distinct from mere good and bad evaluations; additionally, prior status research (Rashotte and Webster 2005; Thye 2000; Zeller and Warnecke 1973) demonstrated that measures using the words tested here capture explicit status beliefs. This provides our theoretical foundation for the assumption of the underlying factors driving the correlation between response times. In the case of the status words, the underlying factor that the words load on the highest is assumed to be status differentiation. As participants sorted each word twice, we had 44 response latencies for the status words. We created variables for all 22 status words by taking the average response latencies for all pairs of status words. For example, the two sets of response latencies for the high-status word superior are added to the two sets of response latencies for the low-status word inferior and divided by 4.
We treat the words as pairs on the basis of the format of explicit status beliefs measures (Rashotte and Webster 2005; Thye 2000; Zeller and Warnecke 1973); questions are ordered scales with high- and low-status words on opposite ends (e.g., competent on one end and incompetent on the other end). Treating these words as pairs ensures that a status word has its high- or low-status counterpart (e.g., worthy and unworthy). One of the goals of study 2 is to determine whether the words used in established explicit status measures are distinct from valence, and to determine which of these established word pairs best elicit implicit status differentiation. Because of this goal, we treat the status words as pairs, as they appear in the extant literature. Our first factor analysis model includes 11 averages from the 22 total status words. We cut the response latencies corresponding to the same word on the basis of the smallest factor loading. In this way, cutting one variable results in cutting two status words: one high status and one low status (e.g., superior and inferior). We repeated this several times and stopped when we got to five variables. The five remaining variables are associated with 10 status words: 5 high-status words and 5 low-status words. Finally, we compared the results from confirmatory factor analyses to confirm that the content of status words differs from evaluation. The first model assumes the status words and evaluation words are driven by different underlying latent variables. The second model assumes a single latent variable drives responses to both status and evaluation words (i.e., status and mere evaluations are the same in terms of response latencies).
Results
Table 4 shows the five high-status and five low-status words that we retained: (in)capable, (in)competent, (un)able, (un)worthy, and (un)skilled. 6 Notably, competence and worth are the two most central aspects of status (Berger et al. 1977). The table also shows average response times by participant gender. Men are slightly slower once again. We also notice that participants were faster the second time they sorted words than the first time. Table 5 illustrates the eigenvalues and proportion of variance explained for the factors influencing results of the final set of status words. Approximately 69 percent of the variation is explained by factor 1, which is assumed to be status differentiation. Table 4 contains the loadings for the final set of high-status and low-status words. Each word loads on factor 1 with a result of .4 or greater. Three words—competent, incompetent, and unworthy—have a single factor loading below .4. The original averages for these three words all loaded on factor 1 with a value above .4. The results from study 2 align with prior status research using explicit questionnaire items, which focus on competence (Rashotte and Webster 2005; Thye 2000; Zeller and Warnecke 1973). Our final subset of status words to be used in an IAT also primarily focus on capability and competence; four of five words are related to competence (capable, competent, able, and skilled) and only one word focuses on social worth (worthy).
Response Time Means in Seconds and Factor Loadings for the Final Set of Status Words.
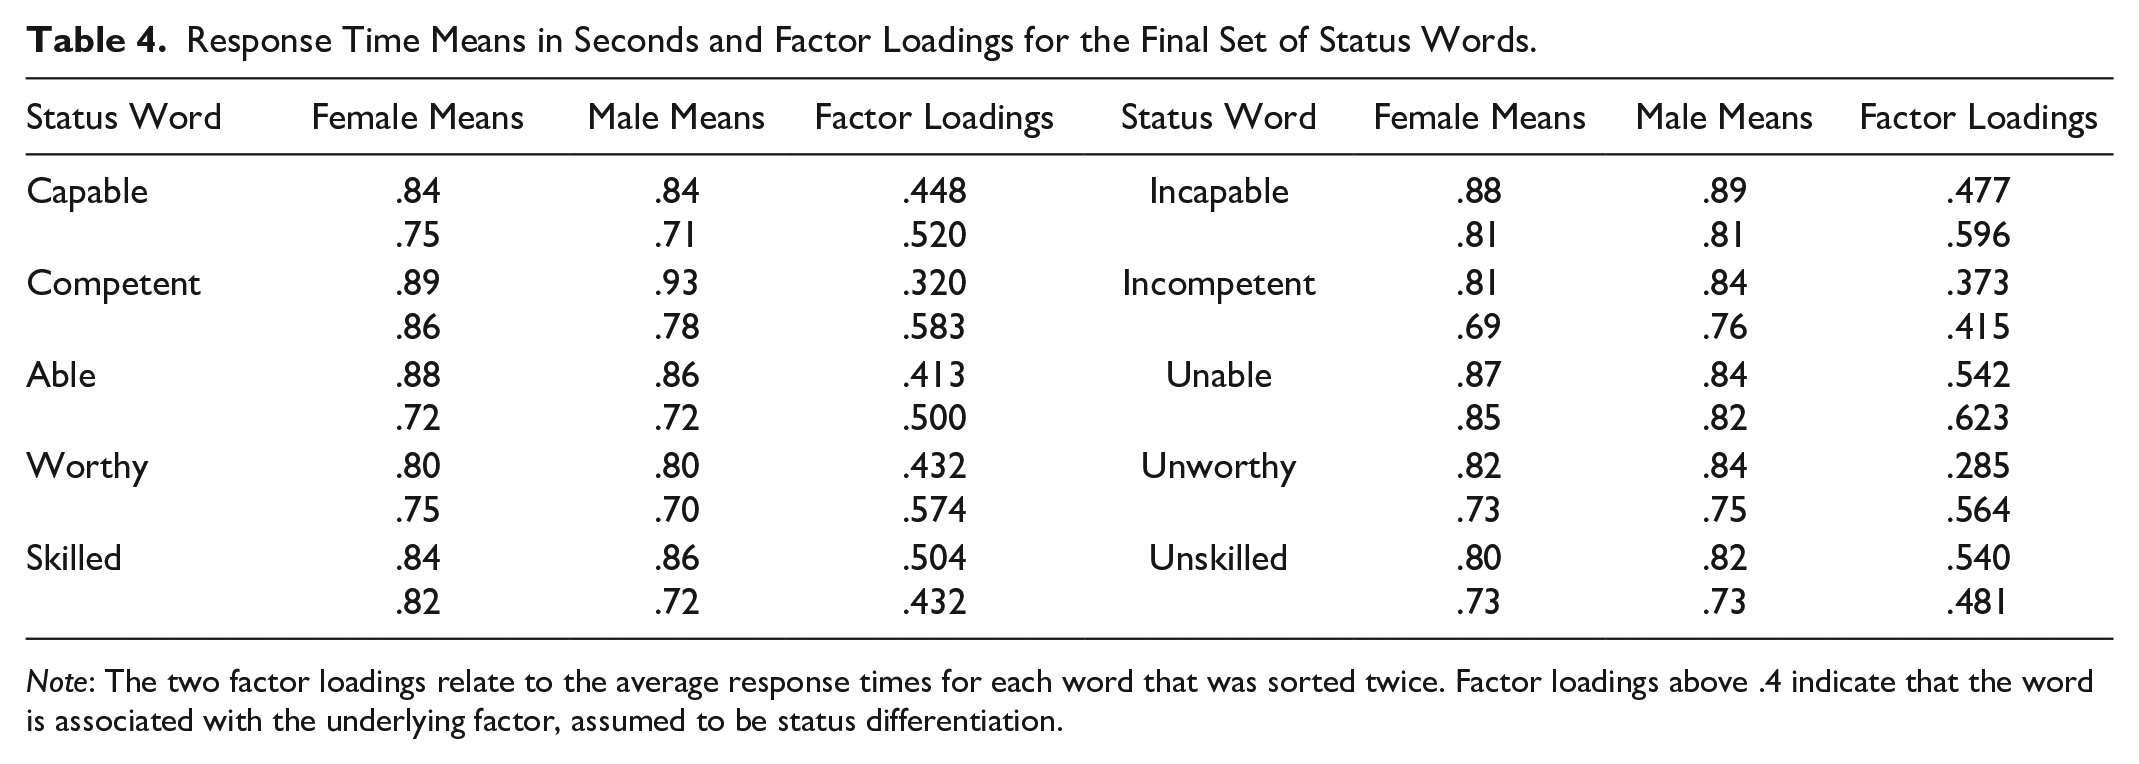
Note: The two factor loadings relate to the average response times for each word that was sorted twice. Factor loadings above .4 indicate that the word is associated with the underlying factor, assumed to be status differentiation.
Eigenvalues and Proportions of Variance for Status Words.

Note: Factor 1 is assumed to be implicit status differentiation and explains approximately 69 percent of the variation. Factor 2 is assumed to be implicit valence differentiation and explains approximately 17 percent of the variation.
Given the set of best status words from the exploratory factor analyses, we turned to evaluating whether status and evaluations are distinct constructs in terms of participant responses. Table 6 illustrates the results from the confirmatory factor analyses that were estimated on the subset of 10 status words and 10 evaluation words. We compare the information criteria from a model that assumes the status words and evaluation words load on different constructs and a model that assumes they are driven by a single underlying construct. The Akaike information criterion and Bayesian information criterion scores of the model that separates status from evaluation are lower than the model that combines status and evaluation. These results indicate that the content of status words does differ from the content of evaluation words. This means that the final set of words do not simply imply meanings of good or bad (i.e., evaluation) but instead imply meanings of competence and worth (i.e., status). Table 6 also shows RMSEA fit statistics. Here too the model with two factors fits better than the single factor model. The results indicate that the response latencies between the subset of status words and valence words are moderately and significantly correlated (r = .67). This is not surprising, as status inherently relates to valence (i.e., it is better to be competent than incompetent). However, it is important to note that the two concepts load on separate factors and the subset of status words do not simply imply meanings of good or bad.
Results from Structural Equation Models’ Information Criteria for Status and Evaluation Words: Pairwise Correlation between Status and Valence Response Latencies.

Note: Lower AIC and BIC scores indicate that models differentiating status from mere valence better fit the data. Pairwise correlation between response latencies of status and valence words indicate the concepts are moderately correlated. AIC = Akaike information criterion; BIC = Bayesian information criterion; CI = confidence interval; RMSEA = root mean square error of approximation.
p < .001.
The results from study 2 provide a subset of words that best capture implicit status differentiation and shows that status differentiation is not the same as mere positive and negative evaluations. Future IATs can use these words to capture implicit beliefs about competence and worth. For study 3, we created a standard long-form IAT and a brief IAT using the subsets of images and words from studies 1 and 2. Study 3 calculates the test-retest reliability of the novel gender status IAT. We compare the results of the long-form IAT with those of the BIAT to evaluate if the methods measure the same concept.
Study 3
Participants
We used a sample of 64 undergraduate students from a large midwestern university who completed both parts of the study. All students received extra credit in a sociology course as payment for participation. The sample was 69 percent white and 31 percent other races. The sample was 45 percent female, with an average age of about 20 years. Political alignment was measured on a six-point scale ranging from “very conservative” to “very liberal.” On average, respondents identified between “slightly liberal” and “liberal.” Finally, we asked respondents to report the number of IATs they have previously completed using an ordinal scale; on average, respondents previously completed about one IAT.
Overview
The goal of study 3 is to assess the test-retest reliability of our new gender status IAT that was derived from the results of studies 1 and 2. Using the subset of optimal images found in study 1 and the subset of optimal words identified in study 2, we created a standard long-form IAT and a BIAT designed to capture implicit gender status beliefs. We collected response times as participants completed both a gender status IAT and BIAT. Study 3 consisted of two parts. In part 1, participants completed both our gender status IAT and the BIAT. Part 2 took place at least 24 hours after a participant completed part 1; respondents then retook both our gender status IAT and BIAT. On average, respondents took part 2 95.6 hours after part 1. By calculating and comparing the intraclass correlation coefficients (ICCs) on the basis of the participants’ D scores from part 1 and part 2, we determine the test-retest reliabilities of both the gender status IAT and BIAT. Upon completing both the IAT and BIAT, respondents completed a brief survey and were debriefed.
Procedure and Manipulation
The standard long-form IAT entails seven phases; the practice phases (phases 1, 2, and 5) each contain 20 trials, while the test phases (phases 3, 4, 6, and 7) each contain 40 trials (Greenwald et al. 2003). Our long-form IAT consists of seven phases with 20 trials in each phase (Melamed et al. 2019). Respondents were instructed to pair two concepts, gender and status, as quickly as possible. Participants would press the “e” and “i” keys to pair words and images. Pairing an image or word with “high status,” “low status,” “men,” or “women” alternates between the “e” and “i” key throughout different phases; this is to ensure that participants are using both hands to pair concepts. An image or word would remain on the page until the respondent correctly paired the concepts; the time it took a participant to correctly pair the concepts was recorded. The order of the images and words was randomly assigned within phases at the programming stage, meaning that each phase had a single randomized order.
The BIAT only entails four phases. The order of images and words was randomly assigned, respondents were instructed to pair concepts of high and low status with men and women as quickly as possible, and response times were recorded. Participants would press the “e” and “i” keys to pair words and images; the same words and images are used in the long-form IAT and BIAT. Unlike the IAT, the BIAT does not alternate between the “e” and “i” keys when pairing words or images to high and low status. Instead, the focal category will always require pressing the “e” key and all other categories require pressing the “i” key. The focal category for the BIAT was high status. Gender is not the focal category of the BIAT; therefore, pairing an image or word with “men” or “women” does alternate between the “e” and “i” key, as shown in Figure 1. The focus of study 3 is to determine whether the IAT and/or BIAT have sufficient test-retest reliability. Therefore, there was a single manipulated factor: whether participants completed the IAT or BIAT first. We manipulated this factor to ensure that sequence effects could not explain our results.

Example of brief implicit association test trials.
Response Times
During the IAT in part 1, there were 140 sorting trials. Response times greater than 10 seconds were excluded from analyses to avoid influencing overall results (Greenwald et al. 2003). In phases 3, 4, 6, and 7, we excluded 6 (.47 percent), 4 (.31 percent), 1 (.08 percent), and 3 (.23 percent) of the participant-trials, respectively. During part 2, in phases 3, 4, 6, and 7, we excluded 0 (0 percent), 2 (.16 percent), 2 (.16 percent), and 1 (.08 percent) of the participant-trials, respectively. Additionally, respondents who completed 10 percent or more of the trials in less than .3 seconds were also excluded from analyses (Greenwald et al. 2003); we excluded 8 (12.5 percent) of the participants. We report results for 56 participants and 7,840 participant-trials for the standard long-form IAT.
During the BIAT in part 1, respondents completed 80 trials of implicit gender status association. In phases 3 and 4, we excluded 17 (1.3 percent) and 13 (1 percent) participant-trials for response times greater than 10 seconds. During part 2 in phases 3 and 4, we excluded 0 (0 percent) and 0 (0 percent) of the participant-trials, respectively. We excluded 9 (14 percent) of the participants for completing 10 percent or more trials in less than .3 seconds. Below, we report results for 55 participants who completed both waves of data collection on the BIAT and who completed ≥90 percent of trials in more than .3 seconds.
Analysis
For the long-form IAT we used response latencies from phases 3, 4, 6, and 7 to generate a single score for each participant (Greenwald et al. 2003). We calculate the inclusive standard deviation for phases 3 and 6 and the inclusive standard deviation for phases 4 and 7. We then calculate the mean response latencies for phases 3, 4, 6, and 7. We then calculate two mean differences by subtracting the mean response latency for phase 3 from the mean for phase 6, and we subtract the mean for phase 4 from the mean for phase 7. In phase 3 and phase 4, women are associated with high status. In phase 6 and phase 7, men are associated with high status. By subtracting the response times from phases 3 and 4 from the response times of phases 6 and 7, we can determine whether respondents implicitly associate men or women with high status. If the response times from phases 3 and 4 are lower than the times from phases 6 and 7, respondents hold the implicit belief that women are higher status than men. We then divide the mean difference by its corresponding inclusive standard deviation and take the average of that result; this yields the final IAT score (also known as D). This score indicates whether participants hold an implicit gender status bias. We calculated IAT D scores for both part 1 and part 2 of the study to calculate the test-retest reliability of the IAT.
Calculating the D score for the BIAT follows a similar method but only requires response latencies from phases 3 and 4. The inclusive standard deviation is calculated for phase 3 and phase 4. The difference between the two means is calculated and divided by the standard deviation. This yields the final BIAT D score (Sriram and Greenwald 2009). We calculated BIAT D scores for both part 1 and part 2 of the study to calculate the test-retest reliability of the BIAT. In phase 3 men are associated with high status, and in phase 4 women are associated with high status. If the response times are faster in phase 3, respondents hold the implicit belief that men are higher status than women. In both cases, positive scores mean that the respondent takes longer to sort male images with high status, indicating that the respondent associates female with high status. Alternatively, negative scores mean that the respondent takes longer to sort female images with high status, indicating that they associate high status with men, as they are faster at making that connection.
Given that we are interested in computing test-retest reliability on the basis of multiple measurements, the ICCs from a two-way mixed-effects model is the appropriate metric for us to use (Koo and Li 2016; Liu et al. 2016; McGraw and Wong 1996). Given our design, the ICC provides information on the reliability of a measurement by determining how much variation is explained in the IAT scores by nesting their repeated measurements within participants. A higher ICC indicates a more reliable measure, but the ICC must pass a certain threshold to have acceptable test-retest reliability (Koo and Li 2016). This means that if the ICC of an IAT or BIAT passes the acceptable threshold, the measure consistently captures the same information over time.
Results
Table 7 presents descriptive statistics for D for both the IAT and BIAT for phases 1 and 2. Absolute D scores are hard to interpret, as such things as the order of blocks shapes the overall score (Greenwald et al. 2003). But relative scores are more straightforward: here, higher scores imply associating female with higher status. As noted in Table 7, across both measures and both waves, women view women as implicitly higher status than men do. Table 7 also illustrates that the IATs in part 1 and part 2 are highly correlated. Additionally, the D scores for the BIAT in part 1 are moderately correlated with the scores from the IAT in both parts 1 and 2. However, the D scores for the BIAT in part 2 are weakly correlated with the other measurements
Sample Means and Pairwise Correlations of D Scores.

Note: The IATs in part 1 and part 2 are highly correlated. The BIATs in part 1 and part 2 are weakly correlated. A positive D score indicates associating women with high status. BIAT = brief implicit association test; IAT = implicit association test.
p < .05. **p < .01. ***p < .001.
To further validate our gender status IAT, we provide correlations between our implicit measure and explicit status measures. Participants were asked to rate men and women on a nine-point scale on the same criteria as our status IAT (e.g., competence and worth). Results indicate that our gender status IAT is positively correlated with our explicit first-order status beliefs measure. This means that if a participant implicitly views women as high status, they explicitly state that women are high status. Results also indicate that our gender status IAT is negatively correlated with our explicit generalized second-order status beliefs measure. This means that if a participant implicitly views women as high status, they explicitly state that they believe most other people believe that men are high status. This is related to the frequent discussion of whether the IAT measures first-order (i.e., what an individual personally believes) or generalized second-order beliefs (i.e., what an individual believes most other people believe). Our results suggest that the gender status IAT is closer aligned with first-order status beliefs. If the IAT were capturing generalized second-order status beliefs, we would expect to see a positive correlation (i.e., if an individual’s IAT score reports implicit association between women and high status, they should explicitly state that they believe most other people believe women are high status). However, these correlations are weak and only the correlation between the standard long-form IAT from part 2 and the explicit first-order status beliefs measure are significant. Additionally, the correlation between BIAT from part 1 and explicit generalized second-order status beliefs measure are significant.
Table 8 presents the results from two two-way mixed-effects absolute agreement models indicating the test-retest reliability of both the BIAT and the IAT. The ICC for the IAT reports moderate retest reliability, while the BIAT reports poor retest reliability (Koo and Li 2016). The weak correlation between waves of the BIAT results in a low retest reliability for the BIAT. Our ICC for the standard long-form IAT is similar to the test-retest reliabilities found in other IATs, which typically range from .60 to .69 (Bosson, Swann, and Pennebaker 2000; Dasgupta and Greenwald 2001; Greenwald and Farnham 2000; Greenwald and Nosek 2001). On the basis of this limited sample, we suggest that future studies measuring implicit gender status beliefs use the standard long-form IAT rather than the BIAT.
ICCs from Two-Way Mixed-Effects Absolute Agreement Models Indicating Retest Reliability.

Note: The standard long-form IAT has high test-retest reliability. The BIAT has poor test-retest reliability. BIAT = brief implicit association test; IAT = implicit association test; ICC = intraclass correlation coefficient.
Discussion and Conclusions
We present the results of three studies designed to create and refine the measurement of the gender status beliefs IAT on the basis of stereotypical masculine and feminine gender presentation. Factor analyses reveal a specific set of images that best elicit implicit gender categorization. Factor analyses also identify a subset of status words that best distinguish status from mere evaluation, and that best discern implicit status categorization. Finally, we created a standard long-form IAT and a BIAT using the final images and status words to determine the retest reliability of both methods. These three studies combined create a single version of a gender status IAT that best captures implicit beliefs about men and women’s competence and social worth.
SCT (Berger et al. 1977) posits that status characteristics, such as gender, lead to various forms of social inequality, such as the devaluation of female-dominated occupations and activities (Ridgeway 2011). Although performance expectations (i.e., expectation states) are the causal mechanism of the theory (Berger et al. 1977), status beliefs are the broad cultural beliefs that lead to the development of expectation states (Melamed et al. 2019; Ridgeway 2018). Therefore, it is important to accurately capture these beliefs. Previous research on status IATs suggest that the IAT is capturing first-order status beliefs (Melamed et al. 2019). However, other researchers have provided arguments that the IAT is capturing broader cultural beliefs that an individual quickly associates with social categories in an IAT (Arkes and Tetlock 2004; Payne et al. 2017). Although we believe that our gender status IAT may be capturing first-order status beliefs (i.e., status beliefs personally held by an individual), we acknowledge that broader generalized second-order status beliefs (i.e., status beliefs that individual believes “most other people think”) may be reflected in these measurements. Our results from study 3 illustrate positive correlations between our gender status IAT and explicit first-order status beliefs measure, while we report a negative correlation between our IAT and explicit generalized second-order status beliefs measure; however, these correlations are weak and only the correlations between the standard long-form IAT from part 2 and our explicit first-order status beliefs measure, and the BIAT from part 1 and our explicit generalized second-order status beliefs measure, are significant. Whether our status IAT captures first or generalized second-order status beliefs, the measurement tool still has promise for further understanding status beliefs about gender, and individual behaviors and broader trends related to gender. Future research is needed to further determine which order of status beliefs is being captured by the IAT.
Gender status beliefs explain various forms of economic and occupational inequality. Organizational practices are permeated with gendered meanings that value the contributions of men over women (Lucas 2003; Ridgeway 1997, 2009), and these beliefs influence individual level outcomes, such as career aspirations and presumptions of one’s own abilities (Correll 2004). Individuals are likely unwilling to openly state that they believe men are more competent than women, and individuals unknowingly hold negative status beliefs (DeMaio 1984; Swim and Cohen 1997). The IAT is designed to reduce these issues of social desirability and capture implicit associations between concepts (Greenwald et al. 1998). Improving the measurement capability of the IAT expands the use of the method to confidently capture implicit status beliefs that lead to various forms of gender inequality.
Group members automatically gender-categorize one another during interactions (Fiske 1992; Ridgeway 1997; West and Zimmerman 1987). These automatic categorizations lead individuals to call upon status beliefs favoring those of high status. To better capture these automatic categorizations, we identified a set of five male and five female images that lead participants to categorize the individuals in the photos as men and women. The images we chose to test are based on stereotypical masculine and feminine presentations. The results from study 1 identify images of individuals that elicit implicit gender categorization of men and women. Prior IATs crop images to only show the face and present the images in grayscale (Nosek et al. 2002a). Previous studies call into question this color format because of different features of the image becoming salient depending on whether a photo is in color or grayscale (Smith-McLallen et al. 2006). Using exploratory factor analyses, we illustrate that images presented in grayscale, rather than in color, further bolster implicit stereotypical gender differentiation. Researchers using these images can confidently conclude that participants viewing the images are associating status beliefs with men and women.
After identifying images that best elicit implicit gender categorization on the basis of stereotypical masculine and feminine presentation, we determine which subset of status words are best at discerning implicit status categorization. We used exploratory factor analyses to determine which status words best capture beliefs of competence and worth. We determined that the high- and low-status words capable and incapable, competent and incompetent, able and unable, worthy and unworthy, and skilled and unskilled best elicit implicit status categorization. The results of study 2 indicate that the subset of status words load on a separate underlying latent variable than the subset of evaluation words. This means that the content of status words differs from the content of evaluation words. The results from study 2 not only provide an optimal set of status words for a status IAT but also further validate the words from traditional questionnaire items designed to capture status beliefs (Rashotte and Webster 2005; Thye 2000; Zeller and Warnecke 1973), which tend to focus on capability and competence. A researcher using these words in an IAT can confidently argue the results represent implicit beliefs of competence and worth.
We combined the final subset of grayscale images and final subset of status words to create a standard long-form IAT and BIAT. We calculated the implicit association D scores for the IAT and BIAT to determine whether the two methods measure the same underlying concept of implicit gender status beliefs. Additionally, the results of study 3 uncover the retest reliability of both the IAT and BIAT. The results of study 3 illustrate that the D scores of the BIAT in part 1 and IAT in parts 1 and 2 are moderately correlated. However, the D scores of the BIAT in part 1 and part 2 report low levels of correlations. These correlations align with the results testing the retest reliability of both methods. The standard long-form IAT yields a higher conditional ICC, indicating that the retest reliability of the IAT is higher than that of the BIAT. A researcher measuring implicit gender status beliefs should use the standard long-form IAT rather than the BIAT. These results are based on a limited sample; therefore, future research is needed to more confidently determine the retest reliability of the standard long-form IAT compared with the BIAT.
Limitations and Future Research
The images identified in study 1 and used in the IAT and BIAT in study 3 portray individuals that are significantly associated with attractiveness, and some images are more attractive than others. Prior research indicates that beauty or attractiveness is associated with status (Webster and Driskell 1983); however, we chose to keep these images in our final analyses because they load on factor 1, which is assumed to be implicit stereotypical gender differentiation, above the .4 threshold. Future research conducting an IAT should determine whether the attractiveness of these images is influencing the IAT effects.
The images we chose to present are based on stereotypical masculine and feminine gender presentations. Therefore, results from this IAT can only inform researchers on the implicit status beliefs toward men and women, rather than the status beliefs toward gender-nonbinary individuals. Future research should address this issue by testing and incorporating images of individuals that do not present in these stereotypical masculine or feminine ways. An IAT developed in this way would allow researchers to uncover implicit status beliefs toward gender-nonbinary individuals compared with those with traditional masculine and feminine gender presentations.
In study 2, following previous status IAT research, we used exploratory and confirmatory factor analyses (Melamed et al. 2020) to identify which status words best elicit implicit status categorization and demonstrate that these status words are qualitatively different from evaluation words used in traditional IATs. Although we believe that the factor analyses in study 2 provide convergent validity (Schimmack 2021) for the status words used in the gender status IAT, we acknowledge that future research could use different methods to further validate the IAT measures. Various studies have analyzed the predictive validity of the IAT by comparing the IAT’s results with observed behaviors (see Greenwald et al. 2009; Rae and Olson 2018; Rudman 2008). The traditional IAT has been critiqued on its ability to predict behavior (Paluck et al. 2021). However, prior work illustrates that research on sensitive topics, such as status beliefs about gender, using an IAT has a predictive validity that surpasses explicit measures (Greenwald et al. 2009). Additionally, prior work demonstrates that IATs focusing on stereotypes rather than mere associations tend to be better predictors of behavior (Rudman and Ashmore 2007). This is a worthwhile comparison for our gender status IAT to determine its predictive validity. Studies using both the IAT and explicit measures result in higher predictive validity (Greenwald et al. 2009). Status research commonly tests the propositions of SCT and EST through experiments (Correll 2004; Lovaglia et al. 2017; Mize 2019; Thébaud 2015; Thye and Harrell 2017). Comparing the results of our status IAT with the results of the behaviors of traditional status experiments would provide predictive validity to our measure. If our gender status IAT reveals that an individual implicitly associates men with high status (i.e., high competence and social worth), we would expect that same individual to be more likely to hire a male applicant over a female applicant in an audit study.
Relatedly, further methods to determine whether the status IAT is measuring status beliefs would be to compare the implicit measure to explicit measures. Status research tends to use questionnaires to capture explicit status beliefs (Rashotte and Webster 2005; Thye 2000; Zeller and Warnecke 1973). These questionnaires tend to follow experiments designed to test whether expectations related to status characteristics affect social interactions (Dippong 2015; Rashotte and Webster 2005; Thébaud 2015). Prior IAT research has compared the correlations between implicit and explicit measures (Greenwald et al. 2009, 2020; McConnell and Leibold 2001), and future research using status IATs could use a similar method. Additionally, studies suggest that using both and IAT and an explicit measure results in higher predictive validity (Greenwald et al. 2009). Participants could complete a status IAT and complete a traditional status questionnaire, which have been shown to capture status beliefs. Correlations between the implicit and explicit measures would further validate the status IAT’s ability to capture status beliefs. Although we do provide these correlations in study 2, the correlations are weak. Future research on status IATs would benefit from further testing the correlations between the IAT measure and explicit status beliefs measures.
We use exploratory and confirmatory factor analyses in study 2 to determine if status words are distinct from valence words. Prior research has used similar methods to analyze this distinction (Melamed et al. 2020), but factor analyses are not without limitations. Factor analysis is based on assumptions derived from theoretical justifications. SCT and EST suggest that status is related to expectations of competence and social worth, which we argue is a theoretical justification for assuming that status words in study 2 are loading on status rather than valence. However, because of the limitations of exploratory factor analysis, we cannot definitively say that factor 1 is status.
Recent IAT research suggests that an IAT should not include words that are negations of other words in the IAT (e.g., happy and unhappy; Greenwald et al. 2022). The argument is that when participants encounter a certain word, they must activate and negate an associated word. For example, if a participant encounters the word ungrateful, they first implicitly activate the word grateful and negate it to arrive at ungrateful. Greenwald et al. (2022) suggested that this negation process requires additional cognitive processing that can make the IAT difficult for participants. Our gender status IAT uses words that are negations of other words (e.g., competent and incompetent). That being said, our words for study 2 stem from previous research (Rashotte and Webster 2005; Thye 2000; Zeller and Warnecke 1973) that are designed to measure explicit status beliefs. However, this could lead to our gender status IAT requiring more cognitive processing than necessary. Future research using or testing a status IAT could determine if synonyms of these negation words are also associated with status. For example, a synonym for incompetent is useless; if the word useless is associated with low status, a status IAT may consider replacing incompetent with useless to avoid using the negation of competent, which may reduce the amount of cognitive processing required of a participant. However, additional research is needed to ensure that these synonyms of negation words are associated with status.
Footnotes
Appendix A: Images and Words Used in the IAT and BIAT
Response Time Means and Factor Loadings for All Evaluation Words.

| Evaluation Word | Female Means | Male Means | Factor Loadings | Evaluation Word | Female Means | Male Means | Factor Loadings |
|---|---|---|---|---|---|---|---|
| Glad | 1.24 .98 |
1.29 .96 |
.397 .384 |
Angry | 1.39 1.08 |
1.46 1.05 |
.310 .386 |
| Pleasure | .72 .66 |
.73 .70 |
.537 .460 |
Rotten | .79 .74 |
.82 .70 |
.457 .499 |
| Beautiful | .70 .69 |
.70 .70 |
.622 .501 |
Failure | .74 .74 |
.72 .72 |
.498 .536 |
| Delightful | .73 .70 |
.75 .71 |
.505 .492 |
Tragic | .78 .74 |
.79 .80 |
.483 .465 |
| Friend | .79 .68 |
.82 .70 |
.546 .353 |
Awful | .70 .71 |
.70 .67 |
.605 .473 |
Funding
The author(s) disclosed receipt of the following financial support for the research, authorship, and/or publication of this article: This work was supported in part by the U.S. Army Research Office/Army Research Laboratory (W911NF-17-1-0519) and the National Science Foundation (SES-1917256). The views expressed are those of the authors and should not be attributed to the funding agencies.