
Abstract
Social infrastructure (SI) may buffer against suicide risk by improving social cohesion, social support, and information and resource sharing. The authors use an ecological approach to examine the relationship between county-level SI availability and suicide rates among working-age adults (25–64 years) in the United States, a population among which suicide rates are high, rising, and geographically unequal. Mortality data are from the National Vital Statistics System for 2016 to 2019. SI data are from the National Neighborhood Data Archive for 2013 to 2015 and capture the availability of typically free SI (e.g., libraries, community centers) and commercial SI (e.g., coffee shops, diners, entertainment venues). Results from negative binomial models show that suicide rates are significantly lower in counties with more SI availability, net of county demographic, socioeconomic, and health care factors. This relationship held for both typically free and commercial SI. Policy makers should consider strengthening existing and developing new SI as part of a broader strategy to reduce suicide rates in the United States.
Suicide is the sixth leading cause of death among working-age adults (25–64 years) in the United States (Centers for Disease Control and Prevention 2023). A recent report from the National Academies of Sciences, Engineering, and Medicine (Becker, Majmundar, and Harris 2021) concluded that suicide was among the main causes of death driving the recent decline in life expectancy among U.S. working-age adults and the nation’s divergence in life expectancy from other high-income countries. Suicide rates also vary tremendously across the United States, with much higher rates in some places than others (Becker et al. 2021; Kegler, Stone, and Holland 2017; Keyes et al. 2024; Zhang and Monnat 2024). Understanding the factors that contribute to this geographic variation is critical for informing prevention efforts (Brådvik 2018; National Institute of Mental Health 2023). In this study, we examined the relationship between county-level social infrastructure availability (i.e., free, publicly available, and commercial social venues that facilitate the formation and maintenance of social ties, such as libraries, coffee shops, diners, sport facilities, and religious organizations) and suicide rates among U.S. working-age adults.
A multidimensional and multilevel set of factors from the individual level to the macrostructural level contribute to suicide ideation, attempts, and mortality (Becker et al. 2021; Fazel and Runeson 2020). Such factors include mental health, family history of suicide, trauma, adverse childhood experiences, pain, substance use, access to lethal means, inadequate access to health care, unhealthy social relationships, individual and place-level economic disadvantage, lack of social support, various features of the built, physical, and social environments, macroeconomic shocks, and government policies (Anestis and Anestis 2015; Burgard and Kalousova 2015; Fazel and Runeson 2020; Feldmeyer et al. 2022; Kaufman et al. 2020; Keyes et al. 2024; Opoliner et al. 2014; Phillips 2013; Phillips and Nugent 2014; Steele et al. 2018; Steelesmith et al. 2019; Zhang and Monnat 2024).
However, these risk factors can be moderated by place-level cultural mechanisms that can either disrupt or exacerbate their effects (Abrutyn and Mueller 2018). Social support and social capital are among the most endorsed social protective factors (Phillips 2013; Recker and Moore 2016; Smith and Kawachi 2014). Ecological approaches are commonly used to understand how place-level factors, such as community social support and cohesion, shape collective risk for mortality (Feldmeyer et al. 2022; Phillips 2013; Steelesmith et al. 2019). These studies often point to Emile Durkheim’s (1897) work on suicidality (Hood-Williams 1996; Mueller et al. 2021; Smith and Kawachi 2014). Durkheim proposed that social integration and social ties buffer against suicide risk given their role in facilitating social belonging and inclusion, particularly during periods of rapid social change. Social cohesion captures the extent of social bonds within a community (Carrasco and Bilal 2016). Previous work has demonstrated that there is a positive relationship between social cohesion and mental health (Kingsbury et al. 2020; Robinette et al. 2021; Rotenberg, Anderson, and McKenzie 2020). Social cohesion can help shape collective mental health through the development of strong and weak ties, feelings of belonging and connectedness, and mutual cooperation and shared goals (Schiefer and Van der Noll 2017).
Social infrastructure is receiving increased attention for its role in facilitating social cohesion, social support, and the sharing of information and resources and in buffering against social disorganization (Domenech-Abella et al. 2020; Klinenberg 2018; Rhubart, Kowalkowski, and Wincott 2023). Social infrastructure represents the physical places where people can gather to exchange information, build and maintain relationships, and access resources. They are sometimes referred to as “third places” (i.e., social places and activity spaces other than work and home) (Oldenburg 2014), where a wide variety of people can easily and routinely connect with one another, “exchange ideas, have a good time, and build relationships” (Butler and Diaz 2016). Research shows that third places generate social cohesion and neighbor interaction (Williams and Hipp 2019). Free and lost-cost social infrastructure in particular (e.g., coffee shops and libraries ) can facilitate relationship building and resource and information sharing across groups with limited resources, factors that can reduce mental health risks (De Silva et al. 2005; Whitley and McKenzie 2005).
These places may be particularly important for working-age adults, as families and workplaces become more nuclearized and subsequently more isolated from the community (Oldenburg and Brissett 1982). There has been an increase in psychological distress among U.S. working-age adults in recent decades (Blanchflower and Oswald 2020; Case and Deaton 2020; Daly 2022; Gaydosh et al. 2019; Goldman, Glei, and Weinstein 2018; Muennig et al. 2018). Scholars have pointed to various explanations for this trend, including industrial restructuring and wage stagnation, declines in labor force participation and marriage rates, reduced workplace autonomy, flexibility, and creativity, and the rise of remote work as each contributing to a reduced sense of purpose, meaning, and identity among working-age adults (Case and Deaton 2020; Cherlin 2014; Daly 2022; Monnat 2019; Shanahan et al. 2019; Thompson 2019). In the context of these changes to the institutions of work and the family, social infrastructure may offer a critical alterative to achieving purpose, meaning, social connection, and identity, and therefore could be central in buffering against suicide risk.
Importantly, social infrastructure helps foster social cohesion that transmits collective benefits beyond specific users of the social infrastructure (Finlay et al. 2019, 2022; Kingsbury et al. 2020). For example, communities with more social infrastructure have more social cohesion and support, civic participation, and access to resources; lower crime rates; improved disaster response; and better average cognitive and physical health (Domenech-Abella et al. 2020; Finlay et al. 2022; Kawachi and Berkman 2000; Klinenberg 2018; Rhubart et al. 2023; Speer, Jackson and Peterson 2001; Walton 2014). However, social infrastructure is not evenly distributed across the United States. For example, counties with higher poverty rates and larger shares of minoritized racial and ethnic groups and some types of rural communities have less social infrastructure (Rhubart et al. 2022). Given the important roles of social support and social cohesion in buffering against suicide risk, geographic disparities in social infrastructure may contribute to geographic disparities in suicide among working-age adults.
In this paper, we draw on Durkheim’s early work and the concept of social cohesion and use an ecological approach to examine the relationship between social infrastructure availability and county-level suicide rates for working-age adults (25–64 years) in the United States for 2016 to 2019. We hypothesize that suicide rates will be lower in counties with more social infrastructure availability.
Materials and Methods
Data Source and Preparation
Our unit of analysis is the county. Counties are the smallest geographic unit for which suicide data are available nationally. Analyses included 3,141 counties. Kalawao County, Hawaii is excluded because mortality data are not available for that county. Mortality data are from the restricted-use death certificate files from the National Vital Statistics System for 2016 to 2019. These data identify causes of death and county of residence from all death certificates filed in the United States. We calculated suicide deaths for U.S. residents ages 25 to 64 years whose underlying cause of death was listed as suicide on the basis of the International Classification of Disease, 10th Revision, codes X60-X84 and Y87.0. We limited our analysis to 2016 to 2019 because this range (1) preceded the coronavirus disease 2019 (COVID-19) pandemic, which dramatically affected mental health as well as the availability and use of social infrastructure and (2) provided a sufficient range of years to prevent annual anomalies, particularly in small-population counties, from biasing the results (Becker et al. 2021; Monnat et al. 2019).
Social infrastructure data are from the National Neighborhood Data Archive (NaNDA) for 2013 to 2015. We chose these years to allow for a lag between exposure to social infrastructure and suicide (Cummings 2012). Although NaNDA social infrastructure data are available at the census tract level, we aggregated the data to the county level for two reasons. First, this approach aligns the social infrastructure data with the county-level suicide data. Second, counties serve as important administrative units that enact policies and deliver services that affect health and mortality.
We computed counts of typically free social infrastructure (i.e., religious organizations, civic organizations, libraries, and social services), commercial social infrastructure (i.e., food and beverage third places; creative, athletic, and entertainment third places; and personal services), and total social infrastructure. These establishments are considered social infrastructure because they are social and activity spaces that facilitate interaction, social cohesion, relationship and trust building, and information and resource sharing (Butler and Diaz 2016; De Silva et al. 2005; Oldenburg 2014; Whitley and McKenzie 2005). These categorizations have been used in prior research (Fraser et al. 2024; Rhubart et al. 2022). The full list of social infrastructure types is shown in Appendix Table A1. We averaged county social infrastructure counts over the period from 2013 to 2015 and used those averages to calculate area-based densities (per 100 square miles) of social infrastructure.
We controlled for the following county-level characteristics that may conflate observed relationships between social infrastructure and suicide rates: percentage Hispanic, percentage non-Hispanic Black, percentage of the population 25 and older with a bachelor’s degree or higher, poverty rate, percentage of people with health insurance, whether the county is designated as a mental health care provider shortage county, whether the county is designated as a primary health care provider shortage county, and metropolitan status. Demographic and socioeconomic covariates are from the American Community Survey 5-year estimates for 2011 to 2015 (U.S. Census Bureau 2016). Data on primary and mental health care provider shortage designations are from the 2015 Social Determinants of Health Database (Agency for Healthcare Research and Quality 2023). Metropolitan status is based on the U.S. Department of Agriculture Economic Research Service’s 2013 rural-urban continuum codes (U.S. Department of Agriculture, Economic Research Service 2020). Counties with rural-urban continuum codes 4 to 9 are defined as nonmetropolitan. Descriptive statistics are shown in Table 1. We also present maps showing the distribution of county-level suicide rates and social infrastructure density (Figures 1 and 2).
Descriptive Statistics.

Note: N = 3,141 counties.
National Vital Statistics System, 2016 to 2019.
National Neighborhood Data Archive, 2013 to 2015.
American Community Survey, 2011 to 2015.
Social Determinants of Health Database, 2015.
U.S. Department of Agriculture Economic Research Service rural-urban continuum codes, 2013.
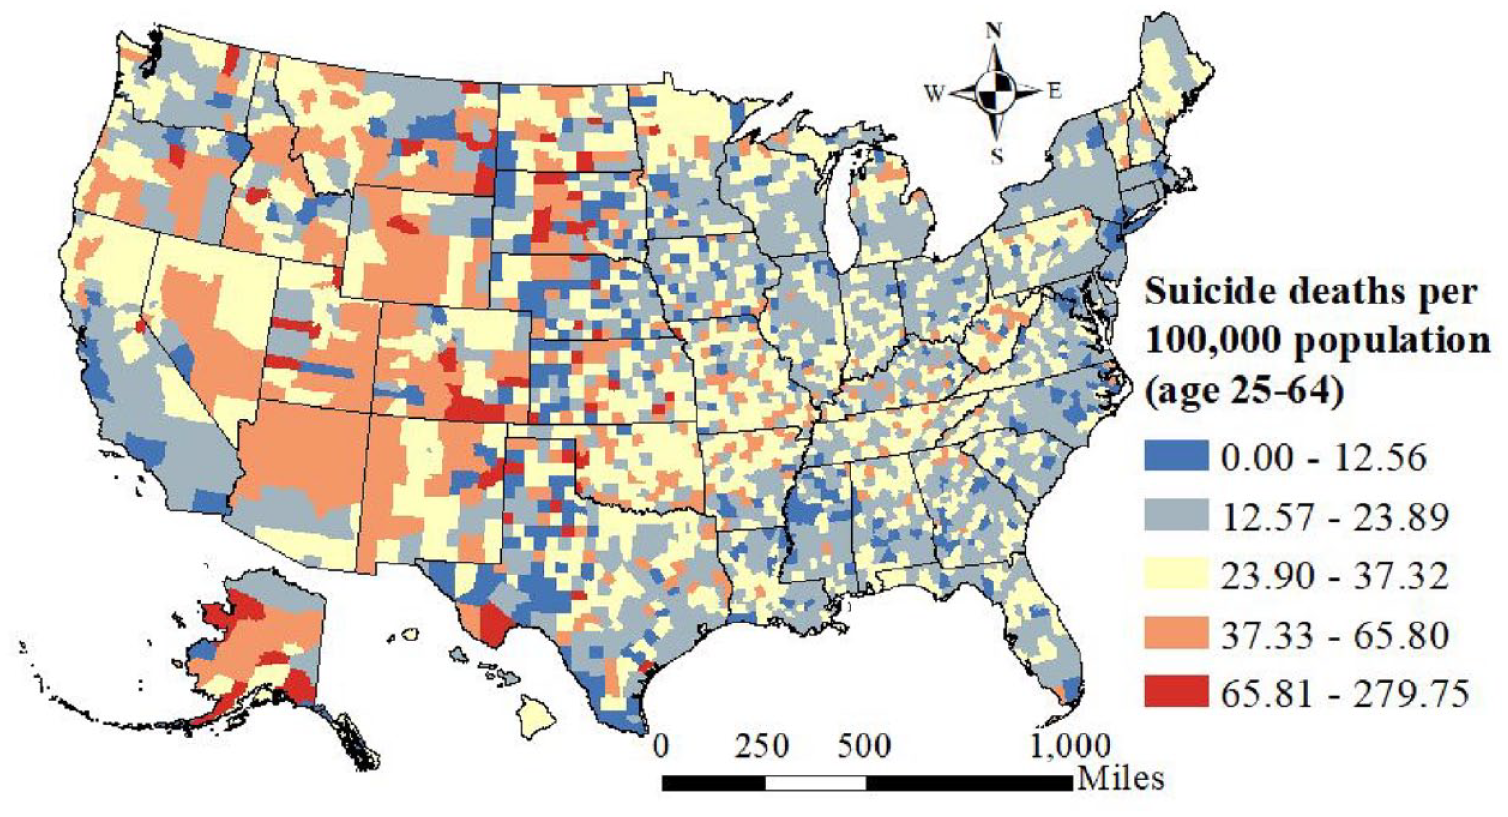
County-level distribution of age-adjusted suicide rates among U.S. working-age adults (25–64 years), 2016-2019.

County-level distribution of total, typically free, and commercial social infrastructure availability, 2013 to 2015: (A) county-level distribution of total social infrastructure availability, 2013 to 2015; (B) county-level distribution of typically free social infrastructure availability, 2013 to 2015; and (C) county-level distribution of commercial social infrastructure availability, 2013 to 2015.
Analytic Strategy
We used negative binomial regression models to predict county-level suicide deaths as a function of social infrastructure. Negative binomial regression accounts for the skewed nature of suicide counts (Carriere, Marshall, and Binkley 2019). We offset suicide deaths using the county population ages 25 to 64 years and included controls for county age distribution (percentage of the population ages 35–44, 45–54, and 55–64 years). Population data are from the Centers for Disease Control and Prevention’s bridged-race population estimates for 2016 to 2019 (U.S. Census Bureau and National Center for Health Statistics 2023). We weighted models with the log of the county population to provide nationally representative estimates and avoid inflating the influence of small population counties (Montez et al. 2022; Pierce and Schott 2020; Venkataramani et al. 2016), and we clustered standard errors at the state level. We standardized all predictor variables to a mean of zero and standard deviation of one to facilitate comparison of coefficients across predictors. We conducted all analyses in Stata/MP 17.0 (StataCorp, College Station, TX). We ran a robustness check using models that used a population-based measure of social infrastructure (number of social infrastructure units per 1,000 population) in lieu of the area-based measure. We discuss the results of this check after presenting our main results.
Results
There were 126,678 suicides among adults ages 25 to 64 years for the period from 2016 to 2019. The average age-adjusted suicide rate across counties was 25 deaths per 100,000 population (Table 1). Suicide rates were comparatively high in the western half of the United States, with lower rates in the northeastern, mid-Atlantic, and southern regions (Figure 1). As can be seen in Figure 2, social infrastructure is unevenly distributed across the United States, with much greater availability in the eastern half of the country and very limited availability in the West (except for counties containing major cities and the Pacific coastal region).
Negative binomial regression results are shown in Table 2. We present incidence rate ratios (IRRs) and 95 percent confidence intervals (CIs). The top panel (model 1) shows results from models that controlled only for county age composition. Suicide rates were significantly lower in counties with more total social infrastructure (IRR = 0.969, 95 percent CI = 0.96–0.98, p < .01), more free social infrastructure (IRR = 0.965, 95 percent CI = 0.95–0.98, p < .01), and more commercial social infrastructure (IRR = 0.972, 95 percent CI = 0.96–0.99, p < .01).
Results from Negative Binomial Regression Models Predicting Relationships between Social Infrastructure Availability and Suicide Deaths among U.S. Working-Age Adults (25–64 Years), 2016 to 2019.

Note: N = 3,141 counties. Models are weighted by the log of the county population and cluster standard error at the state level. Models include the population ages 24 to 64 years as an offset and control for county age distribution. All the predictor variables are z-score standardized. IRR = incidence rate ratio.
National Vital Statistics System, 2016 to 2019.
National Neighborhood Data Archive, 2013 to 2015.
American Community Survey, 2011 to 2015
Social Determinants of Health Database, 2015.
U.S. Department of Agriculture Economic Research Service rural-urban continuum codes, 2013.
p < .01.
The bottom panel of Table 2 (model 2) shows the results from the fully adjusted models. Although the social infrastructure coefficients are slightly attenuated relative to model 1, they remain statistically significant. Suicide rates were significantly lower in counties with more total social infrastructure (IRR = 0.983, 95 percent CI = 0.97–0.99, p < .01), free social infrastructure (IRR = 0.980, 95 percent CI = 0.97–0.99, p < .01), and commercial social infrastructure (IRR = 0.984, 95 percent CI = 0.97–0.99, p < .01). Interpreting the IRRs from model 2, 1-SD increases in total social infrastructure, free social infrastructure, and commercial social infrastructure are associated with 1.7 percent, 2.0 percent, and 1.6 percent fewer suicide deaths, holding all other variables constant. Although these percentages may seem small, when we consider that there were 126,678 working-age adult suicides nationally during the study period, a 1.7 percent reduction would have equated to 1,266 fewer lives lost.
In terms of covariates, counties with higher percentages of adults ages 25 and older with a bachelor’s degree, higher percentages of insured residents, and larger relative shares of Black and Hispanic populations had lower suicide rates. The poverty rate, health care provider shortages, and metropolitan status were not statistically significant, net of other covariates.
Results of Robustness Check
In our robustness check using a population-based social infrastructure measure in lieu of the density-based measure (Appendix Table A2), we found that total social infrastructure and commercial social infrastructure were related to fewer suicide deaths in the unadjusted model (model 1) but not in the fully adjusted model (model 2). This implies that the spatial distribution and coverage of social infrastructure at the county level may have a more substantial influence on suicide rates than the actual per-person quantity of infrastructure. Given that we rely on an ecological framework for these analyses that hypothesize that social support and social cohesion are the mechanisms through which social infrastructure availability might shape suicide rates, we argue that geographic availability is a more appropriate measure than per-person quantity. The density-based measure is also used in other studies to measure the availability of social infrastructure (Fraser et al. 2024) and social environment (Moore et al. 2013). In addition, the NaNDA data we used to measure social infrastructure is not able to capture the capacity (size or number of patrons) of these places, thus making per capita measures less reliable.
Discussion
Suicide is a preventable cause of death, and yet suicide rates among working-age adults in the United States are high, rising, geographically disparate, and have contributed to the nation’s stagnation in life expectancy in recent years (Becker et al. 2021). At the individual level, promoting social support and social cohesion are among the main strategies for preventing suicide (Centers for Disease Control and Prevention 2022). At the place level, social infrastructure such as libraries, coffee shops, civic organizations, sports and recreational outlets, religious establishments, and social services are key venues for building trust and social connections, the exchange of support and resources, and cultivating a sense of belonging in the community (Finlay et al. 2019; Zhang and Warner 2024). Related research shows that communities with more third places have higher levels of social cohesion (Williams and Hipp 2019) and that communities with higher levels of connectedness and trust have lower rates of mental health problems (De Silva et al. 2005; Whitley and McKenzie 2005). We build on that research by showing that counties with more social infrastructure had significantly lower average suicide rates among working-age adults from 2016 to 2019, net of county demographic and socioeconomic composition and health care provider availability. This finding held for both typically free social infrastructure and commercial social infrastructure. To our knowledge, this is the first empirical study to identify the role of social infrastructure on county-level suicide rates among working-age adults.
It was beyond the scope of this study (and the data that are available) to identify the specific mechanisms linking social infrastructure to suicide. However, there are several plausible mechanisms. Typically free social infrastructure, such as religious establishments, libraries, and community food services can increase access to resources and support for vulnerable populations who are at risk for suicide and help reduce the stigma associated with seeking help (Klinenberg 2018; O’Sullivan et al. 2013). Commercial social infrastructure, such as coffee shops, sports and recreational facilities, and barbershops, is a source of employment for individuals without college degrees, among whom suicide rates are higher (Phillips and Hempstead 2017). These places also facilitate relationship building, bonding, and the sharing of information (Arnade 2019). Our findings imply that both types of social infrastructure may buffer against the risk factors for suicide among working-age adults, a population that has experienced increases in psychological distress in recent decades (Blanchflower and Oswald 2020; Case and Deaton 2020; Daly 2022; Gaydosh et al. 2019; Goldman et al. 2018; Muennig et al. 2018). In the context of declining marriage rates (home as the first place) and labor force participation rates (work as the second place), social infrastructure (as third places) may be increasingly important for working-age adults to achieve a sense of purpose, meaning, and identity in life.
Our findings underscore the important role of local governments in supporting existing and developing new social infrastructure within the communities they serve. By encouraging cross-agency collaboration, local governments can partner with market-based services and social service agencies to increase the availability, access, and use of spaces that promote social interaction, share information, reduce social isolation, and foster a sense of belonging. In addition to helping reduce suicide rates, building more robust social infrastructure may also help reduce crime (Papachristos et al. 2011), support overall health (Walton 2014), and promote entrepreneurship, community economic development, and upward social mobility (Cabras and Mount 2017; Sharp et al. 2002).
Study Limitations and Directions for Future Research
These results should be considered in relation to some study limitations. First, our analyses are cross-sectional. As such, we cannot determine causality. Second, suicide is among the most commonly misclassified causes of death (Rockett et al. 2022). Our findings may be biased by geographic variation in misclassification if misclassification is more or less likely to occur in places with more or less social infrastructure.
Third, social infrastructure availability does not imply accessibility or use. Different types of social infrastructure may be inaccessible to certain groups, including those who are low income, minoritized racial and ethnic groups, and individuals with disabilities. We made the case in the introduction that social infrastructure transmits collective benefits beyond specific users because it increases overall social cohesion and helps reduce social disorganization (Finlay et al. 2019, 2022; Kingsbury et al. 2020). Nonetheless, given the ecological nature of this study, we cannot connect individual use of social infrastructure to suicide.
Fourth, the availability of social infrastructure could vary by place-level ethnoracial composition, socioeconomic composition, and rurality (Fraser et al. 2024; Rhubart et al. 2022). We encourage future research to explore these potential heterogenous associations. Fifth, we focused on working-age adults. Older adults and children may have distinct types and patterns of interaction with their local social and built environments (Nathan et al. 2018), such that the relationship between social infrastructure and suicide may be different in these age groups. Future research should consider the relationship between social infrastructure and suicide in these age groups for which different mechanisms may operate.
Finally, the COVID-19 pandemic highlighted the importance of social relationships and the psychosocial harms associated with reducing social interaction (Banerjee, Kosagisharaf, and Rao 2021). We encourage research that explores how the availability and use of social infrastructure changed during and after the pandemic and how those changes may have influenced suicide rates.
Conclusion
This research highlights the importance of social infrastructure on county-level suicide rates among working-age adults in the United States. We provide evidence that suicide rates are lower in counties with more social infrastructure availability, and this association holds for both typically free social infrastructure and commercial social infrastructure. Our results illustrate the need for policy makers to prioritize the maintenance of existing and development of new social infrastructure as part of a broader strategy to reduce suicide rates in the United States.
Supplemental Material
sj-docx-1-srd-10.1177_23780231241241034 – Supplemental material for Social Infrastructure Availability and Suicide Rates among Working-Age Adults in the United States
Supplemental material, sj-docx-1-srd-10.1177_23780231241241034 for Social Infrastructure Availability and Suicide Rates among Working-Age Adults in the United States by Xue Zhang, Danielle C. Rhubart and Shannon M. Monnat in Socius
Footnotes
Funding
The author(s) disclosed receipt of the following financial support for the research, authorship, and/or publication of this article: This work was funded by the Interdisciplinary Network on Rural Population Health and Aging (National Institute on Aging grant R24 AG065159) and the National Institute on Drug Abuse (grant U01 DA055972) and supported by the National Institute on Aging (grants P30 AG066583 and 2R24 AG045061) and the Rural Population Research Network (a Department of Agriculture–funded multistate research network; grant W5001).
Supplemental Material
Supplemental material for this article is available online.
Author Biographies
References
Supplementary Material
Please find the following supplemental material available below.
For Open Access articles published under a Creative Commons License, all supplemental material carries the same license as the article it is associated with.
For non-Open Access articles published, all supplemental material carries a non-exclusive license, and permission requests for re-use of supplemental material or any part of supplemental material shall be sent directly to the copyright owner as specified in the copyright notice associated with the article.