
Abstract
Prior survey research has mostly centered on the psychological dispositions and political leanings associated with conspiracy beliefs rather than underlying and potentially consequential status dynamics. Drawing on prior scholarship and recent national survey data, I analyze the social patterning of conspiracy beliefs and their variations by several status attributes. Notably, and rather than the typical assumption that such beliefs are mostly held by those of lower education, my findings point clearly to a bimodal (U-shaped) distribution by socioeconomic status. Specifically, and unique to my results, there exists a cluster of graduate-degree-holding white men who display a penchant for conspiracy beliefs. Further analyses highlight important variation between specific beliefs, with distinctly taboo beliefs being exceptionally popular among those in this highly educated group—a pattern corroborated with additional data sources. I conclude by discussing potential mechanisms and avenues that future sociological work on conspiracy beliefs might consider.
Conspiratorial explanations are readily found in contemporary American discourse. It is for this reason, in fact, that social scientists have begun to treat conspiracy beliefs as important in their own right, mapping the psychological dispositions and political attitudes associated with them. But what of status dynamics, inequality, and their foundational connection to such beliefs? Prior modeling suggests that such views tend to be especially prevalent among those of lower education and income, a pattern that is often seen as tied to cognitive abilities and/or perceptions of threat. Yet questions about how best to understand such phenomena and account for potential substantive variations across lines of social status remain. Sociological inquiry, I suggest, can advance these conversations in meaningful ways.
My analyses build on recent work by Harambam (2020) and Uscinski and Parent (2014) and draw on recent and rich survey data derived from Enders, Uscinski, et al. (2023)—survey data particularly well suited to the questions at hand. As a national sample of 2,015 individuals with parallels to the demographic composition of the United States, these data include measures of educational attainment, income, ethnoracial category, and gender and controls for age, political orientation, religious attendance, and social media use. Most crucially, these data also include a wider range of types of conspiracy belief than most surveys, with 15 specific and unique belief prompts. Such richness in measurement along with significant variation across several dimensions of status allow for analyses of linear and nonlinear connections between background and belief. They also contribute to an important and more general sociological literature on beliefs, status, and inequality (e.g., see Hout and Fischer 2002; Hunt 1996; Kluegel and Smith 1986; Schieman 2010).
My results highlight a noteworthy U-shaped relationship between conspiracy beliefs and socioeconomic status (SES). Specifically, and relative to prior accounts that tend to emphasize lower SES individuals and groups, my findings show that high and low SES individuals tend to be relatively conspiratorial compared to those in the middle of the social class distribution. This finding, reported in my main analyses but consistent even when using alternative measurement strategies, is remarkably robust and is more attributable to educational background than to income. More detailed analyses show that heightened levels of conspiracy beliefs among those of higher SES are largely driven by white men with graduate degrees—white men who seem to have a notable affinity for especially taboo conspiratorial views.
My findings on the popularity of such views among the highly educated are corroborated with three additional survey data sets. Notably and particularly striking in this regard is that approximately a quarter of those who hold a graduate degree agree or strongly agree that “School shootings, like those at Sandy Hook, CT and Parkland, FL are false flag attacks perpetrated by the government,” around twice the rate of those without graduate degrees. Drawing on sociological literatures pertaining to rumor, threat, and informational access, I offer several plausible explanations and conclude by highlighting ways that future research might more deeply assess such explanations.
“Conspiracy” Conceptualization and Prior Findings
The term “conspiracy theory” remains controversial, as it has typically been used by social scientists to “[police] the borders of . . . intellectually competent actors versus paranoiacs” (Husting and Orr 2007:141; also see Orr and Husting 2018; Painting 2016; Scott 1993). I nevertheless use the label “conspiracy belief” in this article because it permits direct engagement with prior work on the topic (see especially Oliver and Wood 2014; Uscinski and Parent 2014) while also allowing for conceptual and analytic extension informed by sociological approaches.
Although what precisely constitutes a conspiracy can be a source of contention (e.g., Boltanski 2014; Harambam and Aupers 2017), I follow a definition largely standard to survey research on the topic, as noted in a recent and influential review piece: “a secret plot by two or more powerful actors” (Douglas et al. 2019:4; also see Pigden 1995). By this definition, of course, actual conspiracies do occur. Whether belief in a particular conspiracy is grounded in reality or is a complete fabrication is not relevant to this standard definition or to the aims of my analyses. Indeed, just as sociologists of religion do not occupy themselves with proving or disproving their research subject’s religious beliefs, sociological research on conspiratorial views generally does not engage in efforts to prove or disprove particular conspiracy beliefs (Grodzicka and Harambam 2021; Grusauskaite, Harambam, and Aupers 2022; Harambam 2020). Rather, the task at hand is to assess who subscribes to which beliefs and whether status dynamics are influential to these patterns (e.g., Hunt 1996; Schieman 2010).
In terms of prior research, analyses have largely focused on individual dispositions. A common theoretical framing centers on the idea that a more or less stable psychological disposition, often referred to as “conspiracy thinking” or “conspiracy mentality,” underlies such beliefs (Enders, Uscinski, et al. 2023; Uscinski and Parent 2014). A recent meta-analysis, for instance, emphasizes the role of paranoia, schizotypy, narcissism, and other antisocial personality traits (Bowes, Costello, and Tasimi 2023). Research regarding political orientations typically finds that those on the binary political edges (far left or far right) generally report higher rates of conspiratorial beliefs (Imhoff et al. 2022; van Prooijen, Krouwel, and Pollet 2015). Even though such rates seem to vary across social groups, it is suggested that such beliefs should be considered a form of popular knowledge (Birchall 2006) given that most people believe in some conspiracy or another (Goertzel 1994; Oliver and Wood 2014).
Most directly relevant to my analytic focus are potential social status divides and whether and how they may be pertinent. Regarding gender, some studies have found that men are more conspiratorial (e.g., Freeman and Bentall 2017), whereas others have found no gender differences (e.g., Uscinski and Parent 2014). Researchers typically find higher rates of conspiratorial beliefs among African Americans (e.g., Goertzel 1994). This is particularly the case when it comes to medical-related conspiracies (Ross, Essien, and Torres 2006; van Mulukom et al. 2022)—a pattern that can be tied to historical and contemporary discrimination, abuse, and neglect by medical institutions (Burton 2023; Frazier 2020; Heller 2015; Jaiswal and Halkitis 2019; Washington 2006).
Regarding SES and education in particular, most studies find that higher levels of education are associated with lower levels of conspiracy belief (Douglas et al. 2016; Freeman and Bentall 2017; Uscinski and Parent 2014). This pattern is echoed in terms of income, with findings mostly pointing to a negative relationship (Douglas et al. 2019; Uscinski and Parent 2014). Two types of explanations are offered in this regard. The first is cognitive in nature and surrounds critical, rational, or complex thinking skills (Lantian et al. 2021; Swami et al. 2014; van Prooijen 2017). When one thinks of conspiracy beliefs simply as false beliefs, this approach has apparent conceptual utility. Yet when using a standard definition, as does most work cited thus far, theoretical problems and ambiguity quickly emerge (e.g., Coady 2012; Dentith 2019). Why, for instance, would it be strictly irrational (or uncritical) 1 to believe that powerful people do things in secret to accomplish common goals? Perhaps it would be unreasonable to see all of social reality as the consequence of such covert elite action (Pigden 1995). Yet, it would be similarly unreasonable to think that the powerful never coordinate behind closed doors. 2
Complex thinking may offer a more straightforward logic: Social reality could presumably become simpler when one sees events strictly as consequences of agentic elite action rather than an amalgamation of many interacting social forces (Barkun 2003). A conceptual problem nevertheless remains: Even though some conspiracy beliefs simplify social reality, others greatly complicate it. A glance at the intricate and sprawling power networks mapped by QAnon adherents (Hannah 2021) or at long-standing conceptual and artistic practices in the conspiracy milieu (e.g., Brussell et al. 2014; Lombardi and Min 2003) should cast doubt on the assumption that conspiracy beliefs uniformly reduce complexity in one’s understanding of the social world.
The second set of explanations offers a different account, centering around experiences (or perceptions) of threat and powerlessness. To believe oneself to be a victim of conspiracy is indeed to feel a threat stemming from powerful and clandestine forces. Conspiracy beliefs are here understood to functionally be “weapons of the weak” (Uscinski and Parent 2014:17)—that is, such beliefs offer a strategic logic that unifies actors around a shared external threat, allowing them to “revamp and recoup” following defeat and/or when facing exclusions from power. This interpretation is supported by recent psychological meta-analyses (Biddlestone et al. 2022; Bowes et al. 2023), international comparisons of social threat and conspiratorial prevalence (Cordonier, Cafiero, and Bronner 2021), analyses of Google search data that show increased interest in political conspiracies during times of threat and insecurity (DiGrazia 2017), and recent examinations of Twitter data that demonstrate how users make more conspiracy claims as threat intensifies (in this case proxied by COVID-19 case numbers; Greve et al. 2022). Such findings also align with the idea that rumors thrive in contexts of threat (Fine and Difonzo 2011).
This recent focus on threat and powerlessness marks an important turn—a turn that signifies a theoretical shift toward the psychological, sociological, and political functions of such phenomena. Yet this line of thought does not exclude the possibility that one might witness a concentration of conspiracy beliefs among those with relative power or status. Indeed, as scholars of inequality (e.g., Blalock 1967; Blumer 1958; Bobo and Hutchings 1996) have long noted, those of higher status are hardly immune from feelings of threat, particularly in the face of social change. Correspondingly, social scientific analyses should not necessarily assume that conspiratorial views are strictly concentrated among the poor or lesser educated.
Consistent with the aforementioned point, advantaged groups and individuals often worry about losing their social positions and resources in the face of social upheaval (e.g., Andrews 2002; Hollander and Einwohner 2004; Tolnay and Beck 1995). Moreover, those with high educational attainment may feel that the value of their degree is depreciating (Tomlinson 2008), due to either the growing pool of degree holders (Posselt and Grodsky 2017) or changing attitudes towards degree-granting institutions (Gallup 2023). Men, for their part, may feel threatened by challenges to status in general (Ridgeway 2014) and emergent gaps in college completion in particular (DiPrete and Buchmann 2013). White Americans likewise may feel threatened by affirmative action policies (Bobo 1998), immigration (Wilson 2001), demographic population shifts (Abascal 2020; Craig and Richeson 2014), and growing minority compositions generally (Blalock 1967). In short, lower status individuals and groups may use conspiracy beliefs to make sense of their status or of a changing social world, but so too may those of advantaged statuses—particularly in the face of perceived threat.
The Content of and Variations in Conspiracy Beliefs
Although much prior research treats conspiracy beliefs as part of a singular tendency regardless of belief content or the social positions of those who tend to hold them, recent empirical findings have begun to complicate such conceptions. Using an alternative version of the data set used in the current study, researchers recently engaged in cluster analysis to assess whether there may be discrete groupings (e.g., science/medicine conspiracy beliefs, unpopular/“aggressive” conspiracy beliefs, etc.; see Enders et al. 2021). Importantly, findings indicate the presence of distinct belief clusters with substantively varying relationships to political and psychological indicators.
Such findings align with a growing body of evidence that conspiracy beliefs are more varied in their content and (sub)cultural connections than previously thought (e.g., Grusauskaite et al. 2023; Harambam and Aupers 2017, 2020) and, consequently, that the specific beliefs included (or not included) on surveys have major implications for substantive findings (Enders and Smallpage 2018). In short, such work casts doubt on past “seemingly universal claims” about the correlates of conspiracy beliefs in general (Enders et al. 2021:256). Less clear—and the focus of analyses to follow—is whether variations by status are likewise observable if not substantively important. Sociological literature on rumor is particularly informative in this regard.
Scholarly attention to rumor, understood as institutionally unverified information 3 (Fine, Campion-Vincent, and Heath, 2005), has long acknowledged that individuals of different social positions often hold distinct beliefs—beliefs driven not merely by variations in internal dispositions but also by inequalities in status and informational access. The Rodney King beating and consequent rebellions, for instance, spawned two distinct sets of rumors (Davis 1993; Fine and Turner 2004). Residents in a minority concentrated neighborhood encountered rumors that a white racist group called the Vikings had been orchestrating abuse and torture at the local sheriff’s station. 4 Simultaneously, white LA suburbanites encountered rumors that the local street gangs had unified and were planning a raid on the affluent suburbs if the verdict went the wrong way.
Such differences in the content of rumors are attributed to availability and plausibility structures (Berger 1969; Maines 1999); to believe a rumor, one must first encounter it and then find it plausible. Because networks of relationships tie people to one another and networks of reference tie claims to previously encountered claims, networks shape both processes such that homophily yields segregated sets of rumors. If we similarly understand and conceptualize conspiracy claims to be a form of rumor, as do foundational rumor scholars (Fine 2021), then it is plausible that one might observe similarity among members of a given status and/or distinctions (perhaps in belief content) across lines of status. These are precisely the possibilities that my analyses explore.
First, I assess specifically whether there are status divides, particularly by education and income, when it comes to who generally holds conspiratorial views. This is implied by the bulk of prior aggregate research, which (despite not considering nonlinear effects) typically highlights a concentration of conspiratorial beliefs among poorer and lower educated individuals and groups. Second and no less important, my analyses disaggregate and explore variations in the content of conspiratorial beliefs and assess whether there are observable and unique patterns across the socioeconomic divide specifically.
Data and Measurement
My analyses draw on survey data collected in March 2020 (Enders, Uscinski, et al. 2023) using a sample of adults who matched the 2010 U.S. census in terms of race, sex, age, and income (N = 2,015). The original data set had 2,023 respondents; 8 respondents were dropped due to missing values on relevant variables. The survey itself was administered by Qualtrics, who partnered with Lucid and Dynata in building an online panel that paralleled census records. These data have been widely used in psychology and political science literatures on conspiratorial views, including work that has appeared in relatively high visibility outlets, including but not limited to Political Behavior, Journal of Social and Political Psychology, PloS One, and Harvard Kennedy School Misinformation Review (see Enders et al. 2021; Enders, Uscinski, et al. 2023; Uscinski et al. 2020; Uscinski, Enders, et al. 2022).
If conceptualizing conspiracy beliefs is difficult, meaningfully operationalizing them is even more challenging. The beliefs measured in this survey by no means represent the universe of existing conspiracy beliefs. Rather, they reflect a selection of salient beliefs in the contemporary American context. Such measurement also reflects standard social scientific approaches while capturing a somewhat wider array of types of conspiracy beliefs than do many other studies and data sources (particular attention is usually given to science/medicine-related beliefs; for a review, see Goreis and Voracek 2019). Moreover, and unlike some other potentially relevant sources, these data include pertinent indicators of status, such as income, education, race/ethnicity, and gender, and potentially relevant controls (i.e., age, political polarization, religious attendance, social media use).
Conspiracy Beliefs
Fifteen prompts referencing specific conspiracy beliefs are included, with respondents selecting their level of agreement for each on a 5-point scale (strongly disagree, disagree, neither agree nor disagree, agree, strongly agree). Around half of respondents agreed or strongly agreed with the more popular prompts, such as “The one percent of the richest people in the U.S. control the government and the economy for their own benefit” (54 percent) and “Jeffrey Epstein, the billionaire accused of running an elite sex trafficking ring, was murdered to cover-up the activities of his criminal network” (50 percent). In contrast, some beliefs are less popular, such as “School shootings, like those at Sandy Hook, CT and Parkland, FL are false flag attacks perpetrated by the government” (16 percent) and “The number of Jews killed by the Nazis during World War II has been exaggerated on purpose” (15 percent). A full table of prompts and percentages of respondents agreeing is reported in Appendix Table A1.
My initial outcome of interest is a composite of 15 conspiracy belief items. Constructing a single general metric is standard practice among those using this or similar survey data (e.g., Enders, Uscinski, et al. 2023; Mancosu, Vassallo, and Vezzoni 2017; van Prooijen 2017). Principal factor analysis on these items yields an eigenvalue of 6.48 for the first factor (all other eigenvalues < .61), with all beliefs loading highly (between .4 and .8) on this sole factor. 5 An additional check similarly confirms the suitability of a single composite scale representing these prompts (α = .92). The resulting measure, constructed by adding the scores of all 15 items, considers the strength of each belief and the number of beliefs held. The resulting mean is 43.4, with a range of 15 to 75.
Notably, the conspiracy belief composite I use is barely associated with political party identification (correlation = .03), let alone general political orientation (correlation = .01). Similar to most other indicators of conspiracy beliefs in other data sets, however, it does show a somewhat stronger correlation (.09) with distance from the center of the typical political scale. Also noteworthy is the fact that 88 percent of respondents agreed or strongly agreed with at least one of the prompts. Such beliefs often go systematically undercounted by surveys, as demonstrated in recent experimental research (Uscinski, Smallpage, et al. 2022).
I also explored a second construction of the dependent variable to ensure the robustness of my main findings. In this regard, I used an alternative version of the same data set that includes 21 specific conspiracy prompts rather than 15 (Enders et al. 2021) but that does not offer as rich a set of controls. Results in this regard, particularly those having to do with SES effects and nonlinearity, parallel those reported in the following.
Status Indicators and Other Demographic Attributes
The data at hand include key indicators of status, most centrally, income, education, race/ethnicity, and gender. Annual household income is measured across seven categories (i.e., <$25,000; $25,000–$49,999; $50,000–$74,999; $75,000–$99,999; $100,000–$149,999; $150,000–$199,999; ≥$200,000) and is recoded at dollar midpoints, 6 using $335,000 for the final category. Education is measured across six distinct categories: less than high school, high school graduate or GED, some college but no degree (yet), two-year college degree, four-year college degree, and postgraduate degree (MA, MBA, MD, JD, PhD, etc.). I use this original measure in my main analyses, following other scholars who have used these data.
Alternative measurements of both income and education were also assessed. This includes the original categorical measure of income (1–7) rather than dollar midpoints, six separate dichotomous variables representing each educational attainment category rather than the ordinal scale, and a more continuous measure reflecting years of education for each category (10, 12, 13, 14, 16, 19). Results from analyses using these alternative measurement strategies resulted in findings similar to those reported in the following.
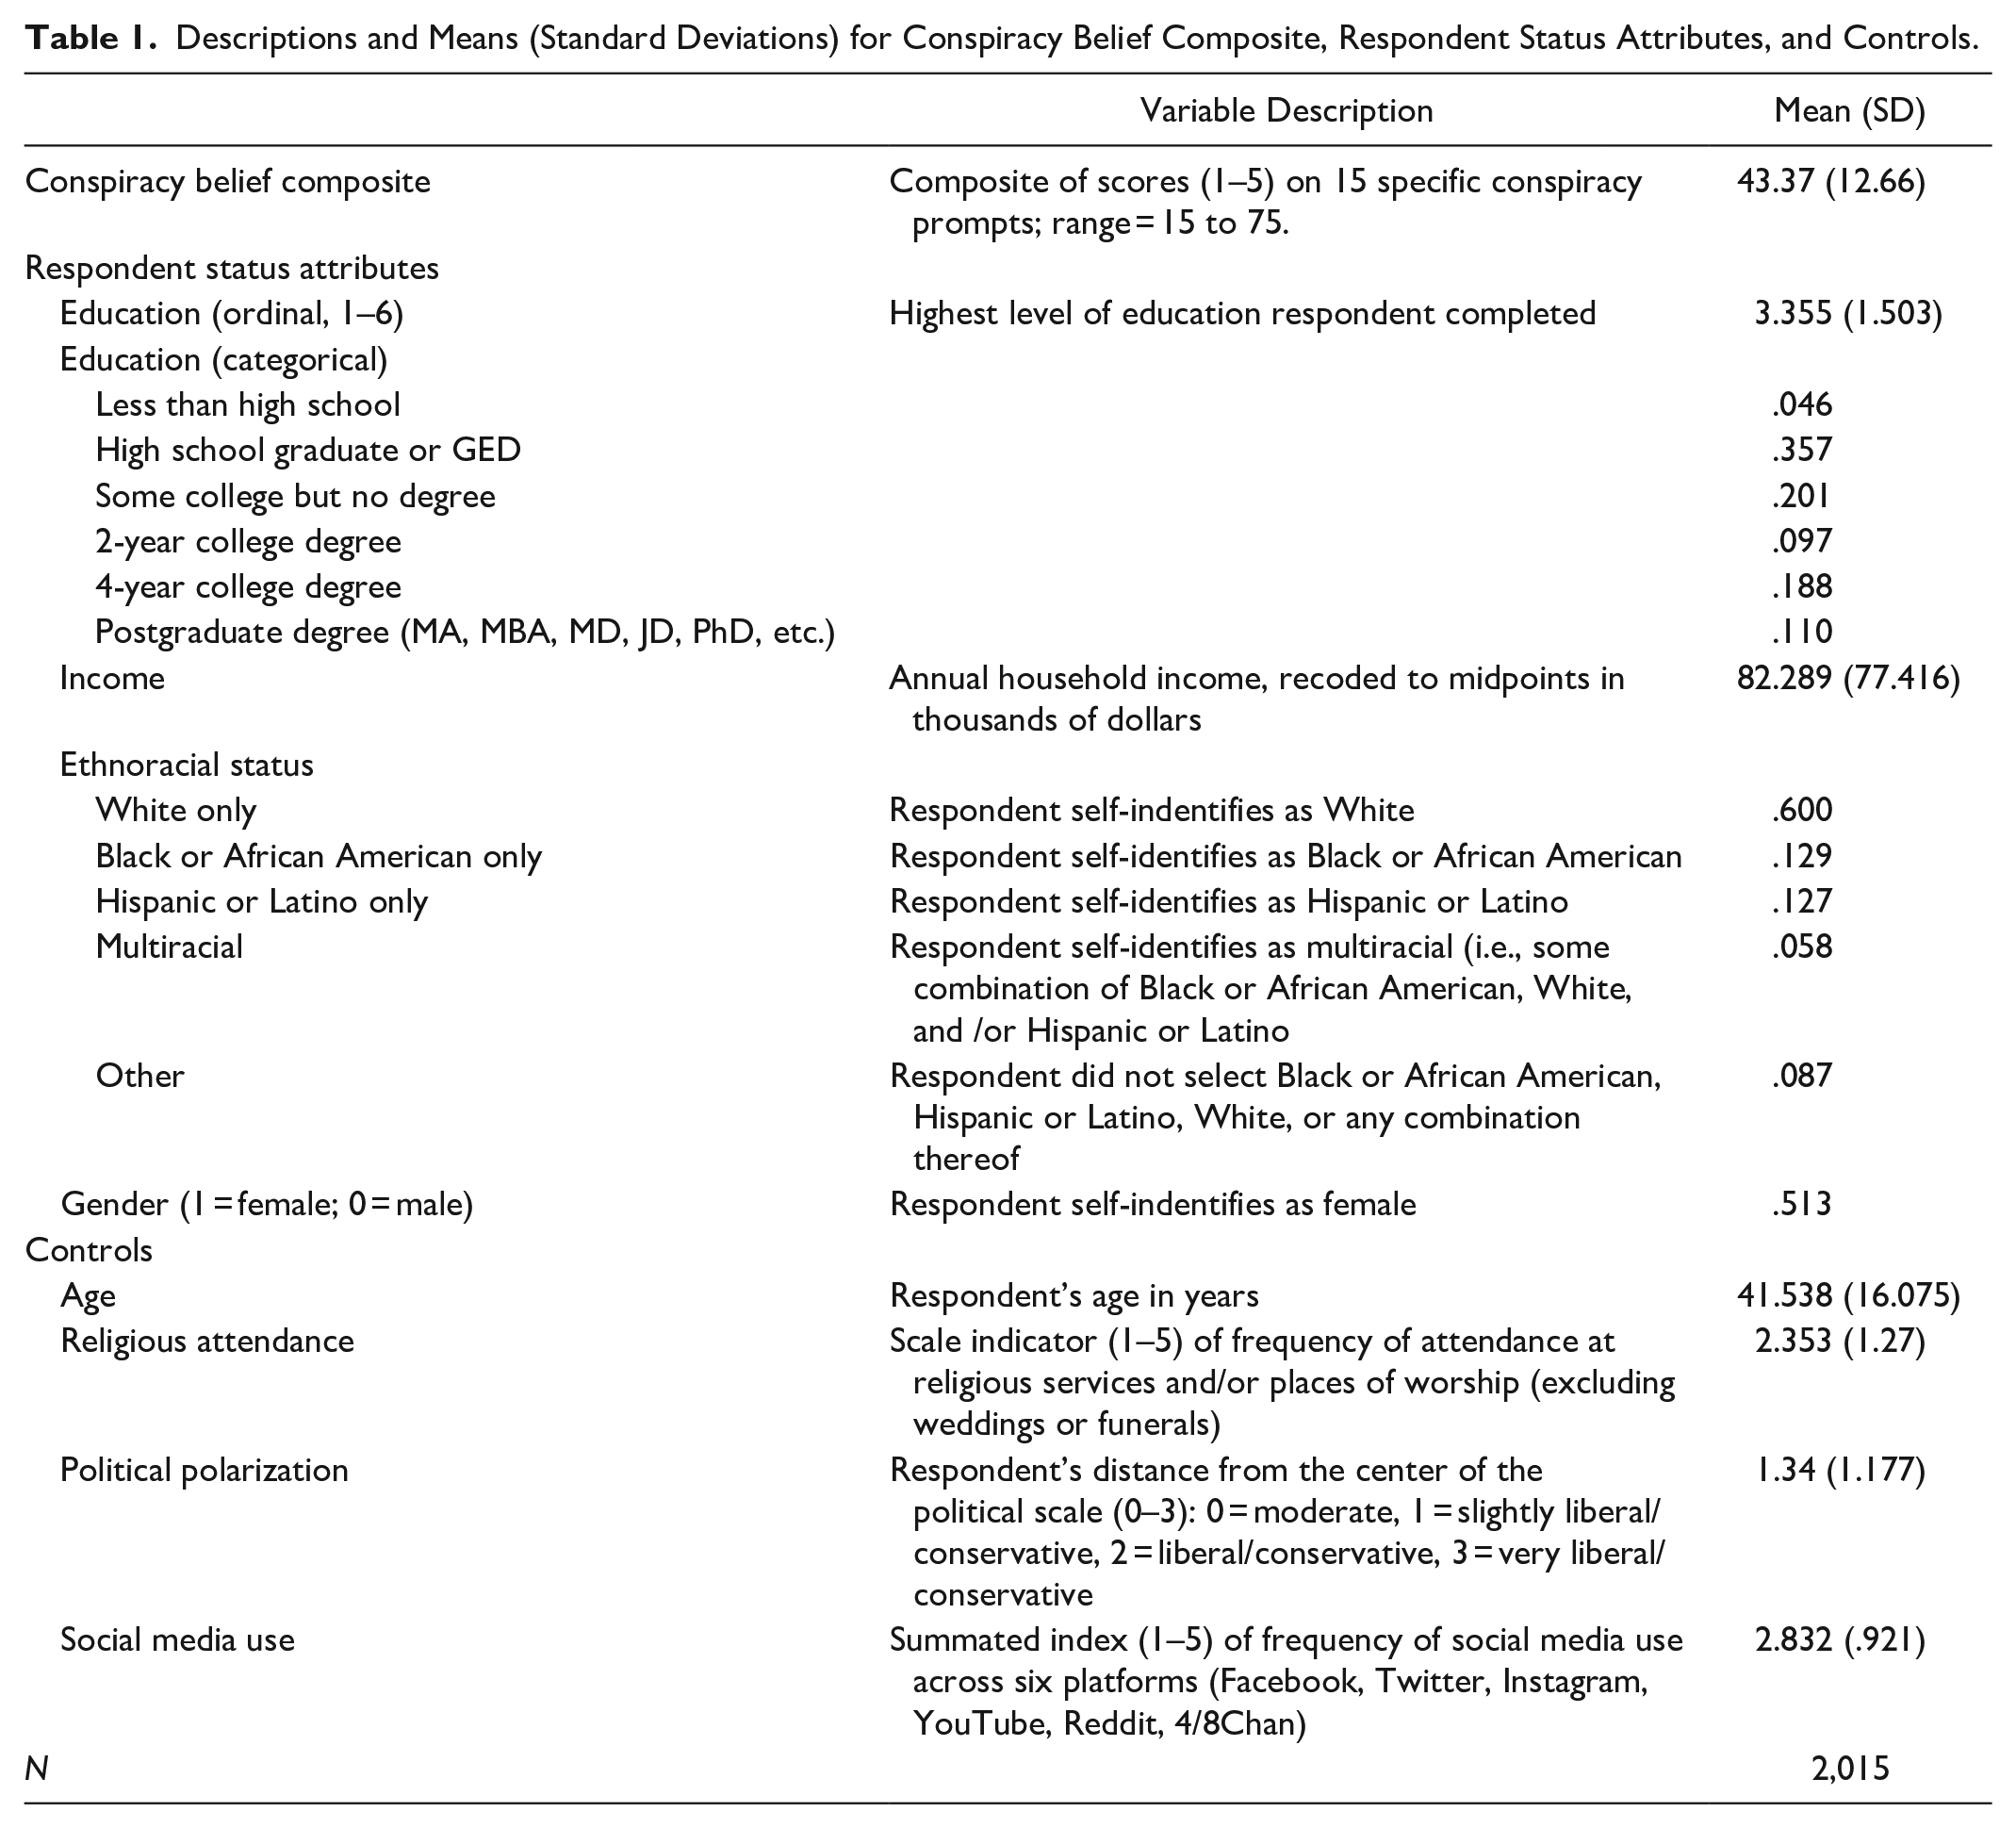
Race/ethnicity or ethnoracial category is derived from a prompt asking respondents to select any combination of White, Black or African American, Hispanic or Latino, Asian American or Pacific Islander, Native American or American Indian, and other. Specific indicators of Asian and/or Pacific Islander and Native American or American Indian were unfortunately not included in the available data set, such that respondents who fell solely into these categories are included in the other category. Responses were recoded into discrete indicators of White only, Black or African American only, Hispanic or Latino only, Multiracial (for those who selected some combination of those three), and other. Gender is self-identified and captured with a dichotomous indicator of male and female. Table 1 reports means and standard deviations for the conspiracy belief composite, income, education, ethnoracial status, and gender and background controls regarding age, political polarization, religious attendance, and social media use.
Descriptions and Means (Standard Deviations) for Conspiracy Belief Composite, Respondent Status Attributes, and Controls.
Political orientation, a potentially relevant background control, is indicated by a 7-point scale (very liberal, liberal, slightly liberal, moderate, slightly conservative, conservative, very conservative). Following prior findings (Imhoff et al. 2022; van Prooijen et al. 2015), I recode this into an indicator representing political polarization, measured as the distance from the center of the standard political scale (0 = moderate, 3 = very conservative or very liberal). I also control for religious attendance following prior work and theorization (Dyrendal, Robertson, and Asprem 2018). This is captured by how often one attends religious services or a place of worship (excluding weddings and funerals) and is measured ordinally (i.e., never, a few times a year, once or twice a month, once a week, every day).
Finally, the survey included prompts regarding respondents’ social media use by platform (Facebook, Instagram, Reddit, Twitter, YouTube, 4/8chan) and the frequency of use for each platform (not at all, once a month or less, several times a month, several times a week, every day). All measures of platform usage correlate positively with the conspiracy belief composite, albeit at varying levels. 7 Following other scholars who have used these data, social media use in my main analyses is captured by averaging these six platform measures into a single index ranging from 1 to 5. All data can be found in the replication materials of Enders, Uscinski, et al.’s (2023) study. My own replication code can be found in the supplemental materials.
Analytic Strategy And Results
I first offer an overview of the conspiracy belief composite, with attention to bivariate associations with SES and related descriptives. Specifically, I examine composite averages by educational attainment and household income levels. Compared to prior findings that tend to highlight an affinity for conspiracy beliefs among the poorer and less educated, my initial results suggest a noteworthy (nonlinear) U-shaped relationship between the conspiracy belief composite and both proxies for SES. I then assess whether the observed U-shaped pattern holds across ethnoracial and gender categories. I also briefly compare in these initial analyses highly educated white men who believe particularly unpopular conspiracies to their highly educated white male peers who do not.
The second portion of my analyses employs linear regression to assess more rigorously the links between conspiracy beliefs and status. Especially important is whether the bifurcated character of the SES relation holds with the inclusion of other status indicators and controls for age, political polarization, and social media use.
SES and Bivariate Associations with Conspiracy Beliefs
Figures 1 and 2 report associations between SES and the conspiracy belief composite. In contrast to prior analyses and emphases (Oliver and Wood 2014; Uscinski and Parent 2014), the observed relationship between SES and conspiracy belief is not entirely negative. It is instead nonlinear and shaped like a check mark. That is, there is a relatively steady decrease with SES but then a dramatic jump for those with graduate degrees and those earning $150,000 or more.

Bivariate association between conspiracy beliefs and education (N = 2,015).

Bivariate association between conspiracy beliefs and income (N = 2,015).
One can say (with 95 percent confidence) that those with graduate degrees tend to hold higher levels of these conspiracy beliefs compared to those with bachelor’s degrees. The same seems to be the case with those of household incomes of $150,000 to $199,999 compared to those in the income bracket below them.
Deeper interrogation of specific conspiracy prompts suggests interesting and divergent associations with SES. As one moves from more popular to less popular prompts, the gap between those with graduate degrees and everyone else grows (see Appendix Figure A1). Beliefs that are held by most respondents, such as those about Jeffery Epstein being murdered or the 1 percent controlling the government, are only marginally more popular among graduate-degree-holding respondents. In contrast, the two most unpopular beliefs measured—that is, beliefs regarding school shootings and the Holocaust—are around twice as popular among this highly educated subpopulation.
As shown in Table 2, 34 percent of the 222 graduate-degree-holding respondents agree or strongly agree that “School shootings, like those at Sandy Hook, CT and Parkland, FL are false flag attacks perpetrated by the government.” For readers unfamiliar with such terminology, a false flag attack is when an actor carries out an attack but blames it on some other actor (Griffin and Cobb 2023; Wilson 2015). In a similar vein and as reported in Table 3, 32 percent agree or strongly agree that “The number of Jews killed by the Nazis during World War II has been exaggerated on purpose.”
Responses to the Prompt “School Shootings, Like Those at Sandy Hook, CT and Parkland, FL Are False Flag Attacks Perpetrated by the Government” by Education Level (N = 2,015).

Note: χ2 = 69.45, p < .001.
Responses to the Prompt “The Numbers of Jews Killed by the Nazis during World War II Has Been Exaggerated on Purpose” by Education Level (N = 2,015).

Note: χ2 = 75.88, p < .001.
To corroborate these initial findings, I examined the three other data sets included in the same study 8 that likewise contain the school shooting prompt with the exact same wording as previously described. Taken together with the data used in my main analysis, these four data sets include 6,113 respondents. I use this combined data for a single supplementary analysis regarding this one prompt and report results in Table 4.
Responses to the Prompt “School Shootings, Like Those at Sandy Hook, CT and Parkland, FL Are False Flag Attacks Perpetrated by the Government” by Education Level, across Four Combined Data Sets (N = 6,113).

Note: χ2 = 124.00, p < .001.
Of the combined 827 graduate-degree-holding respondents, 26 percent either agreed or strongly agreed with the prompt about school shootings, again at roughly double the rate of non-graduate-degree-holding respondents (13 percent). Because white men are overrepresented among the highly educated, it is possible that these bivariate associations and patterns observed in the earlier figures might be a function of gender and ethnoracial differences in beliefs. I assess this possibility in Figure 3 by returning to my main sample of 2,015 respondents and analyzing white male respondents in comparison to female and minority respondents.

Bivariate association between conspiracy beliefs and education, comparing white men to all others (N = 2,015).
Figure 3 shows that it is not simply a matter of white men holding higher levels of conspiracy beliefs. Rather, and notably, it is white men with graduate degrees in particular who report higher rates compared to others in the SES distribution, including other white men. Further disaggregation (i.e., non-white men, white women, non-white women) shows either general decline or stagnation in such beliefs for other groups as education increases (see Appendix Figure A2). In sum, the upward curve on the right side of the SES distribution appears to be driven by a small and particularly conspiratorial slice of the sample: highly educated white men.
Further examination of this demographic offers clues as to plausible mechanisms. Forty-two percent of white men with graduate degrees agreed with both the school shooting and Holocaust prompts (referred to here as “Agree” respondents), whereas 40 percent disagreed with both (referred to here as “Disagree” respondents), providing a convenient line of comparison. How, if at all, do they differ? Despite limited sample sizes (50 and 48, respectively), a few differences are highly significant and thus worth mentioning. First, Agree respondents are concentrated on the political edges: 38 percent self-describe as “very liberal,” whereas 22 percent self-describe as “very conservative.” By contrast, of the Disagree respondents, 6 percent self-describe as “very liberal,” whereas 15 percent describe themselves as “very conservative” (see Appendix Table A2). This pattern highlights that these associations are not reflective of simple conservative political orientations. 9
Also worth noting is that Agree respondents use every social media platform at higher rates. Most strikingly, 60 percent of the Agree respondents access 4/8chan (anonymized imageboards) at least several times a week, in contrast to only 8 percent of Disagree respondents (see Appendix Table A3). Similarly, the Agree respondents are significantly younger than Disagree respondents, averaging 40 years old versus 54 years old, respectively. Lastly, 42 percent of Agree respondents report attending religious services or a place of worship every day, in contrast to 4 percent of Disagree respondents (Appendix Table A4). Despite limited sample sizes, these differences are all statistically significant—a point to which I return in my discussion of access dynamics and future research avenues.
The Relationship between Status and Beliefs, with Controls
Table 5 reports linear regression estimates of the conspiracy belief composite on SES and ethnoracial and gender attributes and key controls. Specifically, Model 1 includes education, income, ethnoracial category, gender, and age. Like most past research, the first model essentially assumes linearity regarding SES. Model 2 introduces square terms 10 to test for nonlinearity and specifically bifurcation across the educational and income distribution as observed earlier. Model 3 includes controls for religious attendance and political polarization, and Model 4 introduces the index of social media use. All models report robust standard errors.
Linear Regression Estimates (Robust Standard Errors) of Conspiracy Belief Composite by Education, Education Squared, Income, Income Squared, and Other Respondent Attributes.

p < .05. **p < .01. ***p < .001 (two-tailed tests of significance).
The bifurcation of conspiracy beliefs by socioeconomic status and the associated U-shape pattern noted earlier persist across the models reported. Education, while somewhat negative but nonsignificant in the linear sense, becomes highly significant when accounting for the split across lines of SES. Moreover, both education and its squared term remain significant even with the inclusion of religious attendance and political polarization (Model 3) and social media use (Model 4). Income and its square are not significant in these models, suggesting that education is the especially pertinent dimension of SES when it comes to such beliefs.
Importantly, the results reported thus far appear to be remarkably robust. 11 Because education is particularly central, I assessed two additional and alternative measurements. First, education was recoded into six separate dichotomous variables. I then reran Models 2, 3, and 4 using “four-year degree” as the reference category because the bivariate graphs suggest that it lies at the bottom of the U-curve. All models produced positive coefficients for every nonreference education indicator, with p values under .05 for “high school/GED” and “postgraduate degree.” I also modeled education continuously using average year midpoints for each category (10, 12, 13, 14, 16, 19). Models 2, 3, and 4 all yielded negative coefficients for the linear term and positive coefficients for the square term, with all respective p values being under .01. As in my main analyses, income and its square were not significant in these cases. 12
Alongside results pertaining to education and nonlinearity, these models also point to a higher prevalence of conspiratorial beliefs among African American respondents compared to white respondents—a pattern that aligns with some past findings (Oliver and Wood 2014) and that is likely tied to historical and contemporary processes of institutional exclusion, discrimination, and inequality (Burton 2023; Gillborn 2008; Guignion 2023; Jaiswal and Halkitis 2019). Focused and careful research regarding the ethnoracial dynamics of conspiracy beliefs unfortunately remains scarce, however, and sociological frameworks likely have much to offer in this regard (see Waters 1997).
Results surrounding gender lose some significance with the addition of the social media index but do remain quite significant, and remarkably, political polarization is reduced to nonsignificance. These changes make some substantive sense in so much as social media use is higher among men and even higher among those on the political edges. That men remain more conspiratorial even with the addition of numerous controls aligns with some past quantitative findings (Freeman and Bentall 2017). It also aligns with “conspirituality” theorization that suggests a cultural affinity for conspiracy beliefs among men and a complementary affinity for New Age beliefs among women (see Ward and Voas 2011). That those on the political edges are no more conspiratorial than moderates when accounting for social media use (and SES bifurcation and other relevant attributes) comes as more of a surprise. This finding in particular may be informative to the burgeoning literature on political orientations and conspiracy dispositions (Enders et al. 2021).
Overall, the aforementioned results suggest a persistent U-shaped pattern: Conspiracy beliefs are relatively common among high and low SES individuals but somewhat less so among middle SES individuals. This is clear in terms of education and income but, as evidenced by the results thus far, appears to be related more to education. Those with graduate degrees report higher rates of conspiracy beliefs, on average, than those with only a bachelor’s degree. This is especially true among white men, who, unlike other subpopulations, display a substantial increase in levels of conspiracy beliefs at the $150,000 or graduate degree level—especially when it comes to specific views about school shootings and the Holocaust. Other subpopulations see either stagnation or decreases in levels of conspiratorial views as education increases.
It is striking that 42 percent of white men with graduate degrees agreed with both the school shooting and Holocaust prompts on the survey while 40 percent disagreed with both. There are important and consequential divergences within this population—divergences that I hope future research will be able to assess more deeply. Specifically, those who agreed with both prompts are somewhat younger, around 3 times as likely to identify as “very liberal” or “very conservative,” 5 times as likely to regularly use 4 or 8chan, and 10 times as likely to attend religious services or a place of worship every day.
Discussion
The Importance of Status Dynamics and Conspiracy Beliefs
The relationship between SES and conspiracy beliefs seems to be more complicated than existing literature has revealed and comprises what was a puzzling U-shape at the outset. Because pertinent longitudinal survey data do not yet exist on this matter, 13 to my knowledge, conclusions regarding causality remain out of the scope of study. It might be the case that something about graduate degree attainment for white men prods them in a conspiratorial direction. Or, alternatively, those white men who are already inclined toward conspiratorial views could end up channeled into graduate training. Future data and research that more effectively capture causal sequence is certainly warranted.
Although my results regarding high rates of conspiracy beliefs on the left side of the educational U-curve align to some extent with past survey research (Oliver and Wood 2014; Uscinski and Parent 2014), it is worth explicitly considering possible methodological reasons why the right side of the SES-conspiracy distribution has been overlooked. One culprit may be differences in prompt selections. Conspiracy beliefs about school shootings and the Holocaust are seldom included in surveys, which more commonly give attention to science/medicine type conspiracies—that is, a conspiracy type that may be more commonly considered by lower SES individuals and/or African Americans (for relevant reviews, see Jaiswal and Halkitis 2019; van Mulukom et al. 2022). The sociological literature on this matter, however, is limited. More attention to such divergences would be useful and would likely help in making sense of group-specific differences and/or the extent to which substantive findings are shaped by prompt selections in surveys.
A second possibility centers on how educational attainment tends to be measured and used in such survey research. The highest category of educational attainment in several studies is “bachelor’s degree or more.” By pooling graduate degree holders with bachelor’s degree holders, such analyses may very well be conflating two populations that seem to differ dramatically in their levels of conspiratorial prevalence. Arguably related and potentially problematic, analyses to date often assume higher rates of conspiracy beliefs among the least educated and seldom test for nonlinearity.
My results surrounding status dynamics, specifically those regarding the highly educated, stand in contrast to more reductionist explanations about cognitive ability. Theoretical consideration and sociological accounts regarding perceptions of threat, on the other hand, seem to offer leverage that future analyses might more directly consider. On the left side of the U-curve, lower SES individuals certainly experience material threats and vulnerability in their daily lives and relatively limited trust in mainstream institutions (Rosenberg 2019). These threats along with their associated precarities, in fact, seem to be increasingly salient for those with less than a bachelor’s degree (Case and Deaton 2021). My findings hardly contradict this fact, nor do they contradict past findings of high levels of conspiracy beliefs among those of low income and/or education (Oliver and Wood 2014; Uscinski and Parent 2014). Rather, my results challenge us to give at least equal attention to those in the upper strata. Indeed, no less theoretically interesting, and perhaps even more so, is the right side of the U-curve regarding SES and conspiracy beliefs.
Whether white men with graduate degrees feel distinctly high levels of threat (in the face of affirmative action, for instance, or relative to governmental entities and decision-making) is an empirical question that future analyses should likely consider. At the very least, it is plausible that advantaged white men may perceive threats to group status stemming from increases in non-white individuals and women entering higher education and the labor market pool of graduate-degree holders specifically (DiPrete and Buchmann 2013; Posselt and Grodsky 2017). Shifting discourses and norms regarding ethnoracial status and gender, especially among the highly educated, may likewise shape perceptions of threat among these individuals.
Status and Particular Conspiracy Beliefs
Even if social contexts of perceived threat are conducive to conspiracy beliefs in general, a key question remains about why the highly educated favor especially unpopular beliefs about school shootings and the Holocaust. These are far from the least popular conspiracy beliefs in existence, so how do we best characterize them? Past scholarship has described these particular views as “aggressive,” “requiring a deep-seated antagonism towards government actors and Jews” (Enders et al. 2021:262). Although animus is certainly part of the story, the same scholars also note that paradoxically, this cluster of beliefs is the only cluster positively associated with trust in government, even when controlling for a host of sociodemographic variables. They are also statistically associated with antisocial attitudes (e.g., Machiavellianism, psychopathy, narcissism, supporting political violence, spreading false information online). The causal arrow regarding these attitudes might go either direction: Someone who already endorses political violence may be more charitable toward claims of the government perpetrating school shootings. Equally plausible is the possibility that belief in this sinister conspiracy might embolden one’s attitudes regarding political violence.
I offer a different characterization. Conspiracy beliefs about school shootings and the Holocaust are distinctly taboo; public statements regarding either would presumably prompt serious social sanction in most circles. Mentioning to your coworkers that you suspect 5G towers have a sinister purpose or that the government is hiding aliens may prompt looks of confusion or judgment. Telling your coworkers that Sandy Hook was perpetrated by the government or that the Holocaust death count was intentionally exaggerated, on the other hand, seems likely to elicit more serious penalties. Perhaps for high-status white men, agreeing with these beliefs on a survey and/or holding them more deeply allows respondents to feel that they have some sort of specialized and transgressive expertise or access to some particularly stigmatized knowledge (Barkun 2015) in the face of perceived threats to group status. Future work, especially in-depth interviewing, would be quite helpful in terms of clarifying such dynamics.
A complementary explanation might be that the adoption of specific conspiracy beliefs, particularly taboo ones, may also be a matter of who has access to specific conspiratorial information. Even if motivation produces a vague hunch that something is suspect, it seems unlikely that motivation alone is responsible for crystallizing suspicion into a distinct conspiratorial explanation. To put it simply, it is likely hard to believe that Sandy Hook was a false flag attack without having encountered that specific claim in some level of detail. It is even harder if you do not know what a false flag attack is. There are two likely paths to encountering such information, the first of which is relatively unintentional. Perhaps one hears the claim made by an acquaintance at a protest or within a political organization, from a friend at church, from a neighbor, or in some online space that one frequents. The demographic composition of one’s networks certainly shapes the probability of such an encounter, as evidenced by scholarship on rumor (Fine and Turner 2004; Maines 1999).
An alternative sequence is that some actors find this information by actively seeking it out. Indeed, “do your own research” has been the mantra of the conspiracy milieu in recent years (Birchall and Knight 2022; Reich 2014; Ward and Voas 2011). Although presumably anyone can find conspiratorial information regarding Jeffrey Epstein in only a few clicks, this process may be less simple for especially taboo beliefs. In 2019, videos that denied the Holocaust or claimed Sandy Hook was a false flag attack were banned from YouTube (Al Jazeera 2019; Darcy 2019), and search results now yield videos debunking such claims. Facebook and Instagram followed suit shortly after, prohibiting Holocaust distortion or denial and removing major figures that claimed Sandy Hook was a false flag (Bickert 2020; Lima 2019). As such, there is some barrier (even if small) for those who actively seek such information. Importantly, research on second-level digital divides has offered considerable evidence that so-called “online skill” in seeking information is not randomly distributed among the population. Rather, such “skill” seems to skew toward a similar population as that highlighted by my findings: relatively young white men with relatively high SES backgrounds (Hargittai 2010; DiMaggio and Hargittai 2001; van Dijk 2012). What “online skill” even means and how social scientists should use such a concept, of course, has become an increasingly complicated matter (Harambam et al. 2013; Litt 2013). At the very least, however, strategies for seeking information online are patterned in ways that align with the results reported earlier, and future scholarship disentangling the relations between social media use and conspiracy beliefs might additionally take status attributes into account.
Encountering a claim (accidentally or intentionally), of course, does not necessarily lead to a direct change in worldview, as in a simple media effects model (Shoemaker and Reese 1991; Enders, Uscinski, et al. 2023). Rather, the plausibility of the claim is assessed: the reputation and motivations of the claimant, the performance and tone of the claim, and how the claim situates among previously encountered claims (Fine and Turner 2004; Maines 1999). Such plausibility assessments are tied to dispositions, to be sure, but they are also deeply social, tied to valuations of who is trusted, what feels true, and what ideas seem useful. Such questions regarding plausibility assessments may be addressed more fully by synthesizing dispositional models with the rich symbolic interactionist literature on rumors.
Conclusions
This article and my results suggest that conceiving of conspiracy beliefs as “weapons of the weak” is wrong, or at the very least, inadequate if one considers and recognizes key variations across lines of socioeconomic status. Many individuals on the losing side of stratifying power relations report disproportionately high rates of these beliefs, at least compared to their college-going peers at the bachelor’s degree level. Yet white men with graduate degrees and high incomes report remarkably high rates of such beliefs as well. Conspiracy beliefs thus seem to be quite useful to both the “weak” and the “strong,” although perhaps somewhat less so for those that fall in between.
Importantly, variations between specific conspiracy beliefs are likewise observed. Individuals and groups of distinct statuses and social locations seem more or less likely to hold particular conspiratorial views. This should hardly come as a surprise to sociologists. Because such views are commonly used by individuals to make sense of the social world, it makes sense that they would tend to correspond to individuals’ social positions. My analyses here identify one such pattern. Relatively unpopular and perhaps taboo conspiracy beliefs appear to be held at significantly higher rates among highly educated white men. Other unique patterns undoubtedly exist and warrant deeper attention, to be sure. Locating such patterns and giving them careful sociological consideration is likely to prove fruitful both in shedding light on the social aspects of these phenomena and in understanding how people make sense of inequalities more generally.
Like any analyses, mine too have limitations that I hope future work might more effectively address. Similar to much survey data that measures conspiracy beliefs (for meta-analytic reviews, see Goreis and Voracek 2019; Pilch et al. 2023), the data that I have employed are cross-sectional and thus unable to speak directly and authoritatively to issues of sequence and causality. Moreover, although the data used in my main analyses include a relatively large pool of respondents, the number of graduate-degree-holding respondents is somewhat small given that these data parallel U.S. demographics. In an effort to ensure the findings presented are not the product of a single aberrant data set, I corroborated a core result using the three additional data sources included in the original study’s replication materials (Enders, Uscinski, et al. 2023). Those interested in further verifying and extending these findings might consider employing probability samples, oversampling the highly educated, and/or seeing whether these patterns of SES bifurcation can be found in other national contexts.
Some of the lingering questions raised might also be better suited to and more adequately addressed by qualitative inquiry: The question perhaps most pertinent here is what such beliefs mean for people’s day-to-day lives and relations to others. Someone who checked a “strongly agree” box may infrequently (or never) express that belief out loud to another person. This is undoubtedly more likely for especially taboo beliefs, given potential social sanctions. Yet a different individual who checked the same box might regularly proselytize online or offline, forming tight bonds with peers over the sharing of illicit information while estranging themselves from others. Thankfully, a new generation of scholarship has begun to give much-needed attention to these considerations and is beginning to highlight promising areas of theorization (Franks et al. 2017; Harambam 2020; Harambam and Aupers 2017; Ward and Voas 2011; Waters 1997). Much work nevertheless remains.
Operationalizing conspiracy beliefs remains a slippery task, as evidenced by the sheer variation in measures used across surveys. Just as the relationship between political dispositions and conspiracy beliefs varies depending on the particular beliefs at hand (Enders et al. 2021), so too does the relationship between SES and conspiracy beliefs. It is for this reason, in fact, that I cannot (and do not) make claims regarding the universality of status patterns underlying all conspiracy beliefs. What I can (and do) assert, however, is that the story is not as simple as conspiracy beliefs being predominantly held by the uneducated, powerless, or systematically excluded.
My suggestions for future analyses of survey data on this topic are simple: Give careful attention to social status indicators, do not presume linearity, and avoid reductionist logics that tie conspiracy beliefs directly and simply to a lack of education. Attention to individual-level inclinations and psychological dispositions continues to prove fruitful, to be sure. Yet as others have noted (see e.g., Butter and Knight 2015), limiting analyses to these elements strips such beliefs from consideration of relevant status dynamics and, more broadly, from the contexts of rampant social inequality within which they seem to thrive (Casara et al. 2022).
A useful starting point is further quantitative analyses—quantitative analyses that will help scholars identify key stratification divides and unique patterns of reported belief (e.g., Hunt 1996; Schieman 2010). Such research should consider explanations involving perceived threats and test whether they offer leverage particularly regarding advantaged individuals and groups. Additional in-depth qualitative work, building off the rich traditions of cultural scholarship on conspiracy beliefs (Aupers 2012; Barkun 2003; Birchall 2006; Bratich 2008; Butter 2014; Dean 1998; Fenster 2008; Harambam 2020; Knight 2001; Melley 2000) and rumor (Fine and Turner 2004; Fine et al. 2005; Maines 1999), is likewise needed and can further highlight key mechanisms, dynamics regarding access, and implications for social connections and relations.
Conspiracies are a particular type of explanation about certain kinds of things—how society works, how power is exercised, and where power is located. They are remarkably common, permeating both the upper and lower strata of society and comprising significant portions of public and political discourse. They contain dense and often troubling narratives about class conflict, ethnoracial hierarchies, gender dynamics, and hidden mechanisms that underlie social reality. Some seem to simplify this reality, and some seem to complicate it. Some are quite unsavory, and some are not. Several such beliefs are commonly accepted while others remain on the margins. How these variations relate to deep societal inequalities and status divisions is precisely what is missing from research on the topic and precisely what a sociological approach is well equipped to offer.
Footnotes
Appendix
Religious Attendance among White Male Graduate-Degree Holders by Level of Agreement with Two Unpopular Conspiracy Prompts Surrounding School Shootings and the Holocaust.

| Religious Attendance | Never | A Few Times a Year | Once or Twice a Month | Once a Week | Every Day | Total (N = 120) |
|---|---|---|---|---|---|---|
| Disagree with both | 35% (17) |
15% (7) |
8% (4) |
38% (18) |
4% (2) |
100% (48) |
| Neither disagree with both nor agree with both | 14% (3) |
27% (6) |
18% (4) |
28% (6) |
14% (3) |
100% (22) |
| Agree with both | 0% (0) |
14% (7) |
16% (8) |
28% (14) |
42% (21) |
100% (50) |
Note: χ2 = 39.80, p < .001.
Acknowledgements
The author would like to thank the Editors and Reviewers of Socius for their thoughtful feedback in the course of revision. Additionally, the author is deeply grateful to Francesca Polletta, Yang Su, Nina Bandelj, Nathan Redman, Dylan Grey, Kelsey Weymouth-Little, William J. Dewan, Stanley Bailey, Anna Wainwright, Homa Sadri, Maxwell Roberts, and Auden Roscigno for their continual guidance. This project would not have been possible without their gracious support.
1
I refer here to critical in the sense of “critical thinking,” the cognitive skills of argument evaluation and careful judgment making. However, the double-meaning (critical as in “critique”) should be noted (Muscat-Inglott 2023); rather than lacking critique, conspiratorial thought readily borrows the “weapons of social critique” (Latour 2004) developed by social scientists and theorists (![]() ).
).
2
It is quite feasible that sociopolitical contexts shape the plausibility of such claims (Fine 2021). Indeed, recent findings suggest that there are higher levels of conspiratorial views in nations with higher levels of public sector corruption (Alper 2023; ![]() ).
).
3
Some scholars understand conspiracy beliefs in parallel terms, as a “stigmatized knowledge” (Barkun 2015) that is “oppositional” to mainstream institutions (Harambam and Aupers 2015; also see Campbell 1972, 2012). To be a “conspiracy theory” in this sense, an explanation must conflict with the claims of “the relevant epistemic authorities” (![]() ). The specific beliefs measured in this study meet this additional criterion, making synthesis with the rumor literature conceptually appropriate.
). The specific beliefs measured in this study meet this additional criterion, making synthesis with the rumor literature conceptually appropriate.
4
It should be noted that the existence of this group—the Lynwood Vikings deputy gang (Castle 2023)—has since been verified by the relevant authorities (![]() ).
).
5
I first ensured that the 15 items had adequate common variance for factor analysis: Bartlett’s test of sphericity, χ2(105) = 13,956, p < .001, and the Kaiser-Meyer-Olkin measure of sampling adequacy = .95. Rotated factor analysis was not viable given that principal factor analysis extracted a single factor (![]() ).
).
6
I recode at dollar midpoints for my main analyses to preserve the relative distances between income categories (some categories have a range of $25,000; others have a range of $50,000). The top value was estimated by averaging annual household incomes above $199,999 from the Bureau of Labor Statistics 2020 Current Population Survey data set.
7
Correlations: 4/8chan: .37; YouTube: .22; Reddit: .21; Instagram: .19; Twitter: .17; Facebook: .16. The distinctly high correlation between 4/8chan and the conspiracy composite is not apparent among certain subpopulations (i.e., women, those with less than an associate’s degree). For these groups, 4/8chan and YouTube correlate similarly. Future attention to social media use and conspiracy beliefs might consider in-depth attention and analyses regarding particular platform distinctions (Cinelli et al. 2022) or potential interplay between status and platform dynamics (Matassi, Mitchelstein, and Boczkowski 2022).
8
All four data sets are taken from the replication materials of Enders, Uscinski, et al. (2023) and were collected through similar Qualtrics panels. “2020 Qualtrics, June” is comparable to U.S. census records on sex, age, race, and income, as noted in Enders, Uscinski, et al. (2023). “2020 Qualtrics, October” is comparable to U.S. census records on age, gender, educational attainment, income, and race and ethnicity, as noted in Enders, Diekman, et al. (2023). “2020 Qualtrics, Florida” was collected in June 2020 and is representative of July 2019 census estimates of the Florida adult population on age, race, sex, and income, as noted in ![]() . Prompt wording for each data set was verified to be identical in associated codebooks and appendices. The selection of 15 prompts included in my conspiracy composite, however, is limited to the data used in the main analyses; for instance, the other three data sets do not include the Holocaust prompt.
. Prompt wording for each data set was verified to be identical in associated codebooks and appendices. The selection of 15 prompts included in my conspiracy composite, however, is limited to the data used in the main analyses; for instance, the other three data sets do not include the Holocaust prompt.
9
The limits of such measures, however, should be taken seriously, especially considering the idiosyncratic political identifications of the chronically online (Citarella 2021). In addition, higher education may offer individuals the chance to fine-tune their ideological commitments (Jackman and Muha 1984) or political styles (![]() ) in ways that may not map neatly onto this dichotomy.
) in ways that may not map neatly onto this dichotomy.
10
Other social scientists, on a host of social and political outcomes, have shown the utility of squares terms in testing for nonlinearity with regard to education (e.g., Lu et al. 2020; Nagler 1991; Whittington and Alm 1997) and income (e.g., Guiso, Sapienza, and Zingales 2004; Lederman 2002; ![]() ).
).
11
Regarding the dependent variable, I constructed an alternate composite from the 21-prompt version of the data set in ![]() . The additional prompts include especially partisan stimuli; this serves as a test of whether the aforementioned pattern persists with the inclusion of politically partisan conspiracy beliefs. Models 2 and 3 produced p values under .01 for education and its square, with income and its square remaining nonsignificant. Model 4 was excluded because this version of the data set does not include social media usage.
. The additional prompts include especially partisan stimuli; this serves as a test of whether the aforementioned pattern persists with the inclusion of politically partisan conspiracy beliefs. Models 2 and 3 produced p values under .01 for education and its square, with income and its square remaining nonsignificant. Model 4 was excluded because this version of the data set does not include social media usage.
12
I also performed a robustness check measuring income in its original categorical form, rather than at the dollar midpoints as in my main analyses. This was the only set of analyses that yielded some significance for income and/or its square, with p < .05 for both measures in Models 2, 3, and 4. Even here, however, education (p < .001 for Model 2; p < .01 in Models 3 and 4) and the squared term (p < .01 in Model 2; p < .05 in Models 3 and 4) remain significant.