
Abstract
Millions of people have their driver’s licenses suspended each year when they do not pay traffic fines or appear in court, with significant and compounding consequences for their lives. The increased use of fines and fees has been likened to a predatory system that exploits the most vulnerable groups to fill state and local budget gaps. States have begun limiting suspensions for unpaid traffic tickets out of economic and racial equity concerns, but many still sanction drivers for failing to appear in court or comply with other regulations. Merging the full universe of New York Department of Motor Vehicles suspension records in 2017 with the American Community Survey at the zip code level, we find that Black, Hispanic, and economically disadvantaged communities were disproportionately impacted by both nonpayment and noncompliance suspensions. Predictive models suggest that reforms ending suspensions for both the failure to appear in traffic court and the failure to pay traffic tickets could substantially reduce these disparities.
The suspension of a driver’s license was originally used to deter dangerous driving and improve traffic safety. In recent decades, however, license suspensions have increasingly been issued for unpaid traffic fines and other “social noncompliance” reasons, such as failing to appear in traffic court, pay child support, or comply with other state laws and administrative regulations (American Association of Motor Vehicle Administrators [AAMVA] 2018; Joyce et al. 2020). Estimates suggest that at least 7 percent of drivers have a suspended driver’s license at any given point in time (AAMVA 2018). This widespread practice has, in turn, flooded court dockets with suspension cases that are largely unrelated to driving safety (AAMVA 2018).
The increased use of fines and fees to fill budget gaps has been likened to a system of “predation” that exploits the most vulnerable groups to fund local and state government operations (Page and Soss 2021). Driver’s license suspension can be viewed as a critical tool within this system that exacts a harsher penalty on those without the financial means to pay fines or comply with regulations and contributes to a “two-tiered system of justice” (Harris 2016). Although a suspension is commonly triggered by a minor violation such as an unpaid traffic fine or missed court appearance, it can have cascading effects, including criminal penalties. As such, license suspension overlaps with but also extends considerably beyond the criminal legal system, with significant and compounding consequences for millions of people in economically and racially marginalized communities each year.
Growing awareness of economic and racial inequities in driver’s license suspensions has spurred a national reform movement. Several states, including New York, have recently passed legislation to limit suspensions for unpaid traffic fines out of concern that this practice unfairly punishes the most disadvantaged groups for their inability to pay. Federal legislation focused on reducing “debt-based” suspensions has also been supported by a large and ideologically diverse coalition of groups (Jones 2021). Many state reforms specifically limit suspensions for unpaid traffic tickets but continue to allow suspensions for other “social noncompliance” reasons, which are assumed to reflect an unwillingness rather an inability to comply. Yet this distinction may be artificial if nonpayment and noncompliance suspensions affect the same people and communities—and if they are driven by similar underlying factors.
To shed more light on this issue, we examine the full universe of geo-coded suspension records from New York, the fourth largest state in the United States, that issued over 1 million new suspensions in 2017. This analysis uses records from the New York Department of Motor Vehicles (DMV) on all driver’s license suspensions in the state (in 2017) obtained through a Freedom of Information Law (FOIL) request, which we link with data from the American Community Survey (2015–2019) at the zip code level (N = 1,149,886). We use these records to examine patterns of inequality in driver’s license suspensions in communities across New York and use predictive models to explore the possibilities and limits of various reform options. This analysis provides new evidence that Black, Hispanic, and economically disadvantaged communities are disproportionately impacted by both nonpayment and noncompliance suspensions. Importantly, we also show that sanctions for failure to appear in traffic court—a form of social noncompliance excluded by many reforms—contributes substantially to inequality in suspension rates. We conclude by discussing the implications of these findings for understanding the unequal risk of license suspensions and for ongoing reforms in New York and nationally.
Background: Incidence and Consequences of License Suspension
An emerging body of research suggests that vast numbers of people in the United States have their driving privileges restricted at any given time, with potentially serious consequences for their economic and emotional well-being and contact with the criminal legal system. National data on the overall number and reasons for suspensions are not available because of differences in the way states record this information. Drawing on information from a variety of sources, one recent estimate suggests there were 11 million suspensions across the United States for unpaid court debt alone; however, this figure does not include many other common types of suspensions (Hirsch and Jones 2020). In New York, close to 700,000 suspensions were issued in 2016 for two common reasons related to “traffic debt”—failure to pay a traffic ticket and failure to appear in traffic court (Weiss and Wilner n.d.). Two academic studies have documented a similarly high incidence of nonpayment and noncompliance suspensions in New Jersey and North Carolina and economic and racial disparities in these suspension rates (Crozier and Garrett 2019; Joyce et al. 2020).
In recent decades, all states have passed laws allowing or requiring the suspension of a driver’s license for “non-safety” reasons, such as payment of a fine or compliance with other rules or regulations (AAMVA 2018; Crozier and Garrett 2020; Friedman and Pattillo 2019; Salas and Ciolfi 2017; Verma and Sykes 2022). These sanctions may be ineffective for people who are financially unable to comply, however, because they have more difficulty paying fines and fees, and the amount owed can grow significantly over time as reinstatement fees, court costs, and other penalties are added on (Weiss and Wilner n.d.). Having a suspended license can also make it more difficult for people to obtain or maintain employment needed to pay fines and fees because many jobs require a valid driver’s license. One report on New Jersey found suspensions led to job loss, difficulty in finding employment, reduced income, and other financial strains (Carnegie 2007), and estimates from Phoenix identified a $12,700 loss in annual earnings (Chien et al. 2022). Results from a large multistate evaluation also show suspending a driver’s license for failure to pay child support reduced the likelihood of payment (Meyer, Cancian, and Waring 2020).
About four out of five of workers in the United States commute to work by car (McKenzie 2015). Driving is also necessary for daily activities, such as visiting a doctor or dentist, taking children to school and childcare, and grocery shopping, in most areas of the country that lack adequate public transportation (Harris and Smith 2022; Salas and Ciolfi 2017). Restricting people’s legal driving privileges can therefore lead to social exclusion (Atkinson 1998) and diminish the emotional well-being of people who are constrained from traveling freely and those who feel compelled to drive with a suspended license (Harris and Smith 2022).
Indeed, driving is so central to economic and social life that many people whose licenses are suspended—as many as 75 percent (AAMVA 2018)—choose nonetheless to get behind the wheel. This decision incurs substantial risks; driving with a suspended license is a misdemeanor in New York that is punishable by a mandatory fine, surcharge, and possible imprisonment or probation. It is also a felony to have 10 or more suspensions on different dates for failing to respond to a ticket, punishable by higher fines and mandatory imprisonment up to four years or probation (New York State Department of Motor Vehicles [NYSDMV] 2017). Even short jail stays following license suspension can have significant consequences, such as job loss or notification to child welfare authorities (Harris and Smith 2022).
Moreover, fines and fees can bind people to the court system for extended periods of time until they are able to discharge their legal debt (Harris 2016; Kohler-Hausmann 2013; Pattillo and Kirk 2021). Following Kohler-Hausmann (2013), a suspension could also result in social control techniques like those in the criminal legal system, such as “marking, procedural hassles, and performance” for court officials. For example, the DMV maintains public records about the status of people’s driver’s licenses, a summary of their suspensions and revocations, and other restrictions on their driving privileges. Employers often ask job applicants to show proof of a valid license as a condition of employment or may obtain information about the status of a job applicant’s license directly from the DMV. Driving with a suspended license is a crime in most states (National Conference of State Legislatures [NCSL] 2021), and having a record of low-level arrests and misdemeanors may also lead to discrimination in hiring by employers who conduct background checks (Uggen et al. 2014).
The process of responding to a ticket, court summons or notice of suspension, appearing in court, clearing a suspension, and reinstating a license can involve significant time, effort, and expense. 1 These procedural hassles may be particularly burdensome for people with multiple suspensions, often requiring repeated visits to courts and municipal offices (AAMVA 2018; Leiva and Marano 2022). Most drivers attempting to remedy a suspension, however, do not have the right to free legal counsel and navigate court processes without any legal assistance (Sandefur 2008).
A suspension may also require performance for court officials who are charged with assessing people’s willingness to pay or comply, which opens up opportunities for bias and race-blind assessments of the driver’s ability to do so (Brito, Pate, and Wong 2014; Harris 2016). In New York, drivers are held responsible for responding to a summons to appear in traffic court even if the notification was not sent to their current address (New York State Unified Court System n.d.), but those who fail to appear could face significant structural barriers to compliance that are not fully recognized (Levin 2020). Notably, drivers without a stable address are less likely to receive notice of court summons or hearing (Garrett, Modjadidi, and Crozier 2020), and people with inflexible work schedules or childcare responsibilities may be unable to appear in court at the appointed time (Kohler-Hausmann 2020), increasing the likelihood of a suspension.
Predation and the Unequal Risk of Driver’s License Suspension
The high incidence and compounding consequences of driver’s license suspension should alone warrant concern, but what makes license suspension particularly problematic is the unequal risk of this penalty for economically and racially marginalized communities. We draw on Page and Soss’s (2021) concept of “predation” to understand how driver’s license suspension functions as a critical tool for extracting resources from vulnerable populations to fund local and state government and fill budget gaps. Within this framework, predation is described as operating at a social level by targeting and exploiting existing vulnerabilities in marginalized and minoritized groups.
Page and Soss (2021) identify a large array of predatory practices that grew in response to fiscal pressures in the 1980s as the federal government cut financial assistance to municipalities and states and the costs of the criminal legal system skyrocketed (see also Harris 2016). Reliance on fines and fees related to traffic and other violations grew substantially during this time and also intensified following the Great Recession, which put further stress on local and state governments (Jeffrey 2023). As Page and Soss (2021) suggest, these practices disproportionately impacted Black and Latinx communities as a result of intensive policing and punishment while disproportionately benefiting higher-income, White residents by reducing their tax burden and subsidizing employment and public services. As such, predatory practices in the criminal legal system may have intensified economic and social inequality by transferring resources from the poorest residents to more advantaged citizens through “an inversion of welfare” (Katzenstein and Waller 2015). High concentrations of legal debt related to fines and fees have also been shown to exacerbate poverty and increase racial and economic disparities between neighborhoods (O’Neill, Kennedy, and Harris 2022).
Although it is not possible to completely disentangle individual and ecological factors that increase the risk of suspension, previous research suggests variations in community-level suspension rates could operate through differential exposure of racially and economically marginalized groups to revenue-generating practices in policing, the courts, and state administrative agencies.
Policing
Localities in many states, including in New York, have increasingly relied on revenue from traffic tickets and other fines, fees, and surcharges to fund the police, courts, and government services (Beck 2023; Bender et al. 2015; Corra 2021; Harris, Pattillo, and Sykes 2022; Kirk et al. 2022; LaScala-Gruenewald, Adamides, and Toback 2020). In New York, the state also receives a large share of this revenue, with estimates suggesting it receives about $100 million from the surcharges on traffic tickets alone.
The Department of Justice’s investigation into the Ferguson Police Department (U.S. Department of Justice Civil Rights Division 2015) following Michael Brown’s death revealed discriminatory and exploitive practices within the police and court system that prioritized revenue over public safety and trapped impoverished African American residents into a “cycle of fees, fines, driver’s license suspension and incarceration” (Salas and Ciolfi 2017: 6). Some evidence shows that traffic stops increased following declines in revenue, and police violence was higher in municipalities that relied on fines and fees (Beck 2023; Garrett and Wagner 2009). These policing practices have included both intensive surveillance of residents within predominantly Black, Latinx, and poor communities and the exclusion of people who are perceived to be outsiders from White and affluent communities (Bell 2020). Pacewicz and Robinson (2021) also argue racial segregation contributed to “pocketbook policing” in Black suburbs facing financial stress that were less able to generate revenue through other mechanisms. Although seemingly race-neutral, license suspension is likely to be concentrated in marginalized and minoritized communities that experience higher levels of economic disadvantage, policing, and traffic stops (Boyles 2015; Goncalves and Mello 2021; Rios 2011).
Courts
The U.S. Department of Justice Civil Rights Division (2015:3) investigation into policing in Ferguson, Missouri also found that a focus on revenue compromised the municipal courts, which were used primarily to compel the payment of fines and “imposed harsh penalties for failing to appear in court.” As with aggressive policing, the Department of Justice concluded these revenue-generating practices in the courts disproportionately harmed low-income African American residents and generated community distrust. Harris (2016) documented local “cultures of punishment” in the court system in Washington State related to fines and fees that could differentially affect communities. Qualitative evidence from four states further suggests that rural courts were more likely to view fines and fees as an important funding source and also more willing to shift the burden of collecting this revenue to nonresidents (Kirk et al. 2022). These practices could also fuel legal cynicism and system avoidance (e.g., Brayne 2014; Goffman 2009; Kirk and Papachristos 2011), increasing the risk of suspension in communities that view the court system as punitive (Waller 2020).
State agencies
Suspensions are issued not only by courts but also by state administrative agencies, like the DMV and child support agency, for reasons such as failure to carry insurance, to pay child support, and other violations. In New York, for example, drivers who are at least four months in arrears for child support can have their license suspended, and this enforcement action can be taken without going to court. As with fines and fees in the criminal legal system, child support debt not only triggers aggressive enforcement actions but is also used for cost recovery because parents who receive cash welfare are required to assign their rights to child support to the state (Turetsky and Waller 2020). Only half of states currently pass any portion of child support payments through to the custodial parent and child, retaining the rest to offset costs in welfare and foster care programs (NCSL 2023). Like unpaid traffic fines, suspensions for failure to pay child support are likely to be concentrated in marginalized and minoritized communities because most participants in the public child support program are parents of color and receive public assistance and because most arrears are owed by noncustodial parents with very low incomes (Sorensen, Sousa, and Schaner 2007).
Current Study
The New York Driver’s License Suspension Reform Act (DLSRA) of 2020 was explicitly designed to address racial and economic inequities by ending suspensions for unpaid traffic fines. 2 Although the DLSRA automatically cleared suspensions that were officially recorded as “failure to pay a traffic ticket,” it did not cover suspensions that were related to failure to appear in traffic court, carry insurance, pay child support, pay other fees, or comply with DMV or other administrative rules. 3 In this way, the DLSRA was consistent with many state and federal reforms that target suspensions for “traffic debt.” Despite growing awareness that suspensions for traffic fines could harm the most marginalized communities, the potential impact of other types of suspensions has not yet garnered as much recognition. One national poll, for instance, found that over half of the general public opposed license suspension for failure to pay fines and fees (Fines and Fees Justice Center 2021a). In contrast, other experimental evidence suggests that the general public is more likely than legal professionals to view the failure to appear in court as intentional and deserving of punishment (Fishbane, Ouss, and Shah 2020).
Although more evidence is emerging about economic and racial disparities in suspensions, limited research has examined whether the same communities are impacted by suspensions associated with people’s “inability” to pay (e.g., unpaid traffic tickets) and “unwillingness” to comply (e.g., failure to appear in traffic court) and whether drivers in these communities have higher suspension rates for multiple reasons. We are not aware of any research using predictive models to assess how reforms targeting different types of suspensions would be expected to reduce socioeconomic and racial disparities, even though a majority of U.S. states have passed or proposed reforms (Jones and Ben-Menachem n.d.). We expect suspensions for both nonpayment and noncompliance to disproportionately impact minoritized and marginalized communities in New York and that reforms focused only on unpaid tickets would only partially reduce these disparities.
Data and Methods
This study uses DMV data for all driver’s license suspensions in New York in 2017 obtained from a FOIL request by the Center for Law and Economic Justice and shared with the authors. These data indicate the reason for each suspension and the zip code of the suspended driver’s address. After dropping records without valid zip code information, we observe 1,149,886 total suspension events across 565,893 individuals. To examine community socioeconomic and racial disparities in suspension rates, we aggregate suspensions to the zip code level and link with data from the 2015–2019 American Community Survey (ACS). The zip code analytic sample consists of 1,637 residential zip codes in New York—covering 99% of the full population of the state. 4 We observe at least one license suspension in all but four of these zip codes during the 2017 calendar year.
The DMV data include 230 different reasons for issuing driver’s license suspensions in 2017. Following Joyce et al. (2020), we began by coding reasons related to driving safety infractions. We then coded the remaining reasons not related to traffic safety infractions, which we refer to as “nonpayment and noncompliance suspensions.” Overall, seven common suspension reasons were identified: (1) driving safety infractions, (2) failure to pay traffic tickets, (3) failure to pay driver responsibility assessment fees, (4) failure to appear in traffic court, (5) failure to comply with New York State/DMV regulations, (6) failure to pay child support, and (7) other reasons. Note that “driving safety infractions” includes multiple reasons in the DMV data related to unsafe driving behavior and driving under the influence. “Failure to pay traffic tickets” includes a single reason in the DMV data recorded as “unpaid fines (Scofflaw).” While unsafe driving can lead to traffic tickets, these suspensions were issued for failing to pay a ticket rather than for driving behavior. “Failure to pay driver responsibility assessment fees” was coded as a separate category because this imposes an extra fee for certain traffic offenses or points on a driver’s license. “Failure to appear in traffic court” represents a single reason recorded in the DMV data as “failure to answer a summons,” which can be done either by paying the fine or appearing in traffic court. “Failure to comply with New York State/DMV regulations” includes multiple reasons for noncompliance related to insurance (the most common concern in this category), registration, inspection, licenses, and other administrative issues. “Failure to pay child support” includes suspensions issued to noncustodial parents who are at least four months in arrears. Finally, “other reasons” include 37 different reasons that did not fall clearly into one of the aforementioned six categories or were still pending.
Our analysis incorporated a wide range of demographic and socioeconomic characteristics from the ACS measured at the zip code level. These include: (1) population and commute characteristics (proportion age 15–24, proportion urban, proportion single-family unit, commute time 30–60 minutes, commute time more than 60 minutes, proportion households without a vehicle); (2) socioeconomic characteristics (an index of disadvantage, index of disadvantage squared, Gini coefficient of income inequality, and proportion unemployed or not in labor force); and (3) the racial/ethnic composition of the zip code (proportion foreign-born, Hispanic, non-Hispanic Asian or Pacific Islander, non-Hispanic Black or African American, non-Hispanic multiracial or other, non-Hispanic Native American and Alaskan Native). The index of neighborhood socioeconomic disadvantage is a composite measure that we constructed from a principal components analysis of median income, poverty, public assistance receipt, female-headed household, the proportion of 25-year-olds with less than a high school degree, and the proportion with a college degree or more (for a similar measure, see Wodtke, Harding, and Elwert 2011). The unemployment rate was treated as a separate variable given its relevance to community commute patterns and driving frequency, but results were insensitive to alternative specifications that: (a) included occupational structure and unemployment in the composite neighborhood disadvantage index; (b) excluded median income from the composite index; or (c) retained the preferred composite index but dropped Gini coefficient and unemployment controls.
We used Poisson regression models to estimate the number of driver’s license suspensions in each zip code as a function of: (1) population, housing, and commute characteristics; (2) socioeconomic characteristics; and (3) the racial/ethnic composition of the zip code. We estimated the models with robust standard errors and used the log of the number of zip code residents age 15 and up as an offsetting term. To account for spatial relationships between units, we included fixed effects for 13 New York judicial districts, and we controlled for spatial lags of all explanatory variables (LeSage 2014; Rüttenauer 2022). 5
We ran separate models to examine socioeconomic and racial/ethnic disparities in: (1) total suspension events; (2) suspension events by reason; and (3) the number of persons suspended for any or multiple reasons. Data were not available for the period after DLSRA was implemented in New York (June 29, 2021), which ended suspensions for unpaid traffic tickets. Given our interest in understanding the potential of this and other proposed reforms for reducing disparities, we also estimated a suite of regression models that explored zip code suspensions under hypothetical reform scenarios that removed suspensions for: (a) failure to pay traffic tickets (the most common fine); (b) failure to pay driver responsibility assessment fees (the most common fee); and (c) failure to pay either of these fines/fees or failure to appear in traffic court.
Results
Descriptive Results
Results from descriptive statistics are shown in Table 1. Only about 6 percent of the new 1,149,886 suspensions issued in 2017 were for driving safety infractions, whereas over 84 percent were for nonpayment or noncompliance reasons. Overall, the two most common reasons for suspensions were for failure to appear in traffic court or answer a summons (42.3 percent) and failure to pay a traffic ticket (22.4 percent). Somewhat less common reasons involved failure to pay driver responsibility assessment fees (8.3 percent), failure to follow New York State/DMV regulations (7.4 percent), failure to pay child support (4.0 percent), and other reasons (9.4 percent). Notably, over 41 percent of New York residents whose licenses were suspended in 2017 experienced multiple suspensions.
License Suspensions Issued in New York State in 2017.

Note: Restricted to new driver’s license suspensions issued in the 2017 calendar year for all persons with valid New York state zip codes. “Failure to appear in traffic court” is recorded in the Department of Motor Vehicle data as “failure to answer a summons,” which can be done either by paying the fine or appearing in traffic court. “Failure to comply with New York State/Department of Motor Vehicle regulations” includes multiple reasons for noncompliance related to insurance (the most common concern in this category), registration, inspection, licenses, and other administrative issues.
Because a sizeable share of drivers had multiple suspensions, we also examined common reasons for individuals to receive their first and second license suspensions within the same calendar year. Descriptive patterns are reported in Table 2 for all 565,893 drivers with any suspension in 2017. Failure to appear in traffic court was not only the most frequent reason for receiving an initial 2017 suspension (38.7 percent) but was also most commonly associated with receiving second suspensions. Specifically, 58.6 percent (100 percent minus 41.4 percent) of all drivers whose first 2017 suspension was for failure to appear in traffic court received at least one additional suspension on the same day or within the same calendar year—most commonly for failure to pay a traffic ticket or a subsequent failure to appear in traffic court. The next most common reason for an initial 2017 license suspension was for failure to pay a traffic ticket (14.5 percent), with about 4 in 10 of these drivers going on to receive a second suspension. Overall, Table 2 shows that suspensions both for the failure to appear in traffic court and for the failure to pay traffic tickets were often issued to the same drivers in the same year. 6
Individuals with One or More Suspension Issued in New York State in 2017.

Note: Restricted to new driver’s license suspensions issued in the 2017 calendar year for all persons with valid New York state zip codes. First and second suspensions are identified chronologically within each individual’s longitudinal Department of Motor Vehicle record over the full 2017 calendar year window.
The DMV records showed that driver’s license suspensions were primarily issued for nonpayment or noncompliance reasons rather than driving safety infractions. Does this practice disproportionately harm marginalized communities? DMV data do not provide information about the socioeconomic or racial/ethnic background of individual drivers, but they do provide the zip code for the driver’s last known address. We leveraged this information with a zip code-level analysis to compare suspension counts across different communities. Table 3 reports descriptive statistics of 1,637 New York zip codes in the analysis. Note that the rates of license suspensions reported in Table 3—overall and by reason—express averages across communities and are thus not directly comparable to suspension-record-level (Table 1) or individual-level (Table 2) frequency rates. We report suspensions as rates per 1,000 zip code residents age 15 and above.
Zip Code Mean Characteristics.

Note: Restricted to new driver’s license suspensions issued in the 2017 calendar year for all persons with valid New York state zip codes. N = 1,637 zip codes in New York State. Population, commute, economic, and racial/ethnic composition variables come from the 2015–2019 American Community Survey zip code tabulation area file provided by the National Historic Geographic Information System web platform (Manson et al. 2021).
Table 3 also provides a summary of the covariates used in our analysis. We specifically highlight the fact that there was wide variation in the racial and socioeconomic composition of New York zip codes, that nearly 42 percent of workers commuted longer than 30 minutes in the average zip code, and that the most common commute modality was by car.
Results from Poisson Regression Models
We next present results from Poisson regression models predicting total zip code suspensions in Table 4, again focusing on new suspensions issued in 2017. We explored various combinations of explanatory variables in columns one through three, with the full, preferred model appearing in column four. We tested a variety of nonlinear specifications for each of the covariates; those presented (including a quadratic term for the index of disadvantage) had the best model fit.
Regression Models Predicting Zip Code License Suspensions Issued in 2017.
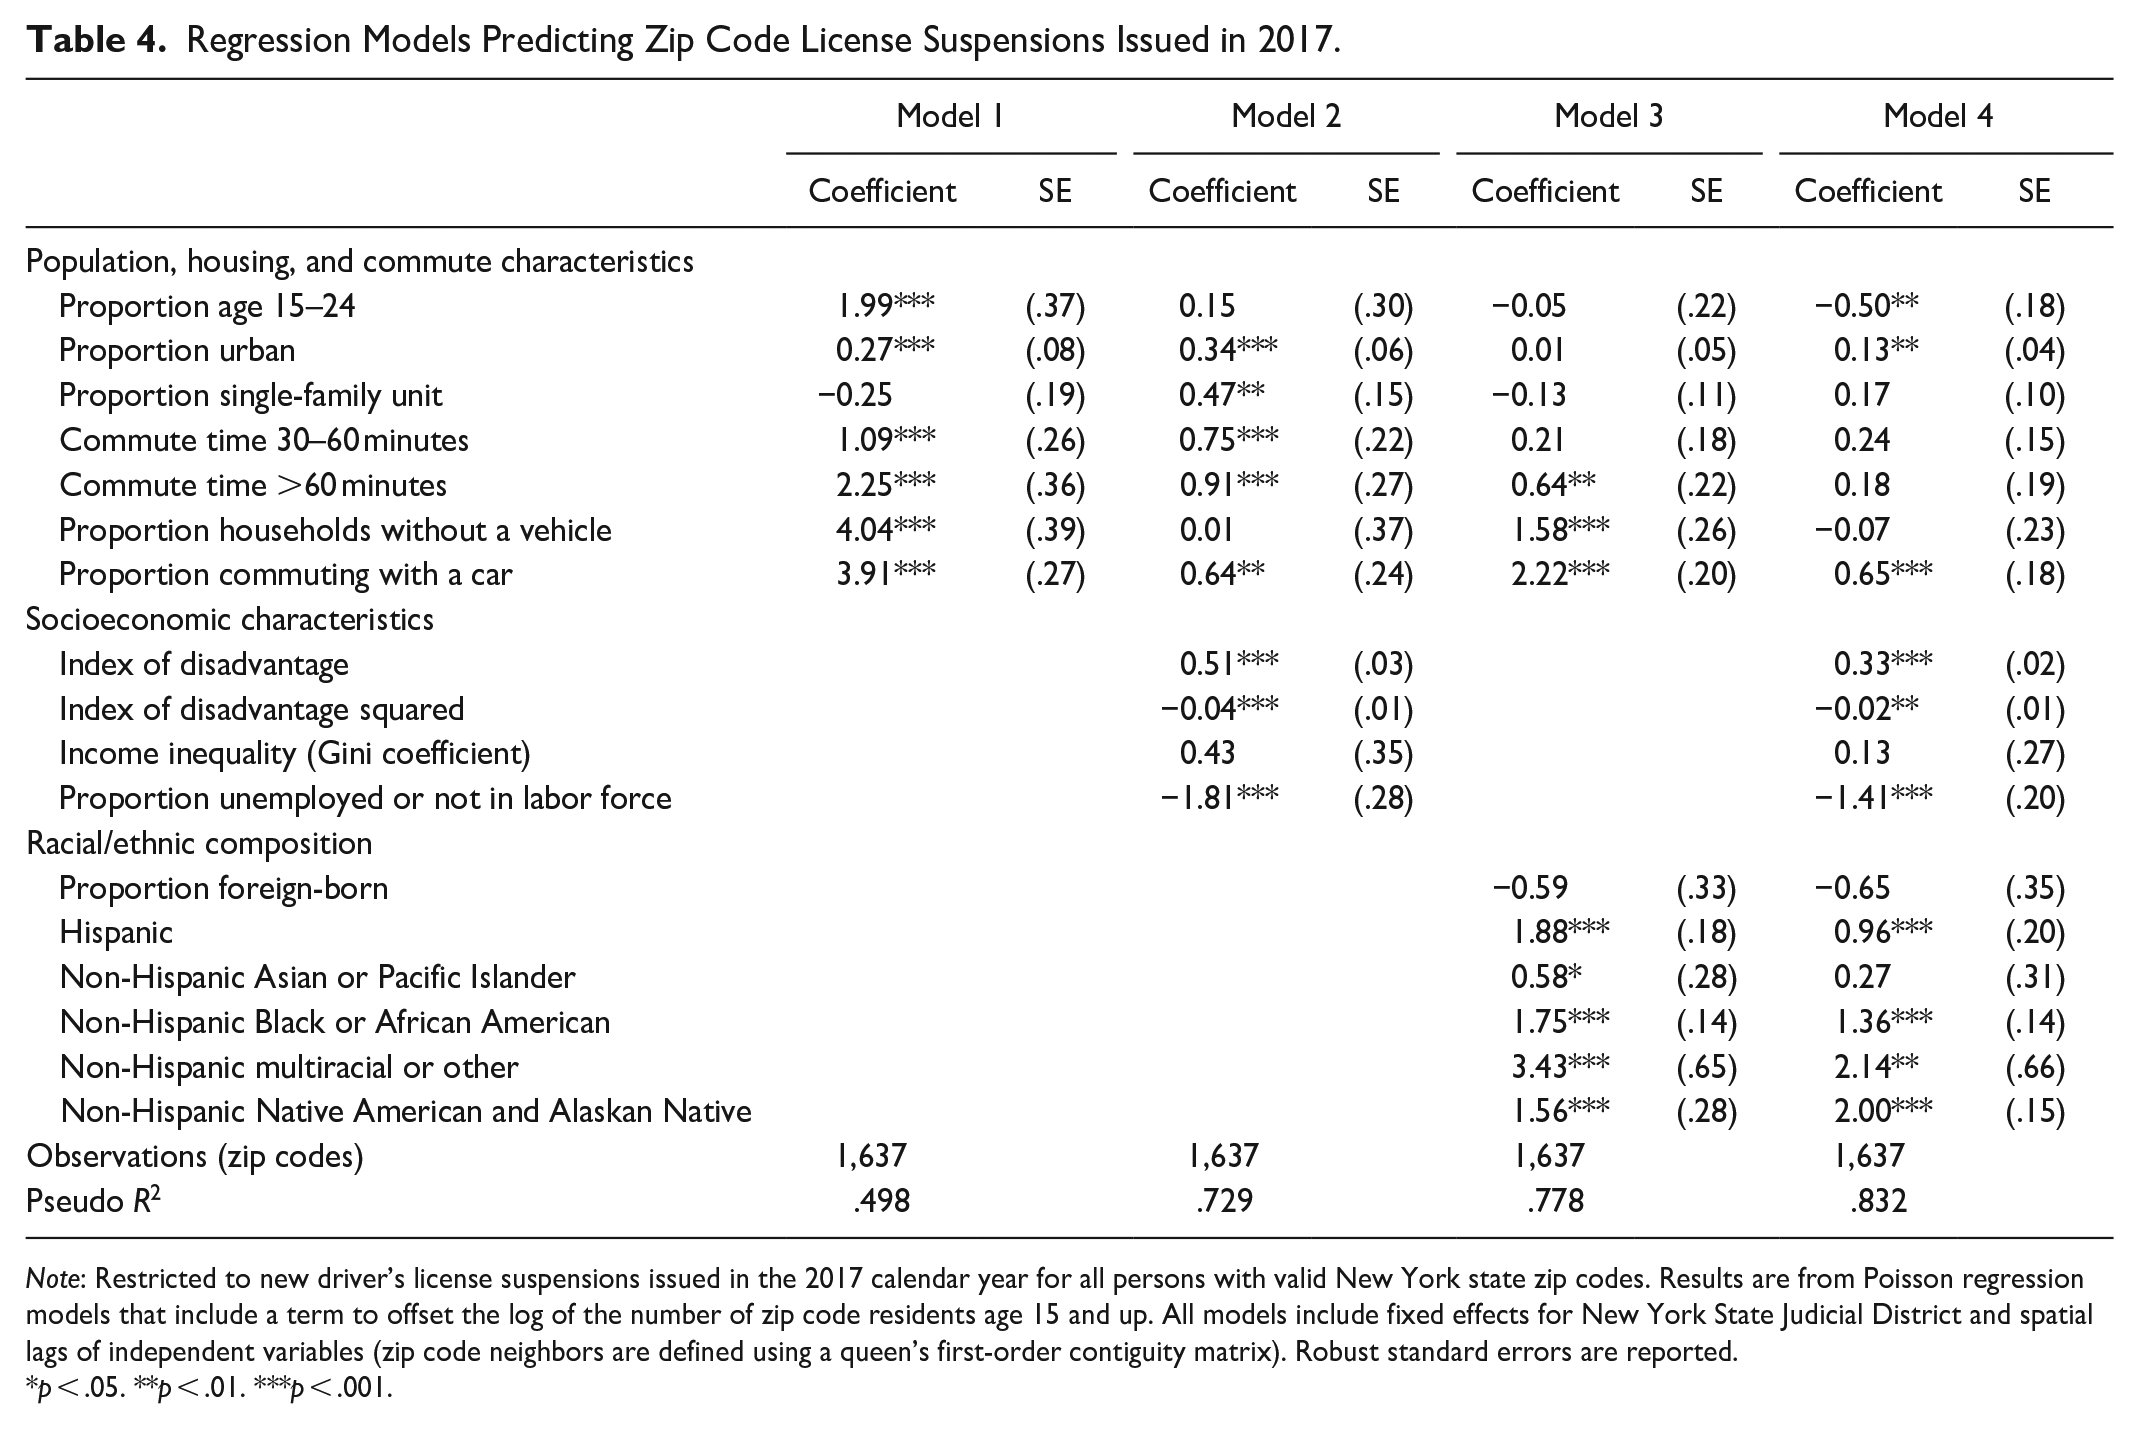
Note: Restricted to new driver’s license suspensions issued in the 2017 calendar year for all persons with valid New York state zip codes. Results are from Poisson regression models that include a term to offset the log of the number of zip code residents age 15 and up. All models include fixed effects for New York State Judicial District and spatial lags of independent variables (zip code neighbors are defined using a queen’s first-order contiguity matrix). Robust standard errors are reported.
p < .05. **p < .01. ***p < .001.
In Model 1, we found that zip codes with younger populations in predominantly urban settings had a higher frequency of suspensions, all else equal. We also found that suspensions were higher in zip codes where the average commute time was longer and where more residents commuted by car. These findings are consistent with the expectation that suspensions are more frequent in communities where driving is more common. Although the proportion of households without a vehicle predicted more suspensions in Model 1, this result did not hold in models that controlled for community socioeconomic characteristics.
Models 2 through 4 added our primary explanatory variables of interest—zip code socioeconomic characteristics and racial/ethnic composition—while continuing to control for population, housing, and commute characteristics. The results in Model 2 showed that suspensions were more frequent in zip codes with greater socioeconomic disadvantage, net of all other controls. Income inequality within zip codes did not correlate with suspension counts, but low labor force participation was associated with substantially fewer suspensions, likely because residents were driving less and had a lower risk for traffic stops. The results in the full model (Model 4) indicated that net of all other variables, community racial/ethnic composition played a strong role in predicting driver’s license suspension counts. This phenomenon was particularly pronounced for zip codes with large Black, Hispanic, Native American, and multiracial populations. We also note that the pseudo R2 reported in this table was largest for Model 4 (including all covariates) and increased substantially compared to Model 2, which included socioeconomic characteristics but not zip code racial/ethnic composition.
To investigate which types of suspensions disproportionately impact marginalized and minoritized communities, we estimated a series of full regression models (identical to those in Table 4, Model 4), separately by each of the seven major reasons for suspension we coded. Results from the complete models are presented in Appendix Table A1. Figure 1 provides a graphical summary of these seven models by zip code socioeconomic disadvantage (Figure 1a), proportion non-Hispanic Black (Figure 1b), and proportion Hispanic (Figure 1c). These graphs report findings as suspension incidence rates per 1,000 residents (age 15 and up).
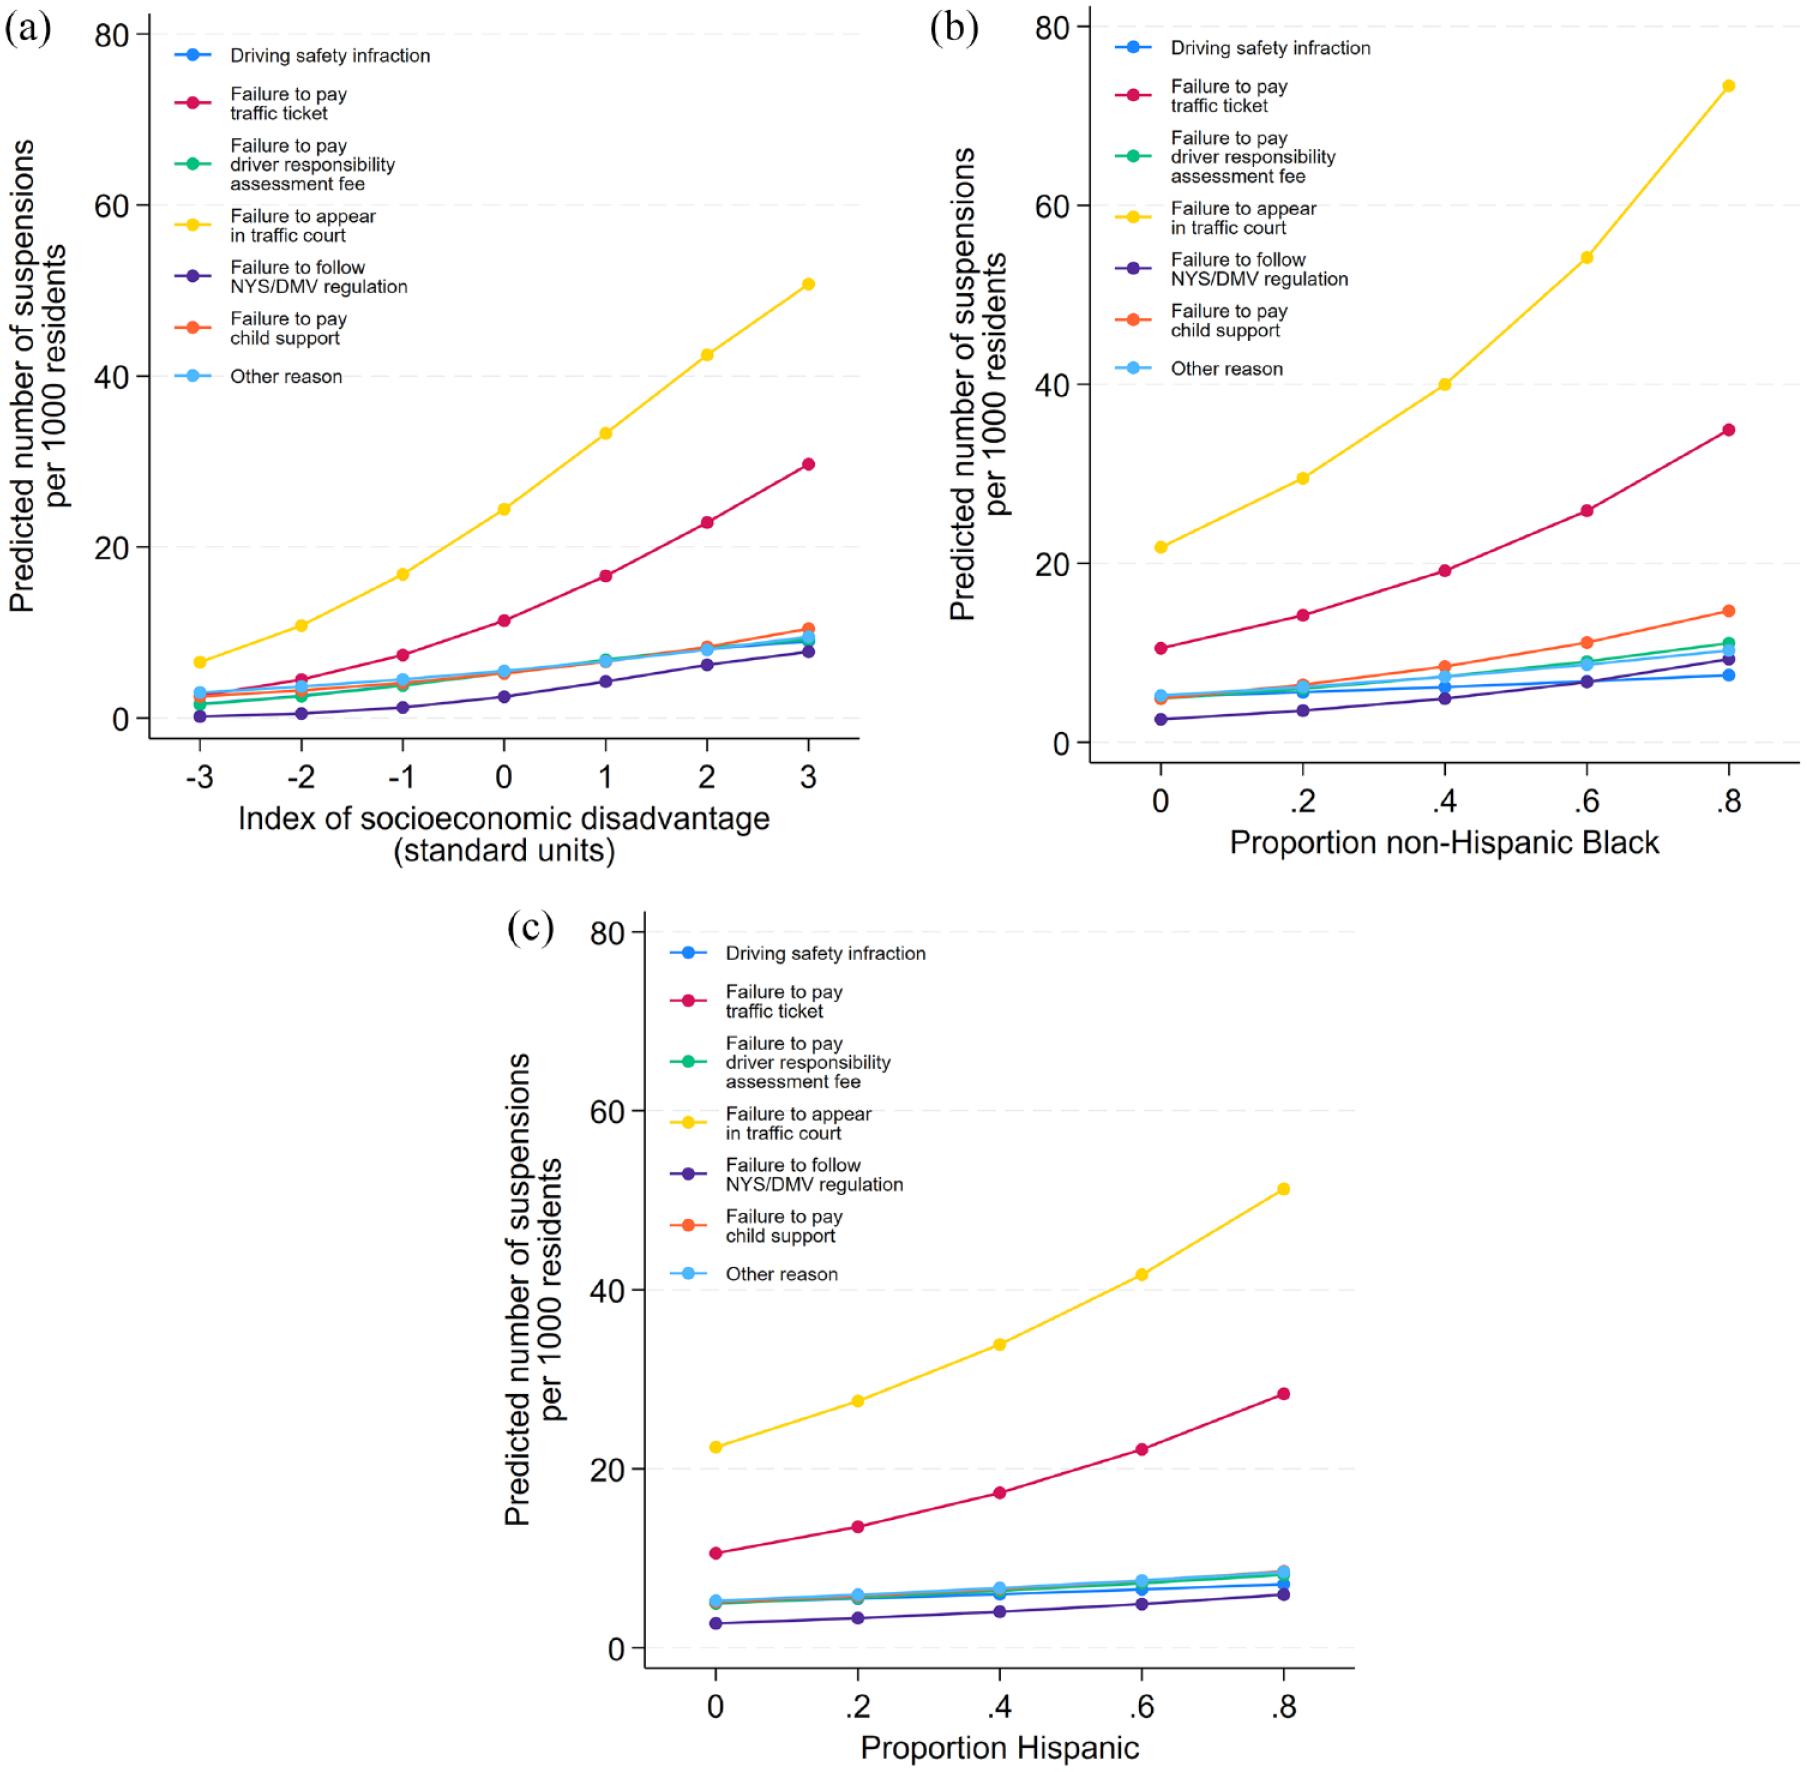
Predicted license suspensions in 2017 per 1,000 residents, by suspension reason and by zip code socioeconomic disadvantage and racial composition: (a) by zip code index of socioeconomic disadvantage, (b) by zip code proportion non-Hispanic Black, and (c) by zip code proportion Hispanic.
Figure 1a shows a nonlinear relationship between neighborhood socioeconomic disadvantage and driver’s license suspension rates. Failure to appear in traffic court dominated all other reasons for suspension and had a strong upward curve. This finding is important because it suggests that the underlying reason for noncompliance was related to socioeconomic factors. Our conceptual framework suggests these sanctions may have exploited the vulnerabilities of groups with greater challenges to responding to a summons or appearing in court, such as residential instability, inflexible jobs, and childcare demands.
Other suspension reasons followed a similar pattern—some more severe than others. Suspensions for failure to pay traffic tickets were also strongly predicted by zip code socioeconomic disadvantage, followed by suspensions for driving safety infractions. The former may be explained by the fact that disadvantaged communities have more residents who are unable to pay traffic tickets, while the latter could indicate differences in driving behavior. In both cases, the higher risk of suspensions could result not only from compositional differences but also from social factors, such as higher levels of law enforcement surveillance in minoritized and marginalized communities (Boyles 2015; Goffman 2009; Goncalves and Mello 2021; Rios 2011).
Figures 1b and 1c illustrate the relationships between zip code suspension rates (by reason) and racial/ethnic composition. This analysis focused on the proportion non-Hispanic Black and the proportion Hispanic in each zip code because these are populations that have experienced heightened policing and punishment. Limited population counts across most zip codes precluded us from analyzing results for Native American, Asian American and Pacific Islander, or multiracial populations. Note that the estimation models accounted for economic factors, so the relationships we demonstrate in Figures 1b and 1c were not explained by correlations between community racial/ethnic composition and measures of community socioeconomic disadvantage. These results show a particularly strong relationship between suspensions for failure to appear in traffic court and proportion non-Hispanic Black. A slightly weaker but still strong relationship was predicted for failure to pay traffic tickets. Similar (but relatively muted) effects were found for communities with higher Hispanic populations as shown in Figure 1c. Altogether, the results from Figure 1 demonstrate that suspensions for failure to appear in traffic court—even more than for failure to pay a traffic ticket—imposed a disproportionate penalty on economically disadvantaged and racially marginalized communities.
Suspensions for failure to appear in traffic court may compound negative effects for minoritized and marginalized communities because, as we showed in Table 2, this reason for suspension was often a “gateway” to subsequent suspensions. To explore this issue, Table 5 presents regression results for counts of zip code suspensions overall (equivalent to Table 4, Model 4), counts of individuals with any suspensions, and counts of individuals with multiple suspensions. As expected, the regression models revealed that community socioeconomic disadvantage and racial/ethnic composition were strongly predictive of more suspensions and more individuals with multiple suspensions over the 2017 calendar year.
Regression Models Predicting Zip Code License Suspensions Issued in 2017.

Note: Restricted to new driver’s license suspensions issued in the 2017 calendar year for all persons with valid New York state zip codes. Results are from Poisson regression models that include a term to offset the log of the number of zip code residents age 15 and up. All models include fixed effects for New York State Judicial District and spatial lags of independent variables (zip code neighbors are defined using a queen’s first-order contiguity matrix). Robust standard errors are reported. The first column of results is the same as reported in Model 4 of Table 4.
p < .01. ***p < .001.
Results from Prediction Models
Our analysis raises the question of how much the DLSRA (which began ending suspensions for unpaid traffic tickets in mid-2021) could be expected to reduce socioeconomic and racial disparities in community suspension rates. We are also interested in understanding whether disparities could be further reduced through more expansive reforms targeting suspensions for the most common fees and for failure to appear in traffic court. To assess the potential of different reform options, we examined how community suspensions might be expected to change under three hypothetical reform scenarios, based on the following data alterations: (1) drop suspension records associated with failure to pay traffic tickets (i.e., mimicking the DLSRA); (2) drop suspension records associated with unpaid tickets and driver responsibility assessment fees (extending the logic of the DLSRA to include the most common fine and fee); and (3) drop suspension records associated with failure to pay traffic tickets, driver responsibility assessment fees, and failure to appear in traffic court (extending the logic to include the most common social noncompliance reason for suspension).
Based on these hypothetical reform scenarios, we estimated that 11 percent fewer individuals would have had their license suspended if the DLSRA would have been in effect in 2017 (Scenario 1). If suspensions for the most common fines and fees were ended, there would have been 20 percent fewer individuals with a suspension (Scenario 2). In the even more expansive reform scenario that ended suspensions for failure to appear in traffic court and failure to pay major fines/fees (Scenario 3), the total number of individuals with suspensions would have declined by 57 percent. For reasons we discuss in the conclusion, this counterfactual procedure can provide a stylized depiction of suspensions under alternative reform scenarios but cannot provide a precise prediction of what would be observed if reforms were implemented.
To explore the impact of these hypothetical reform scenarios on communities, we recomputed zip code aggregates of the total number of suspensions and the total number of persons with multiple suspensions per 1,000 residents. We then reestimated regressions from Table 5 for each alternative scenario. A comparison of results across these counterfactuals provides a simple tool for examining inequality in the penalties faced by different communities. We present these comparisons graphically in Figures 2 to 4. In these figures, (a) illustrates predicted reductions in total rates of suspension events per 1,000 zip code residents, and (b) highlights predicted reductions in rates for individuals with multiple suspensions in the 2017 calendar year.

License suspensions issued in 2017 predicted under three reform scenarios, by zip code index of socioeconomic disadvantage: (a) predicted count of total suspensions in zip code per 1,000 residents age 15+ and (b) predicted count of persons with multiple suspensions in zip code per 1,000 residents age 15+.

License suspensions issued in 2017 predicted under three reform scenarios, by zip code proportion non-Hispanic Black: (a) predicted count of total suspensions in zip code per 1,000 residents age 15+ and (b) predicted count of persons with multiple suspensions in zip code per 1,000 residents age 15+.

License suspensions issued in 2017 predicted under three reform scenarios, by zip code proportion Hispanic: (a) predicted count of total suspensions in zip code per 1,000 residents age 15+ and (b) predicted count of persons with multiple suspensions in zip code per 1,000 residents age 15+.
Figure 2 shows that ending suspensions for failure to pay traffic tickets would be predicted to substantially reduce total suspension rates and rates for individuals with multiple suspensions. A comparison between the blue line (law as practiced in 2017) and red line (matching the DLSRA reform conditions) shows a substantial decline in rates across both figures but only a minor change to the upward arc of the line. This suggests that reforms targeting traffic tickets would lead to a large drop in suspension rates but only a somewhat attenuated relationship between these rates and zip code socioeconomic disadvantage. If a more expansive reform were to also end suspensions for failure to pay driver responsibility assessment fees (depicted by the green line), predicted suspension rates would further decline, but again, the upward arc would persist. This is an important finding because it demonstrates that even if the total number of suspensions were to decrease under these reform scenarios, there could still be a high degree of inequality in suspension rates based on community socioeconomic disadvantage.
We have suggested that failure to appear in traffic court, although often attributed to an unwillingness to comply, may in fact be driven by structural barriers to compliance. If so, then a reform that further removes suspensions for this reason (depicted by the yellow line) could substantially alleviate burdens in socioeconomically disadvantaged communities. Indeed, Figures 2a and 2b reveal that this expansive reform scenario would substantially weaken the relationship between community socioeconomic disadvantage and predicted rates of suspension (flattening the sharp upward curves in the other three scenarios).
Figures 3 and 4 report results from the same models but highlight predicted reductions in suspension rates for Black and Hispanic communities. In Figure 3, we see that reforms ending suspensions for failure to pay traffic tickets and driver responsibility assessment fees would incrementally reduce predicted suspension rates but would do little to change the relationship (the slope of the blue vs. red vs. green lines) between these predicted rates and the proportion non-Hispanic Black living in the zip code. A reform that ended suspensions for failure to appear in traffic court would not only reduce predicted rates of total suspension events and predicted rates of multiple suspensions, but it would also substantially weaken the relationship with zip code racial/ethnic composition—thus reducing one salient dimension of inequality.
In contrast to Figure 3, we see in Figure 4 that various reforms would lower predicted suspension rates but would have little impact on their disproportionate concentration in predominantly Hispanic communities. Total suspension rates and the frequency of individuals with multiple suspensions would be predicted to be lower under each reform context, but the relative flat slope of the line would decline only slightly, perhaps because suspension rates are already lower in these areas than in Black communities. Nonetheless, ending suspensions for both these fines/fees and for failure to appear in traffic court would again be predicted to yield a substantial reduction in both the levels and slopes of the lines presented in Figure 4, reducing the overall number of suspensions as well as inequality by community Hispanic composition.
Finally, we highlight that new and proposed reforms explored in the counterfactual exercise would reduce the predicted number of people who have multiple driver’s license suspensions—especially in predominantly disadvantaged, Black, and Hispanic communities. Comprehensive reforms that end license suspensions for unpaid traffic tickets, failure to pay a driver assessment fee, and for failure to appear in court have the largest estimated impact in reducing the inequality of multiple suspensions across New York.
Discussion
In recent decades, local and state governments became more reliant on fines and fees to fill budget gaps while states also began allowing or requiring suspension for reasons unrelated to driving safety. During this time, license suspension became a widely used tool to compel payment and compliance. As a result, millions of people lost their driving privileges when they failed to pay a traffic fine, appear in traffic court, carry insurance, pay child support, or comply with other regulations, with significant and compounding consequences for their lives. Marginalized and minoritized communities were at unequal risk for nonpayment and noncompliance suspensions both because of their greater economic disadvantage and also because of their heightened exposure to revenue-generating practices by police, courts, and state administrative agencies. In this way, suspensions may have exploited the vulnerabilities of groups with the highest barriers to payment and compliance (Page and Soss 2021).
Legal debt from unpaid fines and fees has been found to increase racial and economic disparities between neighborhoods (O’Neill et al. 2022) and transfer resources from the least to the most advantaged communities (Page and Soss 2021). At an individual level, these practices may also deepen inequality because people with limited resources are less able to pay fines and comply with court directives and experience additional economic and other hardships after losing their driving privileges. What begins as a minor traffic or other infraction can in turn lead to criminal penalties and prolonged court involvement. An important body of literature has documented how disproportionate policing, incarceration, and monetary sanctions have harmed marginalized and minoritized communities. Given the vast scale and unequal concentration of license suspensions to enforce payment and compliance, this study reveals a critical, although often overlooked, mechanism contributing to these engines of economic and racial inequality.
Our results show the overwhelming majority of driver’s license suspensions were for nonpayment and noncompliance reasons rather than driving safety infractions (AAMVA 2018). Over 1 million new suspensions were issued to New York residents in 2017 alone. These sanctions were unequally distributed across communities and most heavily concentrated in zip codes with high levels of socioeconomic disadvantage and high proportions of Hispanic and, especially, Black residents, consistent with research available in other states that record this information (e.g., Crozier and Garrett 2019; Joyce et al. 2020). Our results further show that a substantial share of sanctioned drivers received suspensions for multiple reasons in the same calendar year, a situation that is particularly burdensome and costly to resolve (Leiva and Marano 2022).
To date, more reforms have focused on limiting nonpayment suspensions for traffic tickets than noncompliance suspensions for failure to appear in traffic court, pay child support, or comply with other state laws or administrative regulations. Drawing a distinction between those low-income drivers who are unable and unwilling to comply parallels long-standing ways the law, policy, and public opinion have regarded the “deserving poor,” who are considered worthy of sympathy, differently from the “undeserving poor,” who are held morally responsible for their own behavior (Katz 2013). Our results suggest that this distinction is artificial because failure to pay and failure to appear suspensions impacted the same communities, and a large share of drivers were issued suspensions for both reasons. Indeed, failure to appear suspensions were the most frequently issued type of suspension in New York and were even more closely associated with race and socioeconomic disadvantage than suspensions for unpaid traffic tickets.
Limitations and Future Directions
The counterfactual procedure provides a stylized depiction of life under alternative legal reforms rather than a prediction of what we would observe in reality. It is likely that drivers and those charged with implementing the DLSRA (e.g. police, judges, lawyers, clerks) could change their behaviors in ways that influence the rates we would actually observe. In particular, the DLSRA could reduce suspensions for failure to appear in traffic court by providing drivers additional notice and making it easier for them to enter into a payment plan. An important direction for future research will be to obtain DMV data on license suspensions after the DLSRA went into effect and to compare New York with states that have not passed reforms or that have passed more expansive reforms. It would also be beneficial to obtain data on driver’s race and socioeconomic characteristics to examine how individual factors, in addition to neighborhood composition, are related to the risk of suspension. Finally, it would be helpful to collect qualitative data to learn more about the context and consequences of license suspension in minoritized and marginalized communities.
Conclusion
As these reforms unfold, findings from this study could inform federal and state policy during a window of time when there is widespread support for curbing driver’s license suspensions. Our results demonstrate that more expansive reforms, particularly reforms that include both the failure to appear in traffic court and failure to pay traffic tickets, could not only lower the number of suspensions but also substantially improve economic and racial equity.
Supplemental Material
sj-pdf-1-srd-10.1177_23780231241234632 – Supplemental material for Predation and the Disproportionate Risk of Driver’s License Suspensions in Economically and Racially Marginalized Communities
Supplemental material, sj-pdf-1-srd-10.1177_23780231241234632 for Predation and the Disproportionate Risk of Driver’s License Suspensions in Economically and Racially Marginalized Communities by Maureen R. Waller, Peter Rich and Nathan L. Robbins in Socius
Footnotes
Appendix
Regression Models Predicting Zip Code License Suspensions Issued in 2017, by Suspension Reason.

| Driving Safety Infraction | Failure to Pay Traffic Ticket | Failure to Pay Driver Responsibility Assessment Fee | Failure to Appear in Traffic Court | Failure to follow New York State/Department of Motor Vehicle Regulation | Failure to Pay Child Support | Other Reason | ||||||||
|---|---|---|---|---|---|---|---|---|---|---|---|---|---|---|
| Coefficient | SE | Coefficient | SE | Coefficient | SE | Coefficient | SE | Coefficient | SE | Coefficient | SE | Coefficient | SE | |
| Population, housing, and commute characteristics | ||||||||||||||
| Proportion age 15–24 | −0.71*** | (.20) | −0.91** | (.28) | −0.54** | (.19) | −0.24 | (.25) | −0.20 | (.16) | −0.88** | (.27) | −0.71*** | (.19) |
| Proportion urban | 0.05 | (.05) | 0.09 | (.07) | 0.05 | (.05) | 0.21*** | (.06) | −0.01 | (.05) | 0.20** | (.07) | 0.10* | (.05) |
| Proportion single-family unit | 0.26** | (.10) | 0.05 | (.14) | −0.11 | (.10) | 0.27* | (.12) | −0.10 | (.10) | 0.09 | (.17) | 0.24** | (.09) |
| Commute time 30–60 minutes | 0.29* | (.13) | 0.10 | (.23) | 0.05 | (.14) | 0.41* | (.20) | −0.03 | (.14) | −0.01 | (.20) | 0.17 | (.14) |
| Commute time >60 minutes | 0.16 | (.19) | −0.05 | (.25) | −0.01 | (.18) | 0.46 | (.25) | −0.37 | (.20) | −0.43 | (.32) | 0.16 | (.19) |
| Proportion households without a vehicle | −0.70** | (.23) | −0.35 | (.31) | −0.57* | (.23) | 0.18 | (.29) | −0.42 | (.22) | 0.77* | (.34) | −0.01 | (.22) |
| Proportion commuting with a car | 0.70*** | (.19) | 0.41 | (.26) | 0.44* | (.21) | 0.82*** | (.24) | 0.69*** | (.20) | 0.95** | (.31) | 0.67*** | (.17) |
| Socioeconomic characteristics | ||||||||||||||
| Index of disadvantage | 0.28*** | (.02) | 0.41*** | (.03) | 0.29*** | (.02) | 0.34*** | (.03) | 0.24*** | (.02) | 0.62*** | (.04) | 0.19*** | (.02) |
| Index of disadvantage squared | −0.04*** | (.01) | −0.03* | (.01) | −0.04*** | (.01) | −0.03** | (.01) | 0.00 | (.01) | −0.08*** | (.01) | 0.00 | (.01) |
| Income inequality (Gini coefficient) | 0.53 | (.27) | −0.52 | (.38) | 0.25 | (.26) | 0.09 | (.35) | 0.53* | (.24) | −0.01 | (.45) | 1.17*** | (.24) |
| Proportion unemployed or not in labor force | −1.41*** | (.19) | −1.65*** | (.26) | −1.47*** | (.22) | −1.39*** | (.26) | −1.37*** | (.20) | −1.31*** | (.28) | −1.16*** | (.20) |
| Racial/ethnic composition | ||||||||||||||
| Proportion foreign-born | −0.14 | (.26) | −0.83* | (.40) | −0.18 | (.26) | −0.63 | (.45) | −0.68** | (.24) | −1.96*** | (.33) | −0.36 | (.21) |
| Hispanic | 0.43** | (.15) | 1.23*** | (.23) | 0.62*** | (.15) | 1.03*** | (.26) | 0.65*** | (.17) | 0.97*** | (.24) | 0.60*** | (.13) |
| Non-Hispanic Asian or Pacific Islander | −0.41 | (.24) | 0.40 | (.35) | −0.11 | (.24) | 0.33 | (.41) | 0.50* | (.23) | 0.21 | (.36) | 0.19 | (.21) |
| Non-Hispanic Black or African American | 0.49*** | (.11) | 1.50*** | (.17) | 1.03*** | (.10) | 1.52*** | (.20) | 1.38*** | (.10) | 1.61*** | (.15) | 0.84*** | (.10) |
| Non-Hispanic multiracial or other | 1.40*** | (.40) | 2.25** | (.79) | 1.76** | (.61) | 2.33** | (.79) | 1.60* | (.65) | 3.97*** | (.80) | 1.74*** | (.36) |
| Non-Hispanic Native American and Alaskan Native | 1.86*** | (.32) | 2.63*** | (.18) | 2.38*** | (.21) | 1.83*** | (.23) | 1.49*** | (.16) | 1.13 | (.66) | 1.58*** | (.36) |
| Outcome variable mean (per 1,000 residents) | 5.62 | 12.67 | 5.56 | 26.09 | 5.91 | 3.11 | 6.06 | |||||||
| Outcome variable standard deviation | 4.90 | 11.85 | 4.21 | 21.71 | 5.29 | 4.06 | 4.64 | |||||||
| Observations (zip codes) | 1,637 | 1,637 | 1,637 | 1,637 | 1,637 | 1,637 | 1,637 | |||||||
| R 2 | .544 | .789 | .602 | .775 | .608 | .761 | .536 | |||||||
Note: Restricted to new driver’s license suspensions issued in the 2017 calendar year for all persons with valid New York state zip codes. Results are from Poisson regression models that include a term to offset the log of the number of zip code residents age 15 and up. All models include fixed effects for New York State Judicial District and spatial lags of independent variables (zip code neighbors are defined using a queen’s first-order contiguity matrix). Robust standard errors are reported.
p < .05. **p < .01. ***p < .001.
Acknowledgements
We would like to thank the National Center for Law and Economic Justice and the Fines and Fees Justice Center for sharing their data with us and Jenna Shelton for research assistance. We are also grateful to the ABF/JPB Foundation Access to Justice Scholars Program, the David M. Einhorn Center for Community Engagement, the Cornell Center for Social Sciences, the Cornell Population Center, and the Cornell Center for Health Equity for generous funding of this project.
Supplemental Material
Supplemental material for this article is available online.
Notes
Author Biographies
References
Supplementary Material
Please find the following supplemental material available below.
For Open Access articles published under a Creative Commons License, all supplemental material carries the same license as the article it is associated with.
For non-Open Access articles published, all supplemental material carries a non-exclusive license, and permission requests for re-use of supplemental material or any part of supplemental material shall be sent directly to the copyright owner as specified in the copyright notice associated with the article.