
Abstract
In this study, the authors draw on a unique dataset of eviction filings in Washington, D.C., over a six-year period, merged with building ownership data from the District of Columbia Office of Tax and Revenue, to better understand patterns of serial filing, a practice whereby landlords file for eviction on a single household in a single unit multiple times. The authors create an empirical typology of serial filing chains to categorize the patterns observed in the dataset. They then test a series of hypotheses about the relationship between landlord portfolio size and serial filings. Households that are filed against in buildings owned by larger landlords are substantially more likely to experience serial eviction filing, and longer serial filing chains, relative to households living in buildings owned by smaller landlords. These results offer the first empirical evidence documenting multiple patterns of serial eviction filing and underscore how landlord filing strategies differ by portfolio size.
Eviction filings are a common experience for low-income renters. For some, the experience of an eviction filing is a discrete, singular event but for many others, the experience is recurring. Many tenants receive multiple filings at the same residential address from the same landlord, often within just a couple of months; this is referred to as “serial filing.” Although previous research acknowledges this practice (Garboden and Rosen 2019; Gomory 2022; Immergluck et al. 2020; Leung, Hepburn, and Desmond 2021), we know little about how such filings are patterned, including how they vary across types of landlords. Exploring these patterns highlights not just when and why tenants fail to pay rent but also the strategies that landlords use as they decide when and why to file for eviction.
Landlords engage in the practice of serial eviction filing as part of their rent collection strategy (Garboden and Rosen 2019; Immergluck et al. 2020; Leung et al. 2021). Often, landlords file for eviction against tenants without the intent to remove them, sometimes filing every month like clockwork, and using the court system as a tool for collecting the rent (Garboden and Rosen 2019). Although recent research identifies this practice, researchers have yet to categorize, classify and evaluate the patterns of these filings. Previous research is unable to empirically distinguish between patterns of serial filings (e.g., tenants who receive two filings within a calendar year versus those who receive five or six during the same period) or the spacing and frequency of those filings (e.g., tenants who receive filings in consecutive months versus those whose filings are spaced out across longer periods). Likewise, previous research has been limited by its examination of serial eviction filing within a substantively arbitrary period of time (usually one year), rather than allowing serial filings to cross multiple calendar years in the housing lifecycle of a tenant. By extending the period of the analysis, we provide analytical clarity on the periods and patterns during which serial filing chains occur. In addition, we show how different types of serial filing chains are related to executed evictions.
Identifying heterogeneity in patterns of serial eviction filing is an important advancement in the growing body of scholarship on the strategies that landlords use to collect rent from tenants, including the way they rely on an overburdened court system to do so (Fleming-Klink, McCabe, and Rosen 2023; Public Justice Center 2015; Sudeall and Pasciuti 2021; Summers 2023). They underscore the variation of landlord practices and point to the heterogeneous meaning of “landlording” in America. Our analysis helps explain which landlords engage in serial filing practices, and how they shape the tenant experience of housing insecurity. As eviction filings are merely the legal manifestation of an unobserved rupture within the landlord-tenant relationship, they can take many different forms. At one end, this relational rupture can be quite ephemeral, as when a tenant with otherwise reliable income misses a single payment and the landlord files against the tenant. On the other extreme, the relational rupture can be quite extended, as when a tenant regularly misses or is late on their payments and a landlord responds, in turn, with repeated eviction filings. For tenants, these patterns point to wide variation in experiences of eviction and eviction filing in their everyday lives. Importantly, an eviction filing can have negative consequences, including housing insecurity and economic hardship, even when it does not result in an eviction (Desmond 2012; Desmond and Kimbro 2015; Fleming-Klink et al. 2023; Garboden and Rosen 2019; Leung et al. 2021; So 2022).
Leveraging a uniquely robust set of eviction data from the District of Columbia Superior court records from 2014 to 2019, this paper studies the patterns and prevalence of serial filings in order to more thoroughly elaborate the theoretical concept and empirical manifestations of serial filing. Individual court records over this six-year period enable us to match filings across individual tenant households. These data overcome an important methodological concern about identifying households that repeatedly show up in deidentified court records. Rather than reporting how many cases are filed in a court, which masks the frequency of those filings against individual households, we focus on the number of unique households experiencing case filings. 1 When a household experiences multiple filings at the same address, the count of total filings in a jurisdiction fails to accurately account for the total number of households touched by the process of eviction. For example, in Washington, D.C., we report that there were 30,523 total filings in 2018. However, after identifying households receiving multiple filings at the same address, we identify 17,569 unique households receiving filings that year. In this way, accounting for serial eviction filing more accurately captures the true nature of eviction filing.
After providing readers with background on the experience of serial eviction filing, we build an empirical and theoretical framework for understanding these patterns. We empirically identify five mutually exclusive types of serial eviction filing patterns, in addition to nonserial single filings: 2 filings in consecutive months, 2 filings in nonconsecutive months, 3 to 6 filings within one year, 7 to 16 filings across one to two years, and more than 17 filings over as many as five years. We show that most chains have an irregular filing pattern with gaps between filings; in fact, it is uncommon for a chain of filings to occur completely, or even predominantly, in consecutive months. Documenting these patterns enables us to better understand the reasons that landlords may file for eviction and how their filing patterns impact renter households. After identifying these patterns of serial filing chains, we introduce a theoretical model to explain the landlord strategies behind these patterns, ultimately laying the groundwork to consider the relationship between landlord portfolio size and filing behavior.
Estimating a series of regression models with serial filing chains as the unit of analysis, we report that landlord portfolio size is positively associated with the probability of a landlord serially filing against a household. Landlord size is associated not only with a greater probability of serial filing but also with longer serial chains. Larger landlords are associated with a lower share of two-filing serial chains and a higher share of medium and long serial chains. Serial filing chains from larger landlords are also less likely to result in an eviction. Importantly, the longest serial chains are the least likely to conclude in a legally executed eviction, a counterintuitive finding that underscores the way landlords rely on the court system to collect rent, rather than to evict. Importantly, these findings extend previous qualitative findings on patterns of landlord behavior to show how landlord strategies engender different patterns of serial eviction filings.
The Process and Consequences of Eviction and Eviction Filing
The experience of eviction is common in the lives of low-income tenants. Over the past few years, a growing body of empirical research documents the negative impact of eviction on renters’ housing security, health, mental health, mortality, disease transmission, educational outcomes, and wellbeing (Desmond 2016; Desmond and Kimbro 2015; Leifheit et al. 2021; Lundberg and Donnelly 2019; Sullivan 2017). But only recently have researchers started to differentiate between the experience of an eviction filing and that of an executed eviction. As most eviction filings do not end in executed evictions, the experience of an eviction filing is far more common than that of an executed eviction in the lives of low-income renters, and has important consequences for tenants in and of itself (Garboden and Rosen 2019; Leung et al. 2021).
Although eviction is often recorded as a discrete moment in which a tenant is removed from the home, the eviction process is more accurately conceptualized as an ongoing conflict between landlord and tenant, manifesting in a series of legal and nonlegal events, only some of which are recorded in administrative data collected through the court system. By theorizing eviction as an extended process rather than a singular legal moment, researchers must look beyond the discrete moment of whether a tenant pays their rent to also consider the landlord’s behavior and a wider set of management and legal processes (Garboden and Rosen 2019). Although nonpayment of rent often triggers the process—indeed, in our dataset, the vast majority of cases are filed for nonpayment of rent—landlords do not file on tenants every time they miss a rental payment. 2 Similarly, not all eviction filings result in executed evictions; in fact, most do not. Acknowledging the discretionary choices of landlords in the process of filing for an eviction invites researchers to more thoroughly conceptualize the relational conflict between tenants and landlords.
In this way, decisions made by landlords shape the patterns of filing and eviction observed in court records. Some simply neglect to file, whereas others informally approach tenants to inquire about the rent before filing (Balzarini and Boyd 2021; Greif 2022). The decision to use a legal filing is associated with the size of the landlord’s portfolio and their level of professionalization: multiple studies now show that larger landlords are more likely to file than smaller landlords (Gomory 2022; Immergluck et al. 2020; Raymond et al. 2018), and although smaller landlords are less likely to file, their filings are more likely to result in executed evictions (Balzarini and Boyd 2021; Gomory 2022; Immergluck et al. 2020; McCabe and Rosen 2020; Raymond et al. 2018; Seymour 2022).
Qualitative research that provides direct observation of landlord decision making helps explain when and why landlords file for eviction against their tenants (Garboden and Rosen 2019; Leung et al. 2021; Gomory and Desmond 2023). This research on landlord behavior identifies strategies used by landlords who rely on the legal system as a tool for rent collection. This tactic results in the practice of serial filing, whereby landlords repeatedly file on the same tenants in the same units, with the intent to collect rent rather than to evict.
Previous efforts to acknowledge the experience of serial filing document trends, but do not fully explore the range of patterns in which serial filing can present, or explain this variation across landlords. For example, Leung et al. (2021) operationalized a serial eviction filing as when a household receives two or more filings between 2010 and 2016. In their data, the median time between filings in a serial filing case is 2.4 months, although some serial filings span multiple years. Among all the filings in their administrative records, 44.6 percent were associated with a serial filing chain. Likewise, among households with at least one eviction filing, Leung et al. reported that just under a third, or 30.4 percent, received multiple filings at the same address. Leung et al. found that most households who experienced serial filings received just two filings—the minimum to be considered part of a serial chain—while other households received three or more. The observed incidence of serial filing varies widely across states, thereby underscoring the important institutional context and regulatory regimes that shape the experience of serial eviction filing (Nelson et al. 2021).
Landlord decision making around filing is also shaped by the housing market in which landlords operate. Using a tract-level analysis, Leung et al. (2021) found that neighborhoods in middle-range rental markets have the highest serial eviction filing rates, as tenants are not financially stable enough to pay on time, though they are able to pay eventually, with the implication that serial filing especially affects those just above the bottom of the rental market. They also found that neighborhoods with a higher concentration of corporate property owners have higher serial eviction filing rates. Other evidence suggests that landlords may be more likely to file for an eviction in locations where they expect the rental unit to be easily filled by another tenant. In jurisdictions where the cost of filing for eviction is low, landlords may be less discerning in their decision to file for an eviction because the cost of doing so is negligible (McCabe and Rosen 2020), whereas counties with more legal and regulatory costs to file have lower serial eviction filing rates (Leung et al. 2021). Landlords also consider the amount of rent owed by tenants in their decisions. They are likely to be more lenient when tenants owe smaller sums of money and stricter when they owe large sums.
Like Leung et al. (2021), we argue that we should not view eviction filing as simply the result of a failure to pay rent but also as the reflection of a management strategy. As such, exploring how different patterns of serial filing chains relate to landlords traits such as portfolio size, is key. We have much to learn about how landlord characteristics (e.g., number of units owned) and tenant characteristics (e.g., race, household size) come together to shape patterns and prevalence of serial filing chains and the probability of such chains resulting in an eviction.
Data and Methods
We focus on three primary research questions related to serial eviction filing chains. First, we ask about the patterns of serial eviction filings that emerge from our data. We identify typologies of serial filing chains to both theoretically categorize and empirically document the range of patterns. By categorizing filing chains, we provide a theoretical advancement in the literature on evictions that considers the range of ways in which landlord-tenant conflict unfolds. Next, we ask whether the prevalence of each type of chain is associated with the size of a landlord’s portfolio. Building from previous qualitative research with landlords, we anticipate variation in filing patterns on the basis of the size of a landlord’s portfolio. Finally, we ask whether the probability that a serial filing chain ends with an executed eviction differs by landlord portfolio size. Although our data enable us to document patterns of serial filings across landlord types, they do not allow us to identify a causal association between landlord size and eviction patterns. Significant associations remain after adjusting for observable tenant, building, and neighborhood characteristics, suggesting that landlord eviction strategies present a plausible explanation for some portion of the bivariate association. However, it remains possible that the tenants or properties of large landlords differ in unmeasured ways from those with smaller portfolios, meaning we cannot definitively rule out selection. Our multivariate models should thus be considered as explorations of the most plausible alternative explanations but are not fully identified and thus are not designed to produce unbiased causal estimates. Purely descriptive bivariate associations are provided in Tables A2 and A3 in the Appendix.
Data
To categorize serial filing chains and test our hypotheses about landlord size, we draw on six years of administrative records from Washington, D.C., courts. We use court records for all 192,064 residential eviction filings in the city from 2014 to 2019. These data identify the name and address of both the defendant (the household being evicted) and the plaintiff (the landlord or their representative). The addresses were matched to geocoded parcel records, with a match success rate of 99.15 percent. In the final analysis, we use a set of 187,725 filing records by dropping 2,147 records that did not have a defendant name associated with the address; 608 records that had “corporate defendants,” leading us to believe that they were misclassified as residential evictions; 350 records that were dropped as likely duplicates (either two filings were made against the same unit on the same day or a household was evicted from a second unit simultaneously, such as a basement) and 1,234 records that were dropped because of the lack of a valid address.
Descriptive statistics for this analytical sample are reported in Table 1. The vast majority of these filings do not lead to removal; 95 percent of eviction filings in the District of Columbia from 2014 to 2019 did not have an executed writ, meaning the tenant was not legally removed from their housing. These filings occur predominantly in areas of concentrated disadvantage. Sixty-four percent of eviction filings occurred in census tracts where more than 75 percent of residents were Black or African American. On the basis of imputed household race, 64 percent of filings were against Black or African American households. Fifty-two percent of eviction filings occurred in census tracts where more than 25 percent of residents were in poverty. Filings were concentrated in unsubsidized buildings owned by large landlords. Eighty-six percent of filings were in buildings with no place-based subsidy, and 80 percent of filings were in buildings owned by landlords with portfolios of 101 units or more.
Descriptive Statistics.
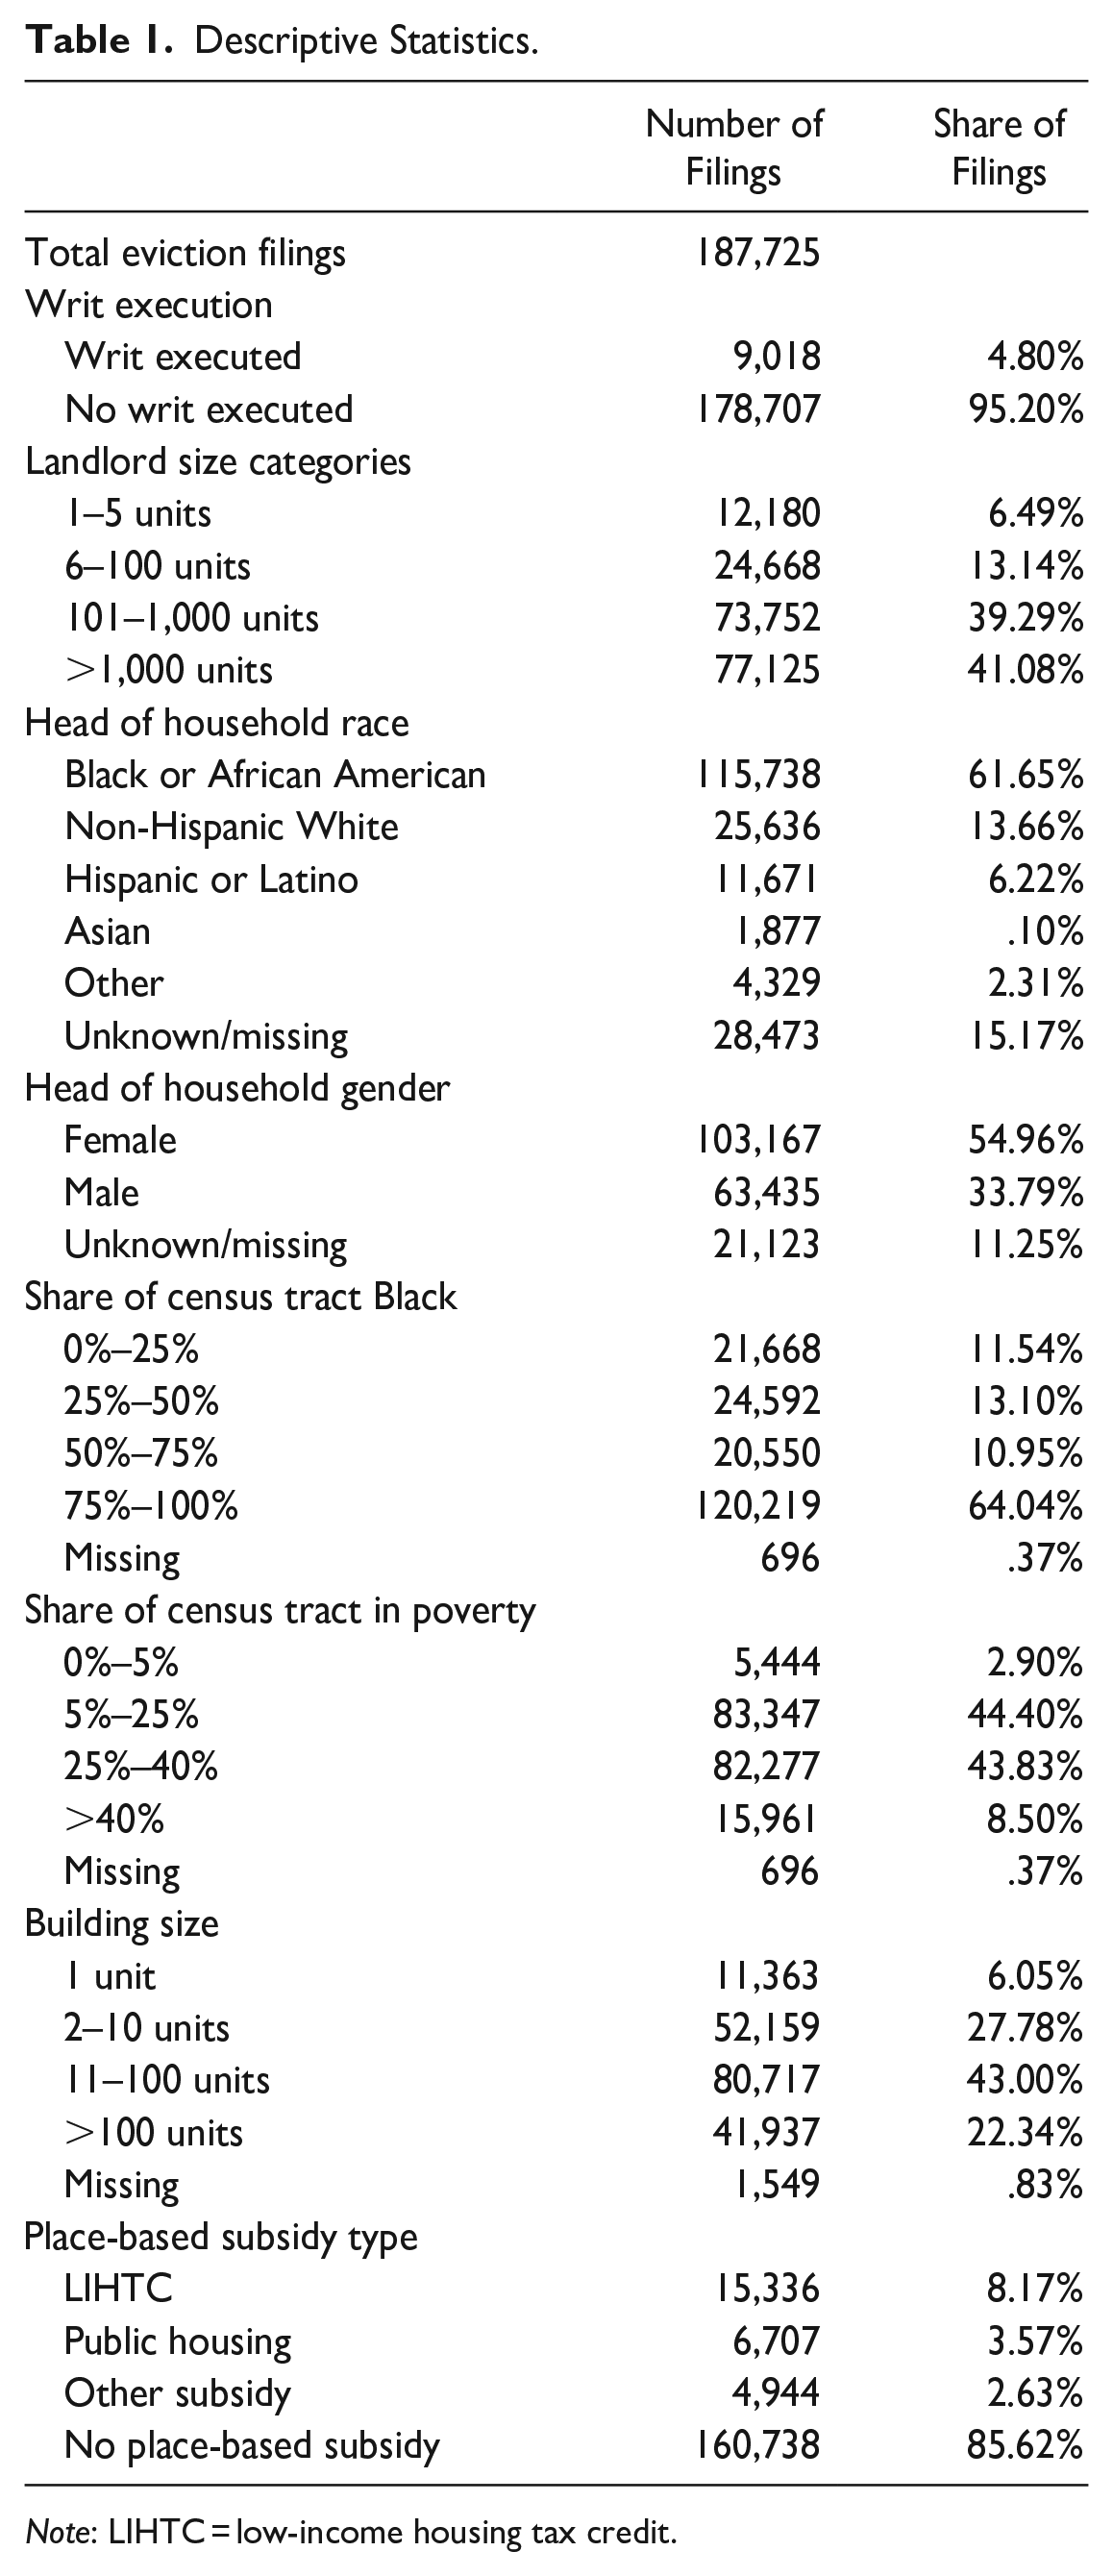
Note: LIHTC = low-income housing tax credit.
In supplemental analyses, we draw on a separate subset of records from 2018, which were hand-coded to identify specific information about the eviction filing from the summons form. This dataset is limited to a random subsample of eviction filings from a single year in our analysis, but includes the monthly rent of tenants experiencing an eviction filing and the amount owed at the time of the filing. We use this subset of data for additional analyses to account for monthly rents. The findings, which we include in Table A1, are similar to those from models drawing on the full, six-year time series.
A recurring issue in research on housing and eviction is gathering accurate data on building ownership (Gomory 2022; Messamore 2023; An 2023; An et al. 2023). This type of information is necessary for accurately identifying landlord size. Our research pulls together multiple data sources to precisely measure property ownership in the District of Columbia. We first merged the “plaintiff” field of the eviction records to the District of Columbia “Address Points” dataset and the public-release file from the District of Columbia Office of Tax and Revenue. These datasets provide full information on property holdings and the number of residential units in all buildings in the District of Columbia, including buildings that did not file for eviction during our time period. However, it is common practice for large landlords to distribute their holdings among several limited-liability corporations (LLCs). Without data on LLC ownership, many large corporate landlords will appear in the data as several distinct, small property owners, making it impossible to draw accurate conclusions about the effect of landlord size on eviction outcomes. As a result of a 2018 District of Columbia law requiring LLCs to disclose their owners, the District of Columbia’s Department of Consumer and Regulatory Affairs maintains the CorpOnline database. This dataset, for which most cities do not have an analogue, allows us to collapse small LLCs to the level of their umbrella owner. Therefore, we can precisely estimate the true number of residential units owned by a given tenant’s landlord. A remaining limitation is that the size of landlords with property holdings outside of the District of Columbia will necessarily be underestimated because our property ownership data sources are specific to the District of Columbia. Finally, we also merge address data with other publicly available data sources to determine whether buildings matched to any subsidized housing program.
While we have some information on the tenants receiving the eviction notice, the administrative eviction data do not include information on the race of the defendant. We impute this information using the wru package in R, which uses Bayesian prediction methods outlined in Imai and Khanna (2016). This method outputs a probabilistic estimate of a defendant’s race (Asian, Black or African American, Hispanic, other, White) on the basis of the surname of the first defendant listed on the filing and the demographics of the census tract in which the property is located. These probabilities are used in our multivariate models to control for household race. 3 For a significant share of households (15 percent) race failed to be imputed because of missing surname or address data; these households are dropped from the analysis. In Table 1, summary statistics for household race represent the average imputed probability for observations with nonmissing data. 4
Defining a Serial Filing Chain
In contrast to previous work, where the unit of analysis is typically eviction filings, eviction judgments, or writs, we use “chains” of eviction filings as our unit of analysis. These chains are an observable manifestation of a single relational phenomenon, a period of precariousness within the landlord-tenant dyad. In other words, a tenant’s experience of precariousness within a particular unit can be modeled as a time-variant process that fluctuates between relatively stable housing situations at one time point to extended periods of instability. These latent experiences of precariousness are often (but not always) because of economic disruptions that cause a tenant to fall behind on rent.
Figure 1 illustrates the complexity of connecting a legal record (the eviction filing, represented by the blue dots) to an unobserved period of conflict and precariousness (represented by the orange shape). Some of these periods of precariousness are negotiated interpersonally and are thus entirely unobserved by the administrative data, as is the case for row 1, for which a brief period of precariousness—a late payment, perhaps—is quickly remediated without appeal to the legal system. In other cases, the same brief period might potentially result in a single eviction filing. As the period of precariousness extends, the likelihood of an eviction filing and an eviction chain also increase, as is shown in rows 3 to 5, although the specific pattern can vary dramatically. Holding the length and severity of the precariousness constant, the observed pattern of filings is largely determined by the landlord’s strategic response to the precariousness. This means that we might expect to see different types of eviction chains even when holding tenant behavior constant. Further complicating matters, it is likely that the landlord’s strategic response influences the pattern of precariousness either by terminating tenancy more (or less) rapidly, or by (dis)incentivizing particular responses from tenants.

Theoretical diagram of chain operationalization.
To practically operationalize this theoretical understanding of serial filing patterns, we first require a working definition of “household.” Garboden and Rosen (2019) referred to serial filing as repeatedly filing on “the same tenant in the same unit.” To accommodate for imperfections in our data—misspellings, abbreviations, and missing unit numbers—this analysis uses the fuzzy matching software MatchIt, developed by Julio D. Raffo for Stata. Households are identified as groupings of defendant names that match with a threshold of 0.75 with the same building address. We do not attempt to identify households who move (same defendant names but different building addresses) within the jurisdiction.
An “eviction chain” is defined as a set of sequential eviction filings against the same defendant household with no more than six months between each filing in the sequence. This means the first filing in a chain is not preceded by another filing against the same household within six months, and the last filing in a chain is not followed by another filing against the same household within six months. Note that this approach requires that we censor some data when we cannot definitively state that we have observed a “complete” chain. When determining whether a filing is part of a serial chain, we must censor single filings that occur within 6 months of the beginning of our sample (January 2014) or within 6 months of the end of our sample (December 2019). Single filings in these censor periods may or may not be part of serial eviction filing chains. When determining the length of a serial chain, we must censor chains (including single filings and serial filings) that start within 6 months of the beginning of our sample or end within 6 months of the end of our sample. Alternative specifications of serial eviction filing chains that allow more than six months between filings do not meaningfully alter our conclusions.
k-Means Cluster Analysis of Filing Chains
Serial filing is not a monolithic or binary process. Receiving two filings in two months, and nothing subsequently, is a qualitatively different experience to receiving eight filings over the course of a year. Therefore, a nuanced analysis will distinguish subcategories of serial eviction filing. To identify these subcategories we used a k-means clustering approach that derived empirical subcategories on the basis of selected attributes of chains.
k-Means clustering was first introduced by MacQueen (1967). The groups identified represent sets that are most similar to one another on the basis of researcher-selected variables. Formally, the objective of k-means clustering is to divide a sample into a predefined number (K) of clusters (C) in such a way as to minimize within-group variation (J) as defined by

where
The four attributes of eviction filing chains used as inputs in the k-means cluster analysis were (1) the number of filings in a chain, (2) the number of filings per month within the chain, (3) the share of filings that occurred in consecutive months within the chain, and (4) whether the chain terminates with a executed writ. The number of filings in the chain captures the length of the tenant’s period of precariousness represented by the chain of eviction filings. Filings per month gives information on how often a landlord actually filed against the tenant during this period of precariousness. Because filing patterns can be highly irregular, we also include the share of filings that occurred in consecutive months, which indicates intensified landlord pressure within a longer chain of filings. Finally, we include whether the chain ends with an executed writ, to illustrate the important distinction between eviction chains that lead to formal, legal removal of the tenant, and those that do not.
The k-means clustering algorithm uses these inputs to create K “types” of eviction filing chains, maximizing intracluster homogeneity and intercluster heterogeneity on these variables. The number of clusters (K) must be determined a priori. Adding additional clusters necessarily reduces error, as a greater number of clusters will always have higher intracluster homogeneity than a smaller number of clusters. However, too many clusters can rob the k-means method of the parsimony that makes it attractive. To determine the appropriate number of clusters, we examined how much reduction in error was achieved by each additional cluster, and also considered whether theoretically important types were being successfully identified.
Analytic Approach
We use several logit models to test the association between landlord size—defined as the total number of residential units owned in the District of Columbia, logged—and serial eviction filing practices. The first model (equation 2) uses chains of eviction filings, including nonserial chains of length 1, as the unit of analysis, testing the association between landlord size (Li) and whether a chain of filings is serial (Si), as opposed to a single, nonserial filing. We include in the model variables at the census tract (Ti), owner (Oi), building (Bi), and household (Hi) levels, which control for the most important factors that may be correlated with both landlord size and serial eviction filing. Specifically, neighborhood socioeconomic characteristics (race, poverty, rental vacancy, ownership rates, education), the number of units in a building, the subsidy status of buildings, the assessment per unit of buildings, the use code of buildings, and imputed household race.

where Pr(Si = 1) = π.
The original 63 use codes are collapsed into the following categories: multifamily, condominium, single family, other residential, mixed use, nonresidential, vacant, and missing. Ninety percent of filings are in multifamily buildings, and 96 percent are in multifamily, condominium, or single-family buildings. Landlord unit total is logged because of our expectation that the log odds of serial eviction will increase linearly as a function of logged number of units. Effectively, taking the log of landlord unit total models the expectation of a larger difference in behavior between a 1-unit landlord and a 10-unit landlord compared with the difference in behavior between a 101-unit landlord and a 110-unit landlord. The subsidy status of buildings is simplified to public housing, low-income housing tax credit, and other subsidies. More complex multilevel mixed-effects models do not produce substantially different results.
In addition, we also test the association between landlord size (Li) and whether a chain of eviction filings, including nonserial chains of length 1, belongs to a given cluster of serial filing chains (Cki). This is estimated using five separate logit models (equation 3) with the same control variables as equation 2. Finally, we test the association between landlord size (Li) and whether a chain of eviction filings terminates in a writ-executed filing (Wi). This is estimated using a logit model (equation 4) with the same control variables as equation 2.

where Pr(Cki = 1) = π k and k = {two dispersed, two in a row, medium, long, very long}.
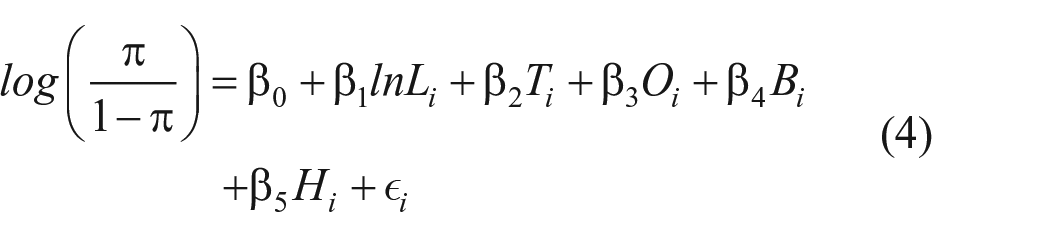
where Pr(Wi = 1) = π.
Findings
Cluster Analysis Results
Our approach identified six clusters: five serial filing chains and one category for single, isolated filings. The machine learning algorithm does not assign meaning to these chains, but they can be described primarily in terms of their length:
Single filing: 1 filing not preceded or followed by another filing against the same household within six months
Two dispersed: exactly 2 filings against the same household in nonconsecutive months
Two in a row: exactly 2 filings against the same household in consecutive months
Moderate-length chains: between 3 and 6 filings in the chain (50 percent of moderate-length chains take place over a period of 7–12 months)
Long chains: between 7 and 16 filings, generally over the course of one to two years (50 percent of long chains take place over a period of 15–25 months)
Very long chains: more than 17 filings over the course of several years (75 percent of chains in this category are between 17 and 26 filings in length, and 50 percent of very long chains take place over a period of 32–47 months)
As shown in Figure 2, the k-means clustering error does not appreciably decline with more than six clusters. Approaches with fewer clusters combined categories 2 and 3 as well as 5 and 6. However, given the theoretical value of the distinctions, we have chosen to use the six cluster results for subsequent analyses.
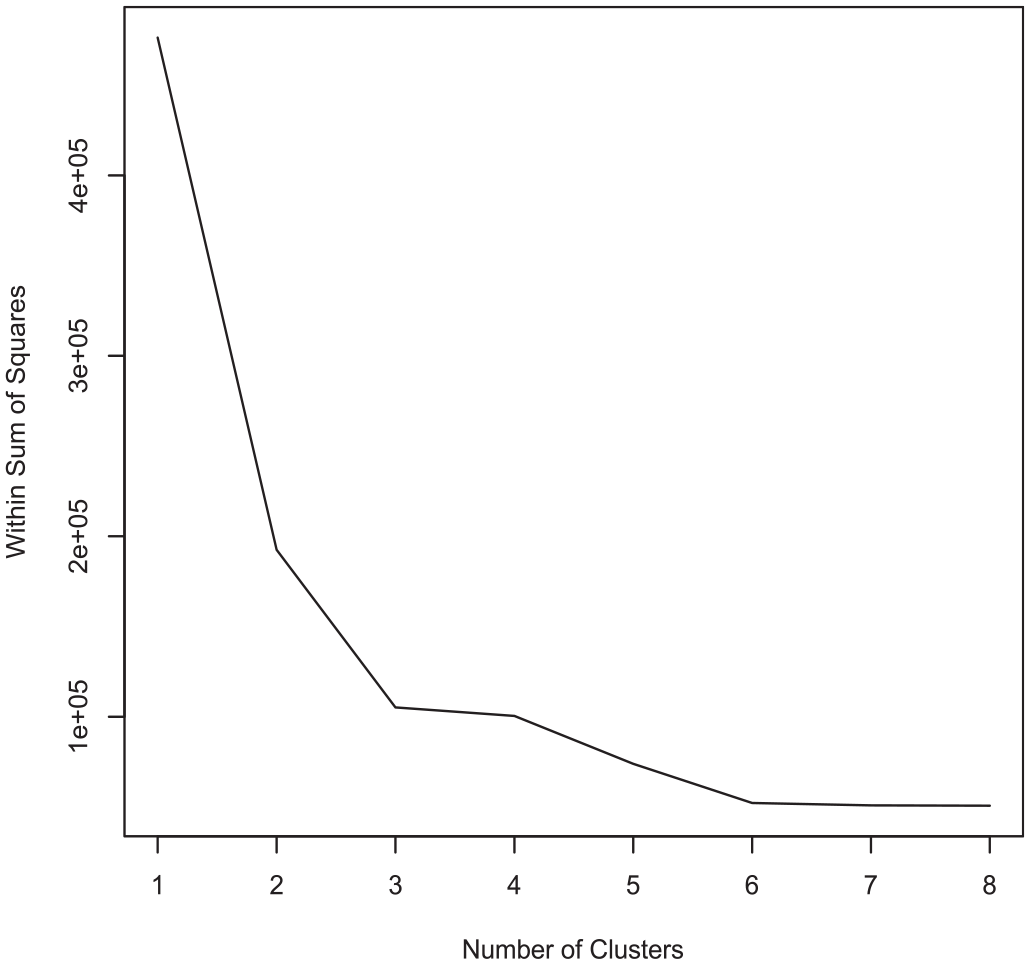
Reduction in error by number of clusters.
Throughout our analysis, the unit of analysis is a serial filing chain: the set of filings against the same household separated by no more than six months. A filing with no prior or subsequent filings against the same household within six months is considered a “single filing,” or a chain of length 1. The types of serial filing chains are mutually exclusive and exhaustive (there is no “miscellaneous” category). Figure 3 provides descriptive statistics on each type. Taking chains as the unit of analysis, the majority (68 percent) are single filings. However, the majority of filings (64 percent) are part of some form of serial filing chain. Surprisingly, it is unusual for a household to receive a filing every consecutive month over the course of a serial filing chain. Median filings per month are closer to 0.5 across all serial categories except “two in a row,” suggesting that the median experience is a filing every other month. However, the share of filings that occur in consecutive months ranges from 0.20 in medium serial chains to 0.55 in very long serial chains, meaning that a household receiving eviction filings in consecutive months is more common in longer serial chains. Long and very long chains, which indicate a landlord-tenant conflict extending over at least seven months and often longer than one year, account for a small share of chains (4 percent) but a meaningful share of filings (22 percent). 5

Characteristics of eviction filing chains.
The share of chains that conclude in writ-executed filings does not vary substantially between single filings and shorter serial chains, but is substantially lower for very long serial chains. This suggests that households which receive more than 17 filings in a chain are about half as likely to be formally removed from their housing as those who are only filed upon once. These data cannot provide insight into informal evictions, such as a family making a non-court-enforced move following a protracted battle with their landlord.
Table 2 shows that, absent statistical controls, larger landlords are less likely to issue single filings, as a share of their chains. Larger landlords are also more likely to issue medium, long, and very long chains.
Share of Filing Chains by Subcategory by Landlord Size.

Concentration of Filings
Eviction filings, and serial filings in particular, are disproportionately concentrated among a subset of property holders who own a relatively small proportion of total units. We can consider a property holder’s filing rate as their number of filings over the full 2014 to 2019 time period divided by their total number of units owned. The concentration of filings, chains, and long/very long chains can be evaluated by comparing, among the landlords with the highest filing rates, the cumulative total of these eviction outcomes against the running total of their units owned. Figure 4 estimates the concentration of filings, subsetting the data to multifamily properties. We are unable to examine the concentration of filing among all property owners, because there is no accurate way to differentiate homeowners and tenants within single-family homes for which an eviction has never been filed. We can, however, consider the concentration of evictions among noncondominium multifamily property owners, which account for 90 percent of eviction filings in the District.

Multifamily landlord eviction and serial chain proportionality.
In multifamily properties, the 154 landlords with the highest filing rates account for more than 50 percent of eviction filings in multifamily properties from 2014 to 2019 but own fewer than 13 percent of multifamily units. The 1,522 landlords with the highest filing rates account for more than 90 percent of eviction filings in multifamily properties but own fewer than 43 percent of multifamily units. Landlords owning approximately 18 percent of the multifamily units in the District of Columbia had no interaction with the eviction system from 2014 to 2019. Serial chains are even more heavily concentrated. The landlords who account for 90 percent of serial eviction chains in multifamily buildings own fewer than 36 percent of multifamily units. The landlords who account for 90 percent of long and very long chains in multifamily buildings own only 21 percent of multifamily units; this amounts to only 106 distinct landlords.
Not all landlords participate in eviction filing and serial filing to the same degree. A relatively small number of actors file the vast majority of eviction filings, particularly the longest serial chains. Much of this concentration of eviction filings can likely be explained by the segregation of low-income families of color, both citywide and within neighborhoods. However, our findings below suggest that differences in landlord strategy also likely help drive the striking concentration of filings observed in these data.
Regression Model Results
Results from the multivariate logit regressions, shown in Tables 3 to 5 below, support the hypotheses that eviction chains represent, at least in part, a strategic decision by landlords. Specifically, we observe higher incidences of serial chains in properties owned by landlords with larger portfolios, net of a variety of observable characteristics. Table 3 estimates the probability that an eviction filing chain will consist of two or more filings. 6 The results show a statistically significant and substantively large effect of landlord size on the probability of serial filing, across a variety of specifications.
Probability That an Eviction Filing Pattern Is Serial.

Note: Values in parentheses are robust standard errors. Predicted White is omitted because of multicollinearity. Building use code is relative to single-family buildings. Other use code coefficients are omitted for space. LIHTC = low-income housing tax credit.
p < .10. **p < .05. ***p < .01.
Probability That a Serial Eviction Filing Chain Is of a Particular Type.

Note: Values in parentheses are robust standard errors. Predicted White is omitted because of multicollinearity. Building use code is relative to single-family buildings. Other use code coefficients are omitted for space. LIHTC = low-income housing tax credit.
p < .10. **p < .05. ***p < .01.
Probability of Filing Chain Ending in Writ-Executed Eviction.
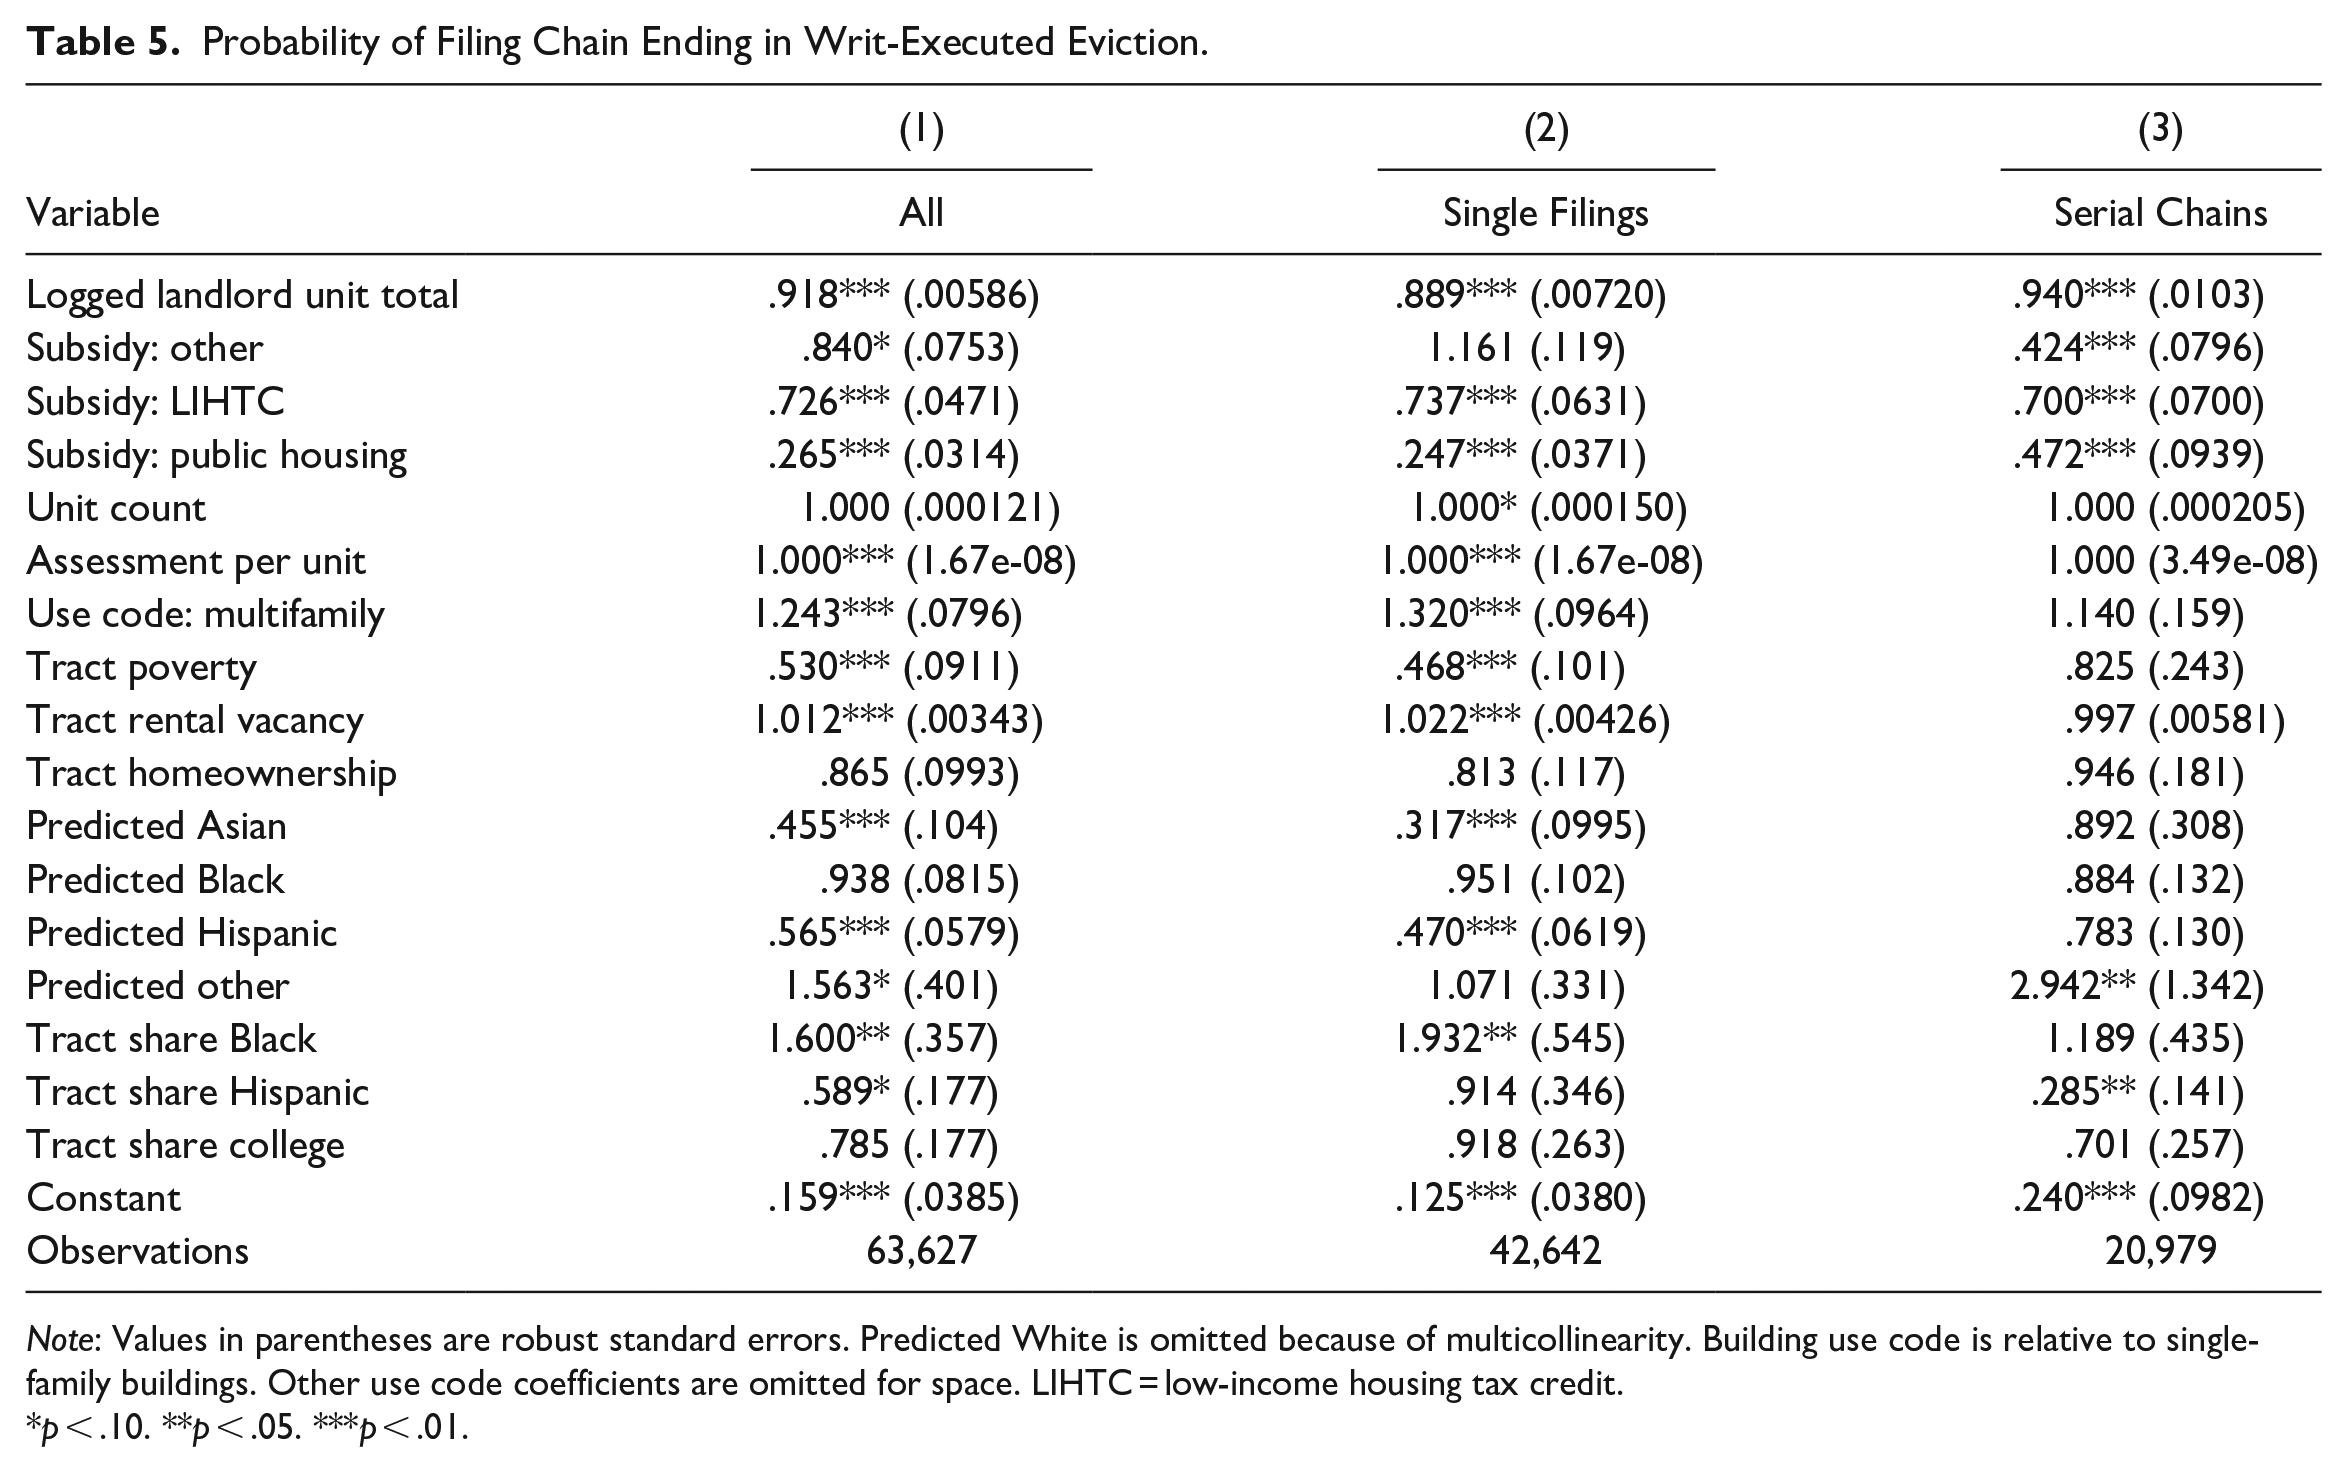
Note: Values in parentheses are robust standard errors. Predicted White is omitted because of multicollinearity. Building use code is relative to single-family buildings. Other use code coefficients are omitted for space. LIHTC = low-income housing tax credit.
p < .10. **p < .05. ***p < .01.
The strength of the association between landlord portfolio size and chains of two or more filings does not change appreciably after adjusting for unit subsidy type, building size, neighborhood characteristics, and imputed race. To capture potential selection by unit price (and to serve as a rough proxy for household income), Table A1 controls for monthly rent, using the random subsample for which it is available. Controlling for monthly rent has a negligible effect on our other findings.
Table 4 estimates the probability that a serial eviction filing chain will be of a particular type (excluding single filings). The results show that, as landlord portfolio size increases, the probability that a filing chain is medium, long, or very long increases, and the probability that a filing chain is two dispersed or two in a row decreases relative to all other types.
Table 5 estimates the probability that an eviction filing chain will conclude in a writ executed eviction, indicating that the tenant was formally removed from their housing through the legal process. For a single filing, this means the single filing resulted in an executed eviction. For a serial chain of two or more filings, this means the last filing in the chain resulted in an executed eviction. Column 1 estimates the probability for all filing chains, column 2 only estimates the probability for single filings, and column 3 estimates the probability for all types of serial chains. Across all specifications, landlord size is negatively and statistically significantly associated with the probability of a filing chain ending in eviction, but the magnitude of the effect is substantially larger for single filings than for serial chains.
Because landlord unit totals are logged, and odds ratios are reported for the models, interpreting the magnitude of the landlord size effects from the tables alone can be challenging. We provide additional figures to aid in illustrating these effects. Figure 5 shows that the predicted probability that a filing chain is serial is only 17 percent for landlords who only own a single unit, rising to 42 percent for landlords who own 1,000 units and 49 percent for landlords who own 5,000 units. 7 Figure 6 shows how the predicted probability that a serial filing chain is a given type varies on the basis of landlord size. The probability that a chain is of medium length increases substantially from 26 percent among the smallest landlords to 42 percent among the largest landlords. Long and very long chains are uncommon at any landlord size, but the differences in probability are still meaningful. The predicted probability that a serial chain is long increases from 3 percent among the smallest landlords to 12 percent among the largest landlords. The predicted probability that a serial chain is very long increases from 0.2 percent among the smallest landlords to 1.1 percent among the largest landlords. Finally, in Figure 7, we can see that the predicted probability that an eviction filing chain ends in a writ executed eviction decreases substantially from 15 percent among the smallest landlords to 8 percent among the largest landlords.

Probability of eviction filing chain being serial.
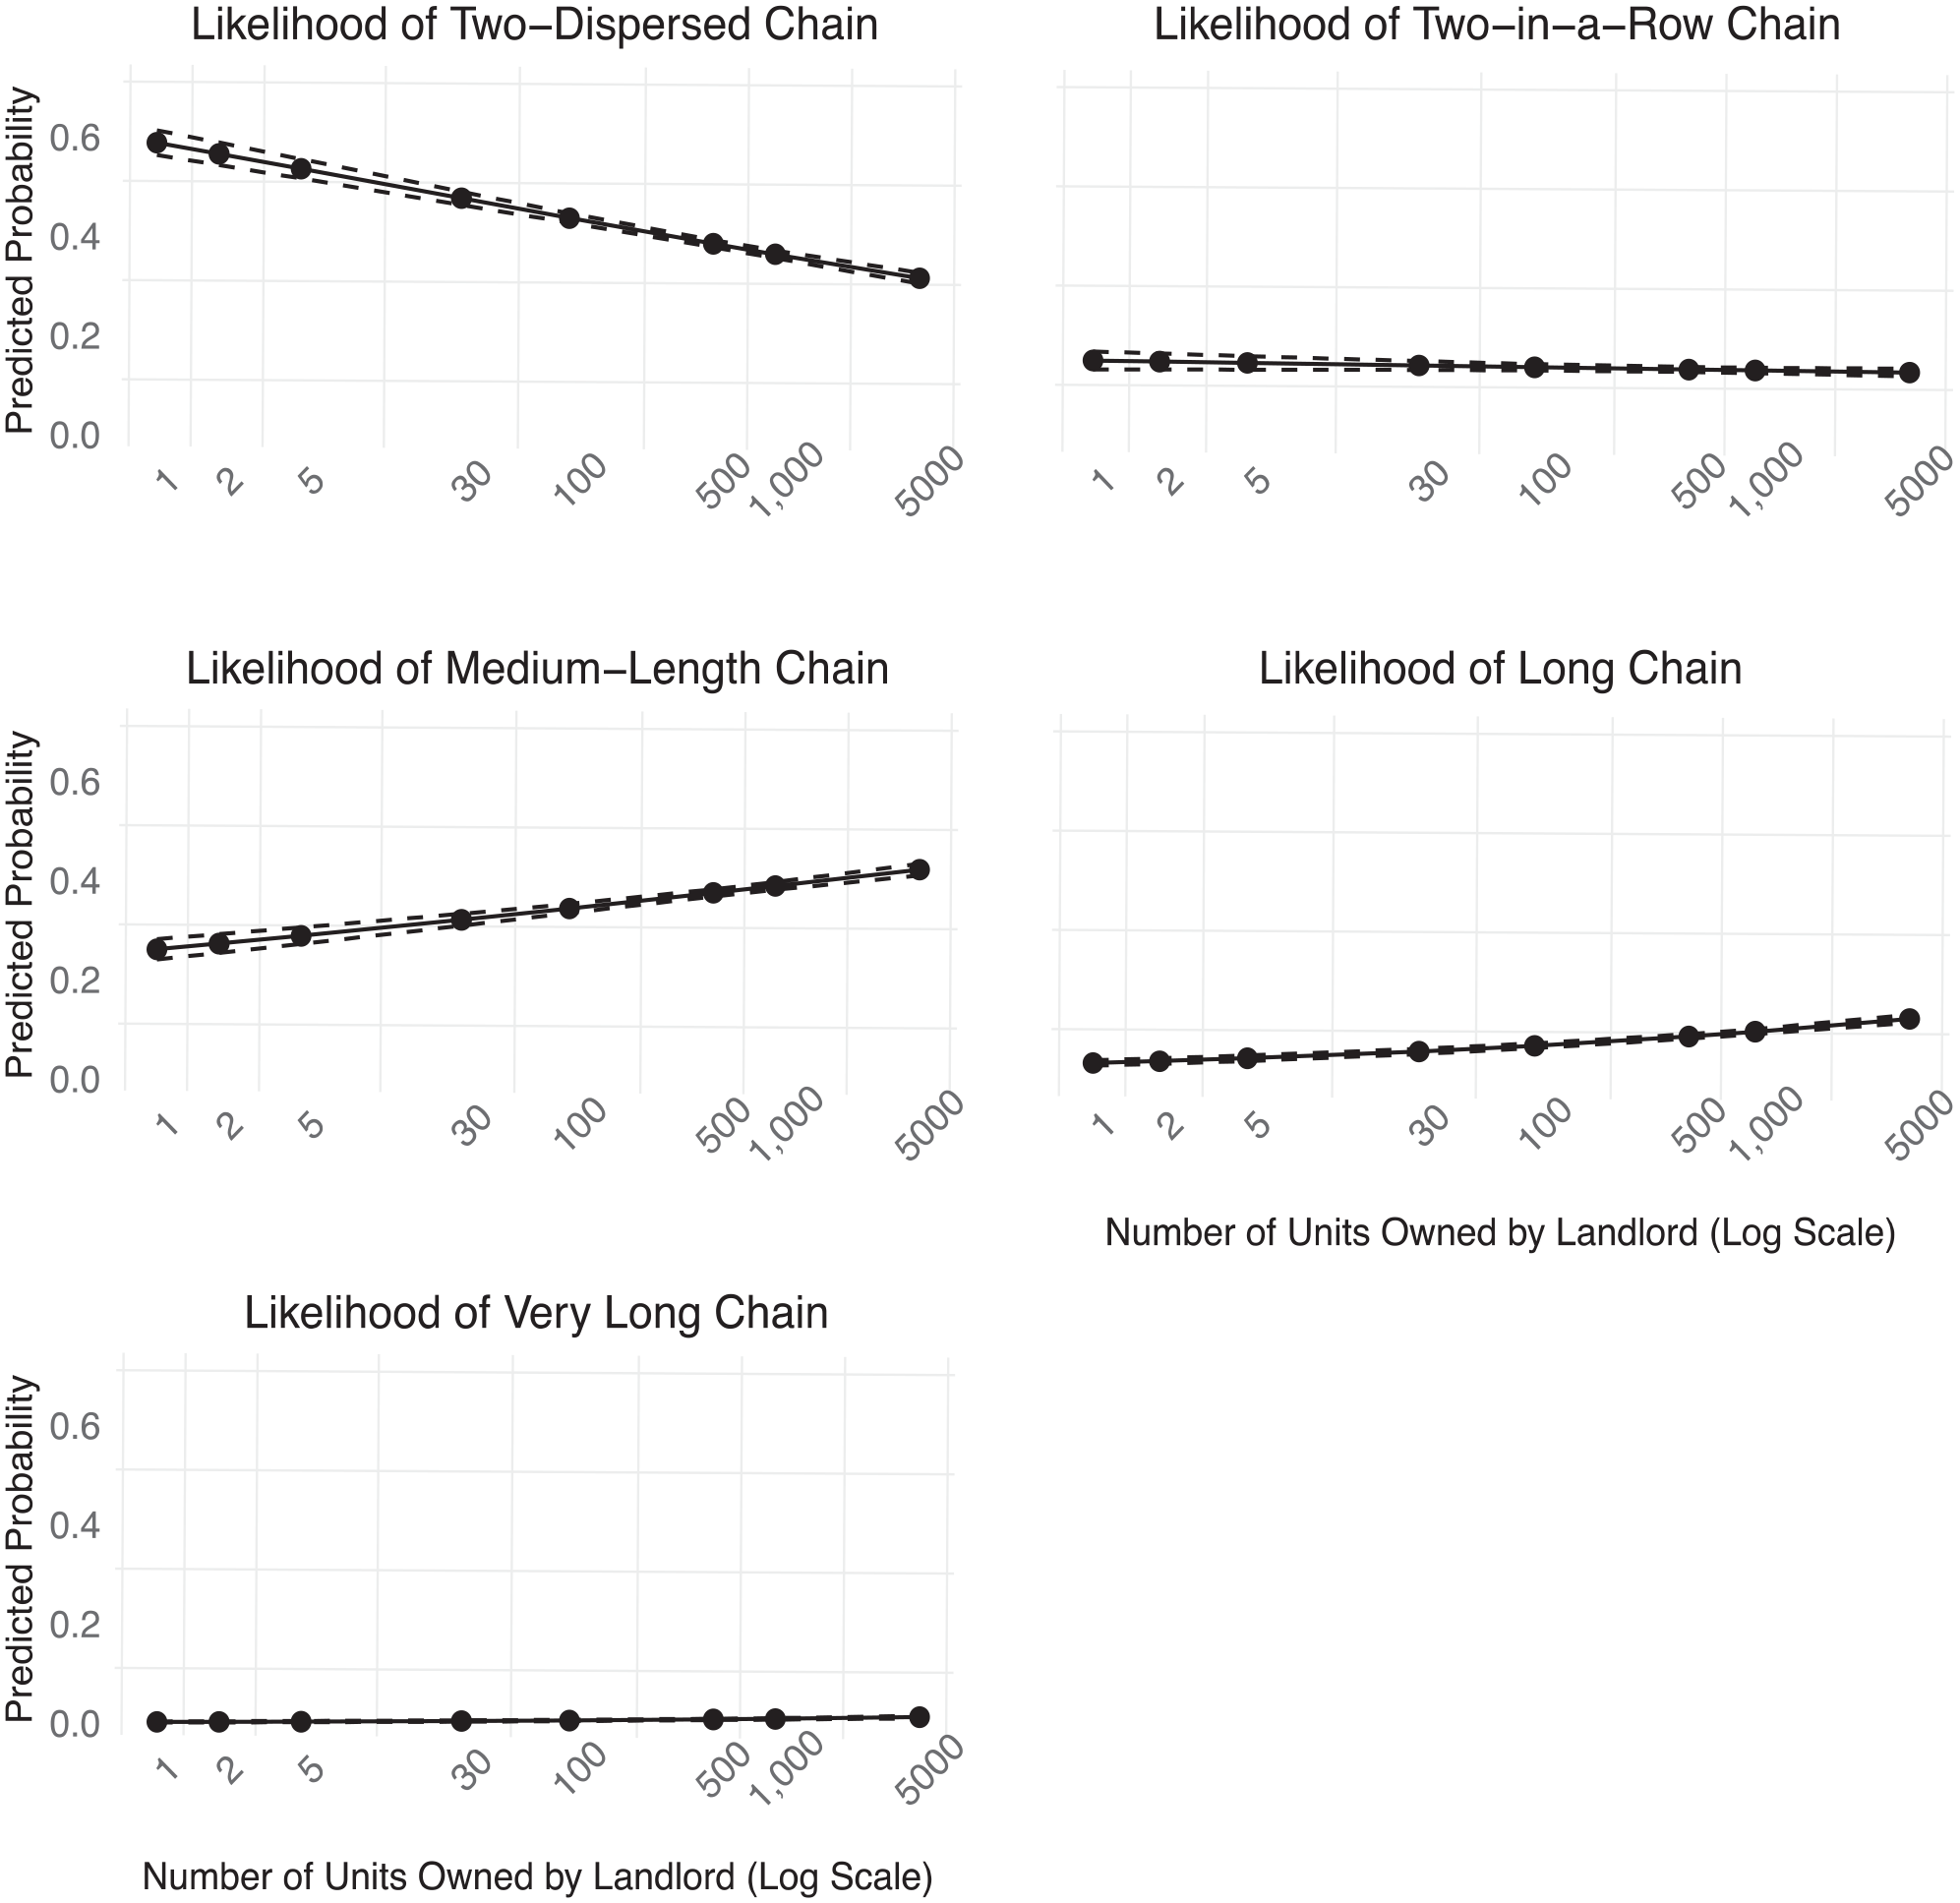
Predicted probability of chain clusters by logged landlord size, conditional on chain being serial.

Probability of chain ending in eviction.
Discussion
In this article, we describe and quantify the experience of serial eviction filing by using filing chains as our unit of analysis. In doing so, we offer an important new unit of analysis for researchers studying the process of eviction and the role that landlords play in this process. This unit of analysis allows us to differentiate between various types of serial eviction filing chains to underscore the heterogeneous experience of the eviction process and point to the multiple strategies landlords use when filing for eviction.
Across eviction filing chains, we find substantial variation in length, number of filings, filings per month, share of filings in consecutive months, and the execution of a writ. It is relatively rare for filings to occur in consecutive months over the course of the chain. Instead, serial chains tend to consist of filings that occur approximately every other month, although the intervals are rarely consistent. More research is needed to fully interpret this pattern, but it is suggestive of a situation in which low-income tenants frequently struggle to afford their housing but also strive to avoid eviction. In this model, tenants are able to shift expenditures and catch up on rent at various time points only to fall behind again as other necessities take precedence. The patterns observed in the data thus differ from what might be expected should tenants simply cease paying rent entirely (which would be more likely to occur in the data as one or two filings followed by an executed eviction) or tenants who are routinely and predictably late on rent (long series of regular filings every single month).
Importantly, we find that landlord portfolio size is significantly associated not only with serial eviction filing but also with longer serial chains. Medium, long, and very long chains of serial eviction filings are substantially more likely to occur for households in buildings owned by larger, professionalized landlords. Although few filing chains end in actual eviction, our data show that very long filing chains are even less likely to end in eviction than shorter ones. This supports the theory that the landlords who file for eviction most frequently may not be doing so with the intent to evict tenants, but rather as a rent collection strategy.
Although our models identify patterns in the serial filing process, they also provide insight into the latent relational conflict between landlords and tenants. As we noted at the beginning of the article, the actions of both tenants and their landlords determine the outcomes observed in our administrative data. Tenants are sometimes late on rent. This action, whether voluntary or not, places tenants in a position of vulnerability relative to their landlord. They become “evictable” when they fall behind on rent, although they are not typically evicted. Acting on this information, landlords decide when, whether, and how frequently to file for eviction. The process of filing is not an automatic decision on the part of landlords, as many instances of unpaid rent do not result in an eviction filing. Instead, it represents a strategic response that is heavily shaped by the landlord’s business model. With the analysis presented in this article, we begin to provide a deeper empirical and theoretical account of these landlord-tenant dynamics, and shed light on landlord strategies related to filing. Doing so contributes to our understanding of the decisions made by landlords as they respond to tenants’ housing insecurity.
In addition to advancing scholarship on serial eviction filing, we also contribute to a better understanding of the complex data issues around property ownership. We use tax data to match landlords to their umbrella LLCs, allowing us to correctly characterize ownership patterns, measure the number of units owned, and identify “large landlords” in the District of Columbia. The District’s unique open data on LLC ownership make our analysis stronger than most, and we are confident in our measurement of landlord size. However, we still face key limitations that present as pressing puzzles for future scholarship. First, our data are limited by what the data from the Office of Tax and Revenue and the Department of Consumer and Regulatory Affairs reveal. These data may not fully capture the network of corporate landlords and institutional investors, particularly those engaged in relationships of shared ownership. Second, while our data are limited to the District of Columbia, property ownership is not contained by state and local borders. Without a regional (or even national) approach to understanding landlords’ holdings, the central questions of landlord size and “who owns what” remain slightly obscured. Our analysis therefore lends weight to the importance of scholars across jurisdictions working collaboratively to disentangle property ownership structures and share data (An et al. 2023).
Conclusion
Our finding that larger landlords are more likely to engage in the practice of serial filing, in combination with the finding that longer serial chains are less likely to end in eviction, has important implications. If landlords are using eviction court as a debt collection agency, straining an already burdened court system, what can be done? How can landlords more successfully collect rent without causing harms to tenants, including marking their credit and residential histories, by filing for eviction?
There are a number of public policy approaches at the local level. Some policies work to disincentivize eviction filing as an automatic process by increasing the cost to file or disallowing the filing of eviction notices for under certain sums of money. The goal of these policies is to limit filings to cases in which the landlord views a legal process as absolutely necessary for rent collection. In 2022, the District of Columbia banned eviction filings when the tenant owed less than $600 in rent. Several actors in the District have also taken steps to increase the burden of filing for landlords to decrease frivolous filings. In Washington, D.C., the filing fee of $15 is among the lowest in the country, compared with a mean eviction filing fee of $106 in 50 of the largest U.S. cities (Nelson et al. 2021), or $109 across 958 counties in 28 states (Leung et al. 2021). By increasing the cost of filing for an eviction, the court system could disincentivize serial filing as a debt collection mechanism (Gomory and Desmond 2023).
Eviction diversion programs, such as those enacted in Philadelphia, may provide alternatives to the eviction process (Treskon et al. 2021). These programs provide mediation services between tenants and landlords to help address the latent relational conflict outside of the theater of the courtroom. They may also include financial resources, including money for back payment of rent, to prevent the need for landlords to enter the judicial process. These programs provide benefits for tenants and landlords engaged in a conflict, and may also help ease the burden on courtrooms. Additionally, evidence from the COVID-19 pandemic underscores the value of well-implemented emergency rental assistance programs as an effective tenant-side intervention to avoid eviction which also benefits landlords (Aiken et al. 2022). These programs work to resolve the landlord-tenant dispute by providing cash assistance to cover the unmet payments. When properly implemented (by preventing a filing from being made), they obviate the need for eviction filings by helping ensure that tenants are up to date on their rental payments. Ultimately, a stronger safety net that guarantees affordable housing and ensures that tenants have the resources to pay their monthly rent is the best guarantee against serial filing and eviction itself.
Our analysis of serial filings, and the role of large landlords in driving this process, point to the need for a serious consideration of landlord-side interventions to reshape the practices around eviction filings. The consistent finding that larger, corporate landlords tend to engage in serial filing without evicting their tenants suggests that policy proposals aimed at these large landlords could discourage serial filing. This could include citywide funds from which landlords could draw to cover missed rental payments. Given the concentration of filings among landlords, public policy could hone in on a relatively small number of key actors in the eviction process to meaningfully stem the number of evictions.
Ultimately, the most important take away from our analysis is that eviction is not a monolithic experience. One household that is behind on rent might experience a single filing, whereas another may find itself embroiled in a chain of eviction filings lasting a year or longer. Some of these households will be formally and legally removed from their housing, as our conventional understanding of eviction might suggest, but most will not. This diversity of experiences is partially informed by the tenant and their level of economic precarity. A long chain of eviction filings is necessarily predicated on an extended delinquency on rent payments. But whether a tenant receives one eviction filing, many, or none at all is also influenced by their landlord’s strategic decision making. A more nuanced understanding of these decisions reframes eviction as a variable process in which landlords strategically use legal threats to collect rent and maintain power dynamics.
Footnotes
Appendix
Probability of Filing Chain Ending in Writ-Executed Eviction, Bivariate.

| (1) | (2) | (3) | |
|---|---|---|---|
| Variable | All | Single Filings | Serial Chains |
| Logged landlord unit total | .910*** (.00454) | .880*** (.00525) | .943*** (.00917) |
| Constant | .194*** (.00562) | .201*** (.00654) | .198*** (.0123) |
| Observations | 63,627 | 42,642 | 20,979 |
Note: Values in parentheses are robust standard errors.
p < .01.
Funding
The author(s) disclosed receipt of the following financial support for the research, authorship, and/or publication of this article: Funding for portions of this project was provided by the Georgetown University Provost’s Office and the Meyer Foundation.
1
This statistic is now reported by the Eviction Lab as the “households threatened rate.”
2
Indeed, most eviction filings are for nonpayment of rent, suggesting that the root cause of filings is related to housing unaffordability and poverty itself (Ellen et al. 2021; ![]() ).
).
3
Our findings are suggestive of a relationship between household race and eviction outcomes, but struggle to disentangle our imputed household race measure from the neighborhood characteristics which inform it. Descriptively, Black households are more likely to be serially filed against and more likely to be ultimately displaced than White households, but it is unclear whether this is the result of neighborhood characteristics or the result of racism at the landlord-tenant level. Improved administrative data that reports household race among households who receive filings could shed more light on this important question.
4
An alternative approach to imputation of race would be to assign individual observations to a single race category if the observation’s imputed probability of belonging to that category is greater than 50 percent. If no single race category has an estimated probability greater than 50 percent, the observation’s race would be considered unknown and dropped from the analysis. Controlling for a household’s assigned race category on the basis of this threshold, rather than controlling for their imputed probability directly, does not substantively affect the results of the multivariate models in this analysis.
5
These figures include single filings. Long and Very Long chains account for 12 percent of serial filing chains and 34 percent of serial filings.
6
The coefficients reported are odds ratios; values greater than 1 indicate a positive association and values less than 1 indicate a negative association.
7
There are 25 property owners that own more than 1,000 units in the District of Columbia, 4 that own more than 3,000 units, and 2 that own more than 5,000 units.