
Abstract
A small but growing literature uses the risk ratio as an association or effect measure. Unlike odds ratios, risk ratios are unaffected by rescaling or noncollapsibility bias and are straightforward to interpret. However, the risk ratio has one unattractive property that researchers need to be aware of: it is not symmetric with respect to the outcome definition. The ratio between two groups’ probability of success does not equal the inverse of the ratio between the two groups’ probability of failure. Choosing the category of a binary outcome to use as the “success” category can significantly affect substantive conclusions, particularly in research comparing risk ratios with highly different base rates of the “success” outcome. The authors give examples from discrimination and social mobility studies that illustrate this point and present rules of thumb for the use of the risk ratio depending on the base rate of the outcome.
Sociologists routinely analyze the relationships among categorical variables. One prominent example is the social mobility table, in which parents’ and offspring’s social classes are cross-classified. Another is the recent set of studies formally meta-analyzing discrimination estimates from field experiments. Although many association metrics exist for analyzing such discrete data, odds ratios are the most widely used in sociology. However, odds ratios are affected by what is commonly referred to as noncollapsibility or rescaling bias: when controlling for (or collapsing over) covariates orthogonal to the predictor of interest, the magnitude of an odds ratio does not equal the marginal (unadjusted) odds ratio (Breen, Karlson, and Holm 2018). In this respect, the odds ratio differs from linear model coefficients and measures related to linear regression, like risk differences, which are unaffected by controlling for orthogonal covariates. In addition, the odds ratio is unintuitive and applied researchers often misinterpret it in applied work. These difficulties have led some authorities to suggest abandoning logistic regression, based on odds ratios, in favor of linear regression (Mood 2010), which has its association equivalent in differences in probabilities of outcomes between groups.
An alternative association measure is the risk ratio (or relative risk), the ratio between two groups’ conditional probabilities of a binary outcome. In biostatistics and medicine, many studies use the risk ratio. In social science, the use of risk ratios has been less frequent, but has increased over time. In part this is because of growing concerns about the shortcomings of odds ratios. For instance, the risk ratio has been used in studies of discrimination outcomes to analyze the prevalence of discrimination (e.g., Pager 2003; Quillian and Lee 2023). Recently, risk ratios involving child and parent college attainment have been used to compare educational mobility across countries (Betthäuser, Kaiser, and Trinh 2021), and they have been used to compare black and white mortality rates before and during the coronavirus disease 2019 pandemic (Shannon et al. 2022).
The risk ratio has four attractive properties (Cummings 2009). First, it has a straightforward interpretation as the ratio between two conditional probabilities, which can be communicated to a broad audience. Second, like the risk difference, the risk ratio is collapsible, meaning that controlling for covariates orthogonal to the predictor of interest does not change the magnitude of the risk ratio. Third, when the outcome is rare, the risk ratio approximates the odds ratio (this is a reason case-control studies in health research often use risk ratios). Fourth, it is straightforward to estimate risk ratios using generalized linear models. A Poisson regression model with robust standard errors can be used to model the relative risk of an outcome in binary data (Zou 2004). This model is an analog to using logistic regression with odds ratios.
Despite these advantages, the risk ratio has one unattractive property that has received little attention in social science: it is not symmetric with respect to the outcome definition. 1 The ratio between two groups’ probability of success does not equal the inverse of the ratio between the two groups’ probability of failure. Although this asymmetry is not a problem in itself, when researchers use risk ratios to compare the strength of association across groups, populations, or studies in which base rates differ, the results of the comparison may change. Moreover, the magnitude of association based on interpreting the ratio will often appear considerably different using one outcome definition compared with the other. Choosing one outcome definition over the other can significantly affect substantive conclusions.
We suggest a few steps as best practices in using risk ratios. First, risk ratios are most often appropriate when the base rate of the event across risk ratios is infrequent—below 50 percent—with the average rate being significantly lower. Odds ratios or risk differences will often be better measures of the strength of association when this condition is not met. Second, it is best practice to report risk ratios with other effect measures, such as the odds ratio or risk difference. Comparison with other measures is especially important when base rates of the risk ratios are highly unequal.
The Asymmetry of Risk Ratios and What It Means for Applied Research
A risk ratio is a ratio between two groups’ conditional probabilities of a binary outcome. Let Y denote a binary outcome variable and X a binary predictor variable. Then we can define two risk ratios in terms of either success (Y = 1) or failure (Y = 0):

and

The ratio between these two ratios is given by
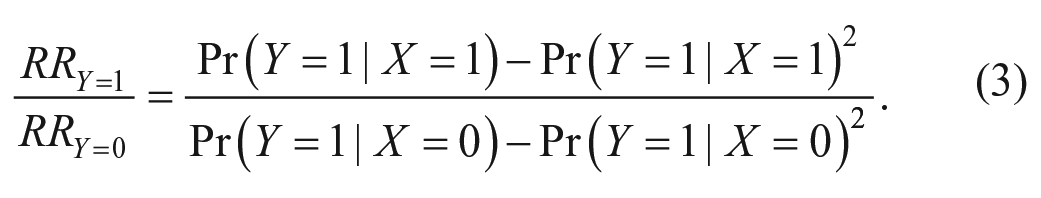
Equation 3 will generally differ from unity, except in two scenarios: (1) when X and Y are statistically independent (i.e., when the conditional distributions of Y given X are the same) and (2) when the conditional distributions are perfectly asymmetric, for example, if
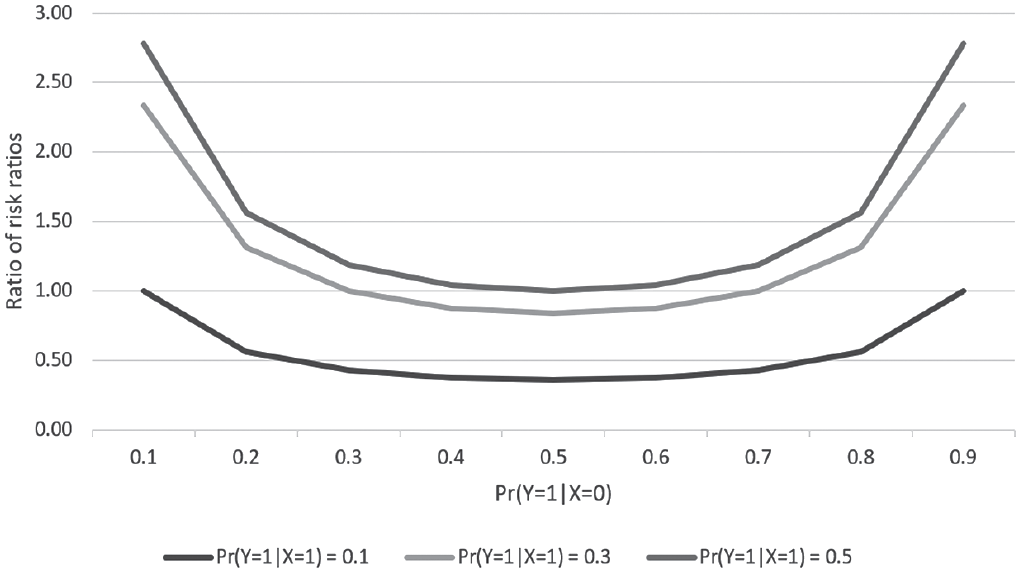
Ratio of risk ratios by outcome definition, RRY=1/RRY=0.
As a stylized example, Table 1 shows the conditional distribution of a binary outcome variable (Y) given a binary predictor variable (X) for two groups. The data could represent the conditional probability of a child obtaining a college degree (Y = 1) conditional on whether they are born to college-educated parents (X = 1) or parents without a college education (X = 0). Groups could represent two different countries. In this example, we find that for group A,
Conditional Distribution of Y Given X in Two Groups.
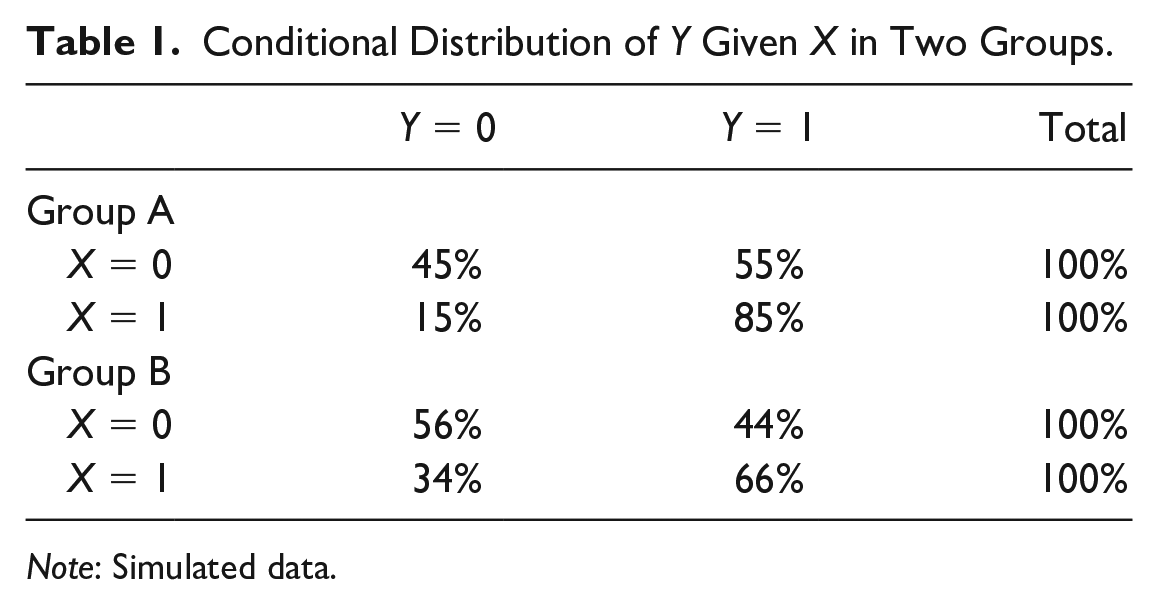
Note: Simulated data.
When will this asymmetry of the risk ratio be a problem in applied research? Imagine that we are interested in comparing intergenerational education mobility between countries A and B by comparing parents’ and children’s college attainment in each country. If we used the risk ratio for obtaining a college degree (Y = 1), countries A and B would be equally mobile (
In contrast to the risk ratio, the odds ratio and the risk difference are symmetric with respect to the outcome definition. In a two-by-two table, the odds ratio is the cross-product of the four joint cell probabilities (or frequencies). This implies that altering the marginal distribution of a variable (multiplying a row or column of the joint distribution table by a constant) will not change the odds ratio, because the factor multiplied by will appear in the numerator and denominator of the odds ratio and will cancel out. Likewise, switching to use failure as the outcome will flip the numerator and denominator of the ratio, resulting in the inverse of the odds ratio using success as outcome. Similarly, being a simple difference, the risk difference will change sign but retain its absolute magnitude when the outcome definition changes.
The risk ratio is asymmetric with respect to the outcome definition because its magnitude depends on the prevalence of the outcome. For a given (absolute) risk difference, rare outcomes will yield larger risk ratios. For example, if the probability of success is 0.3 and 0.1 for two respective groups, then the risk difference is 0.2 and the risk ratio 3. If the success probability instead was 0.5 and 0.3, the risk difference remains the same at 0.2 but the risk ratio is 1.7. Had the outcome been failure, the corresponding risk differences had been the same in absolute terms, but the corresponding inverse of the risk ratios would have been 1.3 and 1.4 (as a result of the prevalence being much higher, i.e., 1 minus the stated probabilities). We show that an important consideration in deciding between the risk ratio and measures of association is the prevalence of the outcome, which we call the base rate. The base rate is the pooled (overall) rate of “success” outcomes for the two groups that are contrasted by the risk ratio.
Two Empirical Examples
Comparing Levels of Discrimination across Domains
An essential technique in the measurement of discrimination is the use of field experiments. In field experiments of discrimination, investigators submit falsified applications in response to actual advertisements. For instance, investigators may submit applications for jobs or apartments or may seek to buy a product or service. Some applications give the perception they come from a member of the majority group and some from the minority group, often through a racially typed or ethnically typed name on the application. The other (nonracial) group characteristics presented are highly similar on average, making the perceived race or ethnicity of the applicant the only factor producing differential outcomes. Most studies of this sort rely on a dichotomous outcome, such as receiving a positive reply.
Discrimination is assessed by the relative advantage of the “white” applicant to the nonwhite applicant on the outcome. A measure that has been adopted in many studies is the ratio of “success” outcomes for the white group to the nonwhite group, or the relative risk of success of the application (RRY=1). A ratio of 1 indicates equal treatment and higher numbers indicate more discrimination. Quillian and Midtbøen (2021) referred to this as the “discrimination ratio.” An appealing quality of this measure is its interpretability. The measure can be interpreted as the proportion of additional applications that need to be made by a member of the minority group to expect an equal number of positive responses as an application from a majority group member.
Most studies use the ratio of successes to examine discrimination, but it could make sense to use the ratio of failures (lack of positive response) instead (RRY=0). To keep the ratio oriented the same in terms of directions (with higher denoting more discrimination against the minority group), we use the ratio of the percentage of applications by the minority group that fail to the percentage of applications by the majority group that fail, as shown in equation 2. For other outcomes, it is fairly common to use “failure” as an outcome, at least in some analyses. For instance, several studies examine “dropping out” or failure to continue in school, while others examine the inverse “success” outcome of school continuation (e.g., Hirschfield 2009).
To examine how the choice of “success” or “failure” in the ratio changes our impression of discrimination, we examine success and failure risk ratios across 25 field experiments of discrimination in hiring against black Americans. These experiments were conducted by submitting resumes with racially typed names, white and black, such as the well-known study of Bertrand and Mullainathan (2004). Others were conducted in person and used trained confederates to play job seekers, including the experiment by Pager (2003). The positive outcome in these studies is a “callback,” which indicates that the employer responds positively to submitted applications.
The impression we draw about the level of discrimination vary strongly if we use a “success” ratio rather than a “failure” ratio, even though these are two valid ways to represent the same data. Bertrand and Mullainathan (2004) found a discrimination ratio of callbacks of about 1.5, suggesting that black-named applicants need to submit 50 percent more resumes to expect the same number of callbacks as white applicants; Pager (2003) found a discrimination ratio of 2.68, indicating black applicants need to submit 168 percent more applications. These ratios suggest a large amount of discrimination in hiring against black Americans.
By contrast, the ratio of failure to receive a callback minority to majority are 1.04 for Bertrand and Mullainathan’s (2004) study and 1.23 for the Pager’s (2003) study: black applicants receive 4 percent more failures outcomes than job applicants in Bertrand and Mullainathan and 23 percent more in Pager. In this case, the risk ratio with “success” as the outcome gives the impression that discrimination is much higher than the risk ratio with “failure” as the outcome.
To broaden the comparison, we examine success and failure risk ratios across 25 field experiments of racial discrimination in hiring against black Americans from data in Quillian and Midtbøen (2021). Figure 2 graphs the ratio of failure proportions (minority/majority) to the ratio of successes proportions (majority/minority) for the 25 field experiments. Each discrimination estimate is a dot on the graph. A local regression smooth is a red dotted line. The association of the two measures is fairly linear, with a Pearson correlation of .797.

Hiring discrimination in 25 studies: failure ratios versus success ratios.
One notable difference when we switch the outcome category is that the discrimination ratios are higher for the ratio of successes (mean = 1.47) than the ratio of failures (mean = 1.1). The majority group has 47 percent more successes but only 10 percent more failures in job applications. A naive interpretation of this statistic would suggest much more discrimination using the success rate ratio than the failure rate ratio. However, the two statistics summarize the same results in different ways.
A second difference from switching the outcome category is that the ranking of discrimination levels across studies changes. The association of the two measures has a Spearman rank correlation of .609. For a few studies, switching the outcome category strongly changes the study’s relative position in rankings of discrimination. A study by Turner, Fix, and Struyk (1991) showed the largest relative change in ranking from success to failure rates, changing from a low discrimination study using success rates (only the 3rd highest discrimination ratio) to one of the highest discrimination studies on the basis of failure rates (the 18th highest failure rate discrimination ratio of 25).
An important factor contributing to differences between results using success and failure rates is the base rate of the success (Y = 1) outcome. Figure 3 plots the difference in the rankings of the level of discrimination across different studies. Studies with low base rates tend to have higher discrimination ranks using success than failure ratios; studies with high base rates tend to have higher discrimination ranks using failure than success ratios.

Difference in ranks, failure and success ratios in 25 field experiments versus base rate.
Figure 3 suggests that it can be misleading to use ratios to compare between studies, or among groups of studies, that have highly different base rates. For instance, some employment discrimination studies examine discrimination across multiple stages, beginning sometimes with a preapplication stage in which they have applicants call and inquire if the job is still available. Race or ethnicity is signaled by the applicant’s name (given over the phone) and perhaps an accent. Studies often find discrimination in this outcome: Schmaus and Kristen (2022), for instance, found that 80 percent of unaccented German speakers are told that the job they inquire about is still available compared with 72 percent of German speakers with a Turkish accent. Studies in other contexts often report somewhat similar results (see Quillian, Lee, and Oliver 2020).
From risk ratios of success, we might be tempted to conclude that there is little discrimination in the initial inquiry stage compared with the callback stage. In the initial inquiry stage, the white majority has an advantage of about 10 percent (RRY=1 = 1.1), while the callback risk ratios suggest a 45 percent white advantage (RRY=1 = 1.45). But in significant part this reflects the high base rate of the inquiry stage, limiting the magnitude of the risk ratio that can be observed. When an outcome becomes close to universal (base rates are near one), risk ratios run into a ceiling since neither group can be over 100 percent. By contrast, in the studies using callback as the outcome, base rates tend to be close to 20 percent, and so ratios are less subject to ceiling effects. Concluding there is little discrimination in employment inquiries compared with callbacks from a comparison of risk ratios is not a safe conclusion, because the base rate of the events that are the outcomes (being told that a job is available and receiving a callback) are too different. Differences in base rates confound discrimination comparisons. In this case, we must always “bring the base rate back in” to interpret the ratio correctly.
As we discuss further below, risk ratios tend to be a good choice when we have low base rates, and for this reason we think the ratio of callbacks (the “discrimination ratio”) is an appropriate measure for this literature. When base rates are high, or to compare over a range of base rates, we should consider other measures, such as the odds ratio.
Comparing Intergenerational Educational Mobility across Countries
Stratification scholars routinely compare levels of intergenerational social mobility among countries (Breen 2004; Breen et al. 2009). One widely used measure is mobility in education, in which children’s educational attainment is compared with that of their parents (Pfeffer 2008). Although odds ratios proliferate in this strand of literature, risk ratios present themselves as an intuitive measure of relative mobility that are sometimes used (e.g., Betthäuser et al. 2021). For example, the ratio of the conditional probabilities of a child attaining a college degree between parents with and without a college degree could usefully summarize the extent of intergenerational mobility in college education (we could call this the “college degree ratio”). An alternative measure would be to take the inverse ratio of the probabilities of a child not receiving a college degree (we could call this the college failure ratio). Although these ratios represent the same set of count data, they can produce very different conclusions about the extent of intergenerational mobility and how it varies across countries.
To illustrate how dependent substantive conclusions can be on outcome definition when using risk ratios for measuring education mobility, we compare intergenerational college mobility among 19 countries. For this purpose, we re-analyze education mobility table data reported by Pfeffer (2007). Pfeffer used a five-level International Standard Classification of Education (ISCED) classification of parental and offspring education data from the International Adult Literacy Survey. For parents and children, we recode this into a binary measure indicating college completion (ISCED 6 and 7, i.e., at least the equivalent of a four-year college degree) or not (ISCED 0–5, i.e., primary, lower secondary, upper secondary, or associate degree or some college).
Figure 4 plots risk ratios by country and college outcome definition (the college degree ratio and the college failure ratio). It clearly shows that the two risk ratios are close to being completely unrelated with a rank-order correlation close to zero. Moreover, the figure shows significant rerankings of countries depending on college outcome definition. Most prominently, the Netherlands swap ranking from being the fourth-most mobile country in the comparison to the least mobile when moving from a positive to a negative college definition. In contrast, Germany is among the least mobile countries irrespective of outcome definition (ranks 15 and 16).
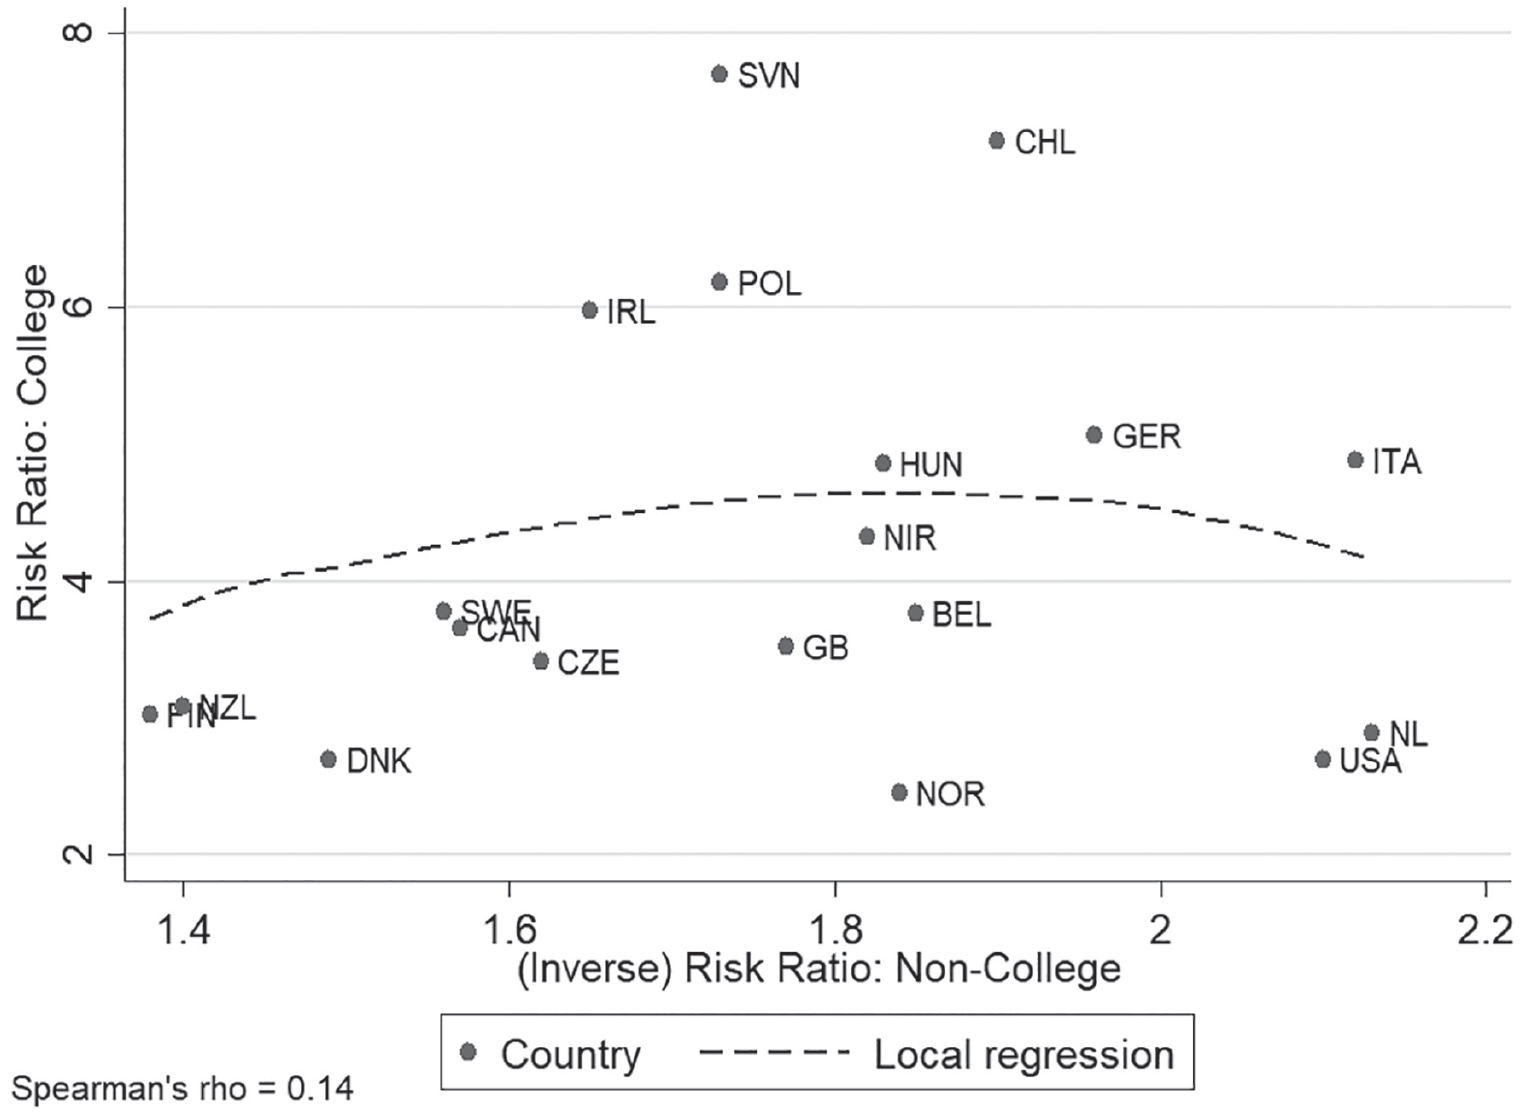
Risk ratios by country and college outcome definition.
To further examine the country reranking across college outcome definitions, we plot in Figure 5 the difference in country rankings on the basis of the risk ratios for the two college outcome definitions (college minus noncollege) by the overall fraction of offspring completing a college degree in the country. It shows a very strong negative relationship (a rank-order correlation of −.84), with “positive” reranking (moving from being a low-mobile to a high-mobile when moving from a college to a noncollege outcome definition) being more prevalent in countries with overall low fractions completing college, and with “negative” reranking being more prevalent in countries with a large fraction completing college. Thus the discrepancy by outcome definition appears to depend heavily on overall base rates, in this case the rate at which college is completed.
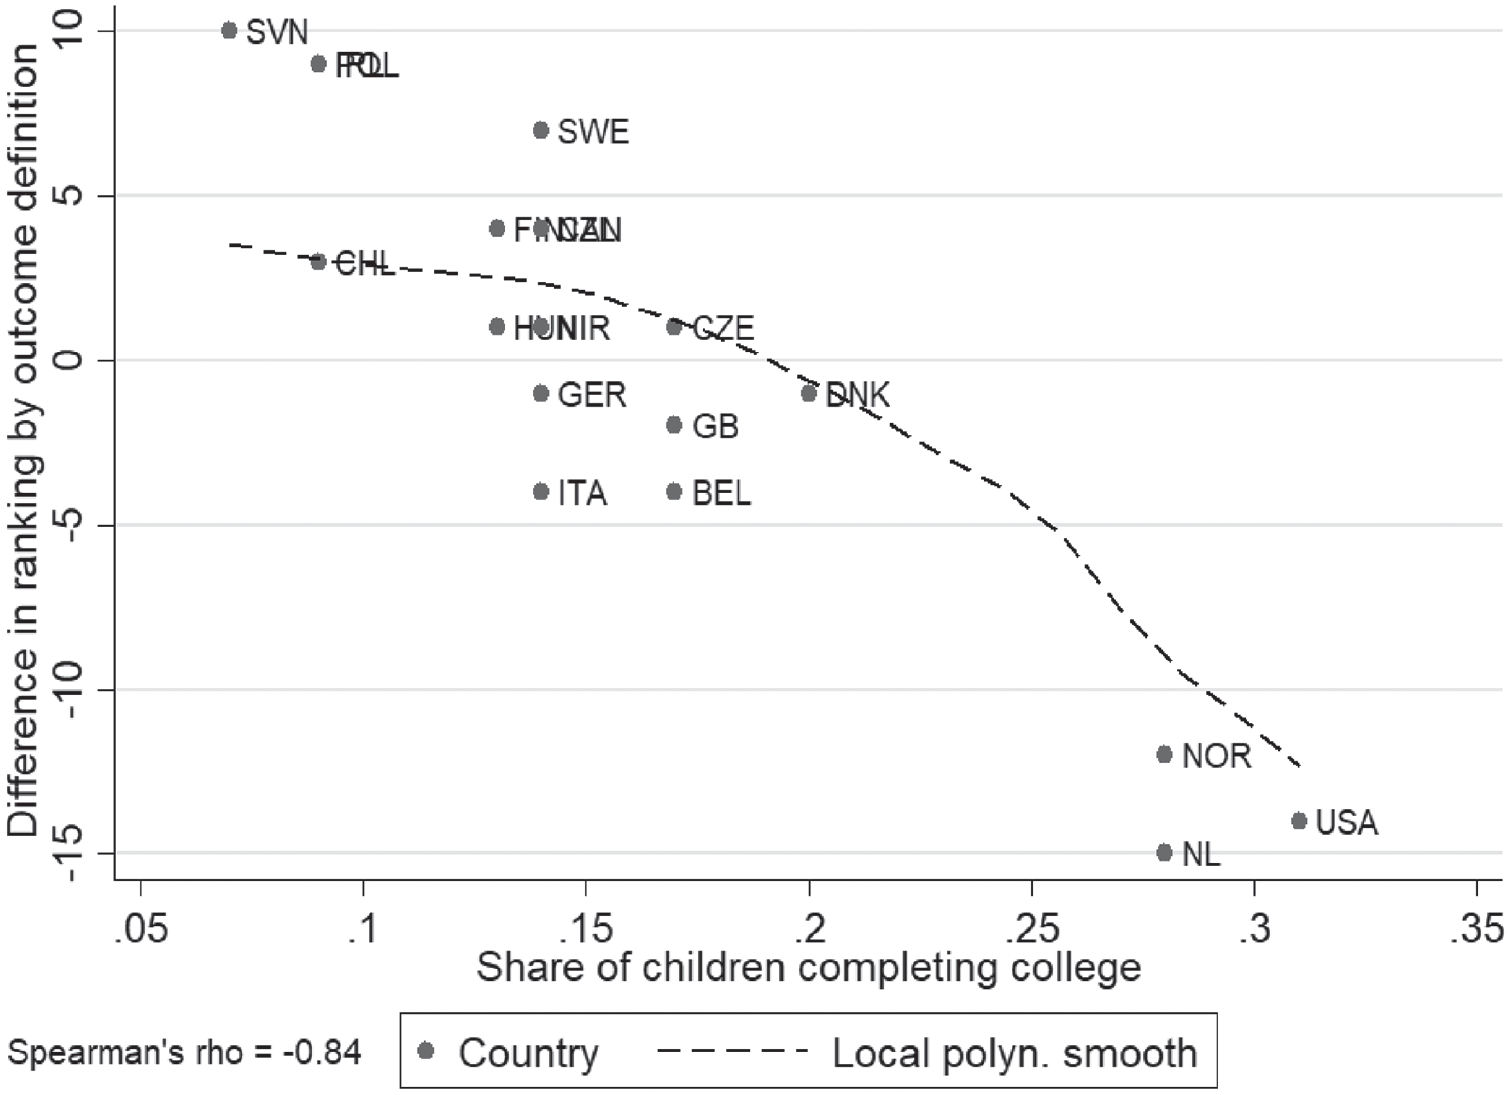
Degree of country reranking by share of children completing college.
Because odds ratios are widely used for measuring inequality of opportunity, we investigate how country rankings based on the odds ratio covary with rankings based on the two risk ratios. In our example, we find that rankings correlate at .92 with the college outcome definition and by .49 with the noncollege outcome definition. Thus, if we were only interested in ranking countries according to their overall level of education mobility, the risk ratio using the (positive) college outcome definition would largely agree with the odds ratio. However, this result is specific to the empirical example. The stronger association of the odds ratio with the risk ratio with the college outcome definition reflects the low odds of the odds ratio, as we discuss at more length later.
Suggestions for How to Use Risk Ratios in Applied Research
Decisions about the measure to use and the way to define the outcome can matter greatly for empirical results in research, even when the measures are direct mathematical functions of each other. Researchers should approach the method about which measure to use to indicate strength of associations with some care. Risk ratios can be a good choice in some situations. The greater interpretability of risk ratios than odds ratios and collapsibility are important advantages. But risk ratios are not the right tool for every situation and researchers need to approach their use with some caution.
Here, we outline some rules of thumb for choosing measures of association with a dichotomous outcome:
Risk ratios are often useful measures when base rates are low: When the average base rate is low (below about .3) and the rate of event occurrence is below 50 percent in almost all covariate groups or strata in an analysis, risk ratios can be a good choice to represent the association. In this case, risk ratios will tend to produce results that correlate well with odds ratios but are more interpretable because ratios of probabilities are easier to understand than ratios of odds.
One way to think of the problems in using risk ratios is that when base rates of event occurrence are high (e.g., >50 percent), risk ratios may often approach ceiling values limited by the rate of success of the group in the denominator. For instance, if the denominator has a 50 percent rate of event occurrence, the maximum ratio is 100/50 = 2; if the denominator has an 80 percent rate of event occurrence, the maximum ratio is 100/80 = 1.25. Odds ratios, on the other hand, are unbounded both close to the floor and the ceiling. Risk ratios and odds ratios will tend to produce similar results when base rates are low. When base rates are high, risk ratios and odds ratios will often give quite different results.
If the base rate is high, consider switching the outcome category to use a risk ratio: When the base rate of event occurrence is 50% or more in almost all ratios in the data, we suggest redefining the “event” to be the less common outcome and then considering the use of risk ratios. For example, we might redefine the outcome event as stopping schooling (“dropping out”) rather than continuing schooling. In the United States, completing high school would usually be a high base rate outcome less well suited to analysis with risk ratios, but the rate of dropping out (failing to complete high school) would be a low base rate outcome well suited to risk ratios. Redefining the event allows the outcome to be covered by rule 1.
Odds ratios are useful when base rates vary across strata or groups: When the base rate of event occurrence covers a wide range of values in the data, including values close to 0 percent and 100 percent, we suggest using the odds ratio. Comparison of risk ratios will be influenced by base rate differences in ratios in addition to the pattern of association. In this case, odds ratios are usually a better choice because they are less sensitive to base rate differences over the entire range of zero to one.
Risk differences are useful when base rates are in a middle range: Finally, when the base rate of event occurrence for the majority of cases tends to be close to 50 percent and rarely or never close to 0 percent and 100 percent, then risk differences between groups will often be a good choice. Ceiling and floor effects near 0 percent and 100 percent are then not a problem, and if the base rates cover a narrow range the difference percentages are relatively comparable.
Why not always use the risk difference? One reason is the risk difference has problems of comparability when base rates include both high and low values. A 5 percent difference in an outcome is a much bigger effect if the base rate is 20 percent than if it is 80 percent. Correspondingly, in the meta-analysis literature, discussions of potential outcome measures note that difference measures result in greater variability in estimates of effect sizes compared with risk ratios or odds ratios because of differences in base rates across studies. For this reason, relative risk or odds ratios are often recommended (see Fleiss and Berlin 2009, section 13.2.1).
Sensitivity analysis comparing measures is recommended, especially for outcomes that do not fit well into the preceding rules: Examining results with both a risk ratio and an odds ratio can be a highly useful way to assess if conclusions change depending on the measure. This is especially true in making comparisons across risk ratios calculated over data with highly different base rates. If results with odds ratios or risk differences are much different than with risk ratios, the analyst should reexamine conclusions to ensure that the underlying concept they are hoping to capture is appropriately measured.
These rules of thumb should not be followed too mechanistically; concerns in particular contexts could result in choosing measures that do not follow these guidelines. The goal is to receive a fuller picture of the associations in the data and to understand the potential fragility of results to the measure chosen. We believe that following these guidelines can help reduce errors in interpretation and analysis.
Conclusion
Risk ratios present an appealing alternative to odds ratio analyses because they are much easier to interpret than odds ratios and because of the property of collapsibility. However, analysts using risk ratios have often failed to appreciate the critical point that asymmetry of the risk ratio means that the category of the outcome that is used can, under some circumstances, change our understanding of the outcome and how it differs over subgroups. To avoid problems that arbitrary changes in the category can change the results substantially, we recommend the use of risk ratios when the base rate of the event is low and a comparison of results with other effect measures such as odds ratios or risk differences.
Footnotes
Funding
The author(s) disclosed receipt of the following financial support for the research, authorship, and/or publication of this article: For Kristian Bernt Karlson, the research leading to the results presented in this article has received funding from the European Research Council under the European Union’s Horizon 2020 research and innovation program (grant agreement 851293).