
Abstract
The authors examine students’ linear progression histories in mathematics throughout high school years, using the High School Longitudinal Study of 2009. Although scholars have attended to this before, the authors provide a new organizing framework for thousands of heterogenous mathematics course-taking sequences. Using cluster analysis, the authors identify eight distinctive course-taking sequence typologies. Approximately 45 percent of students take a linear sequence of mathematics, whereas others stop taking mathematics altogether, repeat coursework, or regress to lower level courses. Only about 14 percent of students take the expected four-year linear sequence of Algebra 1–Geometry–Algebra II–Advanced Mathematics. Membership into different typologies is related to student characteristics and school settings (e.g., race, socioeconomic status, and high school graduation requirements). The results provide a tool for schools’ self-assessment of mathematics course-taking histories among students, creating intervention opportunities and a foundation for future research on advancing our understanding of stratification in math course-taking patterns, postsecondary access, and science, technology, engineering, and mathematics majors.
Mathematics in high school is organized into a hierarchal sequence, with requisite knowledge that enables students to move to an increasingly higher math level. Under such understanding, we can anticipate that students evidence linear progression in mathematics throughout four years of high school: for example, we might expect the sequence Algebra I‒Geometry‒Algebra II‒higher level courses (e.g., Trigonometry, Precalculus, Calculus). Recently, reports drawing upon nationally or state representative transcript data show that the expected linear progression embedded within mathematics course-taking patterns may not apply to all students (e.g., Brown et al. 2018; Finkelstein et al. 2012; Irizarry 2021). A recent report drawing upon California students’ transcript data from 7th grade to 12th grade, for example, shows that the most common pattern is Basic Math‒Algebra I‒Geometry‒Algebra II‒Precalculus‒Calculus (Finkelstein et al. 2012). Yet, this pattern represents only about 3 percent of the analytic sample, and this study identified approximately 2,000 different math course-taking patterns for students in the California sample. Underrepresented minoritized and low-income students, particularly in urban underresourced schools, were likely to experience nonlinear progression in transition to high school and across high school years (Eisenhart and Weis 2022; Brown et al. 2018; Fong, Jaquet, and Finkelstein 2014; Irizarry 2021). Moreover, many students who had evidenced histories of being off track from linear progression in high school also experienced math repetition in college (Ngo and Velasquez 2020).
When students are off track from linear progression, relatively little is known about specific course-taking sequences they experienced. Some students can experience only one misstep from upward linear progression, whereas others can experience consecutive missteps throughout high school years. Even if students experience only one misstep in math course-taking flows, for example, by taking an easy non-college-preparatory course in grade 12, this can lead to insurmountable disadvantages over time after years of cumulative disadvantages (Eisenhart and Weis 2022; DiPrete and Eirich 2006). Moreover, when being off track from linear sequence varies by racial/ethnic and family socioeconomic status (SES) (Fong et al. 2014; Irizarry 2021), such sequence might have long-term effects on race- and social class–based stratification in higher education and social mobility patterns more generally.
Although students experience a very diverse set of nonlinear math course-taking sequences, to date, no study has attempted to develop a new way of classifying and recording the micro moves of varying groups of students who are differentially positioned in the opportunity structures at varying school settings. In this study, the main objectives were to investigate nationally representative descriptive pictures of math course-taking sequences by mapping an individual student’s grade-to-grade math course progression and then identifying math course-taking typologies. This study both takes account of and extends the literature (e.g., Brown et al. 2018; Finkelstein et al. 2012) by focusing on typology development, an important analytic tool that can categorize thousands of diverse course-taking sequences into a discrete number of math course flow types, thereby demonstrating the importance of math course flow typologies in advancing our understanding of educational inequality in student trajectories from high school to postsecondary education (PSE). In constructing a typology, a cluster analysis—an exploratory statistical technique to classify similar observations into a discrete number of groups on the basis of observed characteristics of several variables for each individual—is widely adopted in education (e.g., Perna and Leigh 2018; Wang, Lee, and Wickersham 2019). 1
After identifying varying typologies of math course flows through the use of cluster analyses, we investigate the association between individual and school-level characteristics and subgroup membership in each discrete typology. Next, we examine associations between varying typologies of math course flows and students’ future educational outcomes to demonstrate how math course typologies can potentially contribute to advancing our understanding of stratification in math course-taking patterns, PSE entrance patterns, and declaration of science, technology, engineering, and mathematics (STEM) major. We use a nationally representative educational data set, the High School Longitudinal Study of 2009 (HSLS:09), collecting high school transcripts.
In this study, we take the math course-taking sequence as it is predominantly produced in a given school context and ask about the extent to which students empirically follow it and who follows it. We do not aim to weigh in on which course should come first in the sequence. It should be also noted that we do not take into account course level as linked to the same course (e.g., honors vs. regular Algebra I) or performance level (e.g., the grades earned), although both can affect students’ math course-taking flows (Fong et al. 2014; Irizarry 2021) and enable us to capture far more complex lived histories of course-taking. Rather, this study focuses on demonstrating the need for an organizing framework that helps researchers and practitioners understand thousands of different math course-taking sequences experienced by students.
Our contribution is twofold. First, identifying the types and effects of math course flows potentially offers a mathematics attainment intervention opportunity before students complete high school. Although the highest level of mathematics completed, a snapshot approach traditionally used by social scientists in such analyses, can tell us where students land at the end of high school, for example, this indicator does not offer an opportunity to examine the course-taking flow itself with an eye toward improving students’ overall mathematics attainment. A new organizing framework of math course typologies can provide a tool for assessing the precise micro moves engaged by students as they traverse a set of critically important high school courses. In so doing, this study offers a new way of self-assessing and remediating students’ off track math course-taking experiences in high school, which can be easily overlooked by policy makers and practitioners when they focus only on highest level math completion. In addition, our study can offer a basis for examining the associations between school characteristics and discrete types of flows, potentially revealing school-level practices (e.g., advanced course offerings on site, institutional support by teachers and counselors, high school graduation requirements) that can be used to intervene and subsequently alter postsecondary entrance and graduation patterns (Irizarry 2021; Rodriguez and McGuire 2019).
Second, by identifying a number of distinct types of math course flows in high school (e.g., taking math along a hierarchical linear trajectory, stopping math, or repeating the same course), policy makers, practitioners, and researchers may gain greater insight into inequality in educational attainments. For example, varying types of math course flows can offer new explanations as to why socioeconomically disadvantaged and minoritized students may remain behind their counterparts in levels of math reached by the end of high school, even with the same start in grade 9 and the same prior math achievement scores. By linking high school course-taking typologies with educational experiences in college (e.g., course-taking patterns in college, degree completion, STEM major choices), our study can also contribute to understanding how a slight difference at a point in time in mathematics course-taking trajectories in high school can make it difficult for students to maximize their college readiness and limit their STEM potentials, leading to a cumulative disadvantage for educational and occupational attainments.
Literature Review
High School Math Course-Taking Trajectories
A substantial body of important research has examined trajectories in high school mathematics course-taking. Some studies adopt a snapshot approach, focusing on the completion of gatekeeping mathematics courses (e.g., Crosnoe and Schneider 2010; Riegle-Crumb 2006; Shifrer, Callahan, and Muller 2013), whereas others focus on year-to-year changes in the level of math, such as up, repeat, and drop/stop in math course-taking sequences (e.g., Fong et al. 2014; Frank et al. 2008; Irizarry 2021; Kelly 2009; McFarland 2006; Schiller and Hunt 2011). Prior studies showed that students must progress through hierarchical math sequences to reach a high level of math at the end of high school (Kelly 2009; Riegle-Crumb 2006; Stevenson, Schiller, and Schneider 1994). We limit our literature review to studies that focused mainly on moves (e.g., yearly progression) in the level of math in high school.
Prior research on math course flow focused on changes in the level of mathematics courses from middle to high school transition (Finkelstein et al. 2012; Irizarry 2021) and across academic years in high school (Fong et al. 2014; Frank et al. 2008; Kelly 2009). These studies identified a hierarchical level of mathematics courses and assessed if a student’s math level increased compared with the previous grade.
Despite the importance of math course-taking in middle school on achievement and high school math course-taking (Champion and Mesa 2016; Domina 2014), only a small number of studies examined the transition from middle to high school in math course-taking sequence hierarchy (Irizarry 2021). Using data from HSLS:09, Irizarry (2021) found diverse progression patterns in math course-taking at the point of transition to high school. A majority of students were on track (either advanced or standard); students who took advanced math (i.e., Algebra I or above) in grade 8 were more likely to take Geometry or above in grade 9 and those who were in standard math (i.e., below Algebra I, such as Advanced or Honors Math 8, Prealgebra, and Integrated Math) in middle school were more likely to take Algebra I or below in grade 9. Some students experienced the accelerated progression; they took advanced math (i.e., Geometry or above) in grade 9, although they took standard math in middle school. More important, a substantial number of students who were in advanced math in middle school took Algebra I or below in grade 9, suggesting that these students experienced nonlinear progression in transition to high school (e.g., repeating Algebra I in grade 9). There were sizable racial gaps in the progression of math course-taking from middle school to high school transition, even after taking into account prior academic factors (e.g., prior course level and performance).
Prior studies also examined progression in math course-taking in high school (Frank et al. 2008; McFarland 2006). Frank et al. (2008) determined whether a student advanced in math from 9th grade through 11th grade, using a hierarchical math level classification with nine categories from No Math to Calculus. Then they categorized students’ math advancement into up (coded 1) and others (coded 0) across academic years. These studies have addressed the probabilities of advancing into a high level of math, such as higher than Algebra II in the sequence. They have investigated the degree to which individual, peer, and school characteristics are associated with such probabilities of advancement in the sequence. In particular, these studies offer evidence that underrepresented minoritized students are less likely to advance in a math course sequence, even after considering the academic and family background and school characteristics. Although these studies have addressed the extent to which students move up in a hierarchical sequence of mathematics courses, they did not address other dynamics in moves across mathematics courses, such as staying in the same math course or moving down in the sequence.
McFarland (2006) examined the dynamic mobility of math course-taking sequences in two high schools, using transcripts of each semester for two years. McFarland mapped all math course-taking trajectories and identified the overall pattern of students’ flow across mathematics courses. McFarland identified mutually exclusive curricular moves, such as stopping math, repeating a course, same-stream moves, downward moves, and upward moves. This study found that student curricular moves are created in part by organizational rules and structural opportunities, such as grade level and ability level, what courses are offered, how students are assigned to particular courses (tracking), and graduation requirements. For example, students in lower grade levels, in lower ability levels, and with high grades are most likely to move upstream. McFarland depicted a more comprehensive array of moves in mathematics course-taking sequences than previous studies that assume linear progression of mathematics course-taking patterns. Indeed, a recent study, drawing on California students` transcript data from 7th grade to 12th grade, found more than 2,000 math course-taking patterns (Finkelstein et al. 2012).
Policy makers and practitioners who are interested in improving students’ mathematics preparation need further investigation as to (1) whether these diverse math course-taking sequences constitute one of the mechanisms influencing students’ academic preparation in mathematics and, ultimately, stratification in higher education and social stratification and (2) whether diverse math course-taking sequences are associated with school-level practices. To address this need, a first step is to classify thousands of different mathematics course-taking sequences throughout four years of high school into subsets that share similar characteristics and differ in meaningful ways from other subsets.
To date, unlike the study presented here, no study has focused on characterizing and classifying thousands of different patterns of mathematics course-taking sequences throughout the four years of high school. More important, there is consistent evidence on disparities in mathematics course-taking patterns across racial, ethnic, and SES backgrounds (Frank et al. 2008; Irizarry 2021; Kelly 2009; Riegle-Crumb 2006), learning disability status (Shifrer et al. 2013), and English language learner status (e.g., Kanno and Kangas 2014; Thompson 2017). Prior studies suggest that underrepresented minoritized students are at higher risk for losing or “falling out” of (not sustaining) their initial course advantage in transition to high school (Irizarry 2021) and in the first year of high school than their White peers (Riegle-Crumb 2006). The implication, then, is that underrepresented minoritized students are more likely to slip into the off track category with respect to the linear progression of math course-taking sequences compared with their White counterparts, leading to lower chances of reaching higher levels of math, even when they start at the same place.
Moreover, prior studies documented that students may experience diverse off track math sequences (Finkelstein et al. 2012; Irizarry 2021; Ngo and Velasquez 2020). Diverse nonlinear course-taking sequences may have differential effects for future educational attainments (Newton 2010). For example, stopping taking a course and repeating the same level of math for a complete mastery may exert differential effects on future educational attainments. Thus, it is important to identify students’ lived history at the granular level with regard to the actual nature of nonlinear course-taking dynamics in mathematics and associated lived out effects of these dynamics. Here we use a nationally representative sample of high school students and examine the extent to which differentially located students in the population, including varying SES and race/ethnicity, follow similar moves within the sequence itself.
School-Level Factors Explaining SES and Racial/Ethnic Inequality in Math Course-Taking
Some researchers focus on the degree to which students’ characteristics, such as sociodemographic characteristics, prior learning experiences and performance, special education status, and English language learner status, are associated with their math course-taking patterns (e.g., Fong et al. 2014; Irizarry 2021; Riegle-Crumb 2006; Thompson 2017; Tyson and Roksa 2017). For example, prior academic factors are significantly related to nonlinear mathematics progression, but they did not fully explain different math course-taking pathways. Fong et al. (2014) found that low-performing students were more likely to repeat Algebra I, but even students with initial grades that averaged between a B and an A and those with high standardized test scores repeated the course in California.
Others have been more concerned with school-level factors that contribute to stratification in students’ math course-taking patterns (e.g., Irizarry 2021; Kelly 2009; Muller et al. 2010; Riegle-Crumb and Grodsky 2010). These school-level characteristics include student composition of the school in terms of family SES and race/ethnicity, and school sector (public, Catholic, and nonreligious private). Others also focus primarily on the policy-amenable organizational structure of schools, which influences progression in hierarchical mathematics course-taking, such as school-level math course requirements, advanced math course offerings on site, encouragement by teachers (and parents), and influence of counselors on course selection (Crosnoe and Schneider 2010; Irizarry 2021; Teitelbaum 2003; Weis et al. 2015).
Research shows that the number of years of mathematics required to meet high school graduation influences students’ math outcomes (Teitelbaum 2003). To push students to take more advanced math coursework, the vast majority of states currently require students to complete three or four credits in math (Snyder and Dillow 2013). In general, states set these minimum requirements, and schools can exceed them (Carlson and Planty 2012; Teitelbaum 2003). Using a nationally representative sample of 1992 public high school graduates from the National Educational Longitudinal Study of 1988, Teitelbaum (2003) found that students at schools with higher graduation requirements were more likely to complete advanced math courses than their peers at schools with lower graduation requirements. Similarly, in recent work by Kim et al. (2019), the authors, using a single-state data set, showed that students are more likely to earn more credits and complete advanced math courses when students are required to take a full load of college preparatory courses, including four credits of mathematics that cover the content traditionally taught in Algebra I, Geometry, and Algebra II.
Studies show that course offerings on site are associated with students’ course-taking patterns (Crosnoe and Schneider 2010). The likelihood that a school offers advanced math courses varies across schools, depending on incoming students’ achievement levels and family SES (Iatarola, Conger, and Long 2011; Klugman 2013). The higher the number of advanced math classes offered by the school, the greater students’ chance to take advanced math courses (Crosnoe and Schneider 2010). Rodriguez and McGuire (2019), however, found that the lack of Black student participation in Advanced Placement (AP) courses was not driven by a lack of availability of AP courses in high school.
Research also finds that instrumental social supports (e.g., teachers and counselors) play a critical role in access to high-level math coursework (Crosnoe and Schneider 2010; Irizarry 2021). These institutional social supports are also important for reducing racial gaps in advanced math course-taking (Irizarry 2021). Using nationally representative data from the National Educational Longitudinal Study of 1988, Crosnoe and Schneider (2010) found that students earned more math credits when counselors influence course placements, while teacher encouragement was not associated with the final number of math credits accumulated, after taking into account students’ sociodemographic and academic background characteristics, high school types, and locations. Moreover, they found that among students with low middle school math performance, those from socioeconomically disadvantaged families benefit from having consultants for course work decisions. Counselors in socioeconomically disadvantaged schools must deal with larger caseloads than their counterparts in schools that serve privileged student populations (Bridgeland and Bruce 2011). Students in schools with smaller counselor caseloads enjoy remarkable success at navigating the high school-to-college pipeline (Woods and Domina 2014). Research also finds that underrepresented minoritized students are more likely to attend schools that have sworn law enforcement officers but not school counselors (Nikischer 2013; Nikischer, Weis, and Dominguez 2016). Latino/a students are 1.4 times as likely to attend a school with a sworn law enforcement officer but not a school counselor as White students, and Black students are 1.2 times as likely (U.S. Department of Education, Office for Civil Rights 2016).
Building on math course-taking trajectories, math course-taking sequence in our study refers to the configurations of specific mathematics courses that students experienced from ninth grade through 12th grade. Recent studies show that not many students took mathematics with consistent upward moves—in other words, remaining on track. Most students, in fact, did not take mathematics with such upward movements—thereby careening off track (Finkelstein et al. 2012; Ngo and Velasquez 2020). In addition, there are thousands of different math course-taking sequences (Finkelstein et al. 2012). However, descriptive investigations of course-taking sequences lack a theoretically informed typology that captures the differences. To address this void in the literature, we make the following concrete moves. First, using the HSLS:09 transcript data set, we investigate nationally representative descriptive pictures of math course-taking sequences by mapping individual students’ math course flows throughout their high school years (9th to 12th grade) and then identify distinct typologies of course-taking sequences. Second, we examine the degree to which student racial, ethnic, and social class background and school settings are associated with different typologies of math course-taking sequences. Third, we investigate associations between varying typologies of math course flows and students’ future educational outcomes.
Methodology
Data Source and Sample
This study uses data from HSLS:09, a nationally representative sample of ninth graders, first surveyed by the National Center for Education Statistics (NCES) in 2009, with follow-ups in 2012 and 2014. Although longitudinal state data sets can provide information on more recent patterns in mathematics sequences, the HSLS:09 surveys can provide generalizable evidence on math course-taking sequences for a nationally representative sample of students. Our analytic sample includes students with complete transcript information from 9th through 12th grade and high school dropouts. 2 The sample size is 19,897 students. The NCES provides weighting variables that account for the probabilities of participation in the base-year and follow-up surveys and school administrator and student survey nonresponse rates. This study’s estimates were generated using the transcript weight included in the HSLS:09 transcript data set, W3W1W2STUTR (Dalton et al. 2015).
A Typology of Math Course-Taking Sequences: Cluster Analysis
Math course-taking sequence typology is a key variable in our study. To create this course-taking sequence, we followed several steps. First, we set up a hierarchical sequence of math courses. In the HSLS:09 data set, the math is coded based on the School Codes for the Exchange of Data, the Secondary School Course Classification System of the NCES. The NCES coded the difficulty of the subject on the basis of educational content and subject title (provided by schools). The coded math courses are ordered into 13 categories according to difficulty level: basic math, other math, Prealgebra, Algebra I, Geometry, Algebra II, Trigonometry, other advanced math, Probability and Statistics, other AP/International Baccalaureate (IB) math, Precalculus, Calculus, and AP or IB Calculus (National Forum on Education Statistics 2014). Following prior research on math course-taking in high school (e.g., Brown et al. 2018; Burkam and Lee 2003; Domina and Saldana 2012), the number of categories was reduced from 13 to 7; Prealgebra, Algebra I, Geometry, Algebra II, Trigonometry, Precalculus, and Calculus. We used the same number of categories established in the literature on students’ highest mathematics level in high school. This approach allows us to examine what course sequence flows students in fact experienced when they reached the highest mathematics course-taking patterns benchmark.
Using this hierarchical sequence of math courses, we collected the highest level of math coursework per year, from 9th grade fall to 12th grade spring, in the HSLS:09 transcript data. 3 We mapped individual students’ curricular flows using the four time points (t) of students’ math coursework. Through this process, we mapped 1,174 combinations of math course-taking sequences. As an example, Appendix A presents the 20 most common math course-taking sequences. The most frequent sequence was Algebra I–Geometry–Algebra II–Trigonometry or Precalculus. This pathway characterizes only 13.5 percent of students in our analytic sample. The following most common sequence was Geometry–Algebra II–Precalculus–Calculus (5.4 percent). The next most common sequence is Algebra I–Geometry–Algebra II–No Math (4.9 percent). The top 20 most common sequences represent only about 50 percent of the students in the sample. The remaining 50 percent of students have 1,154 different sequences.
Finally, to classify all identified 1,174 course-taking sequences from full sample into distinctive groups, we used cluster analysis. Cluster analysis involves a range of data sorting approaches intended to classify clusters of like observations in otherwise indistinguishable data. Although various clustering algorithms such as hierarchical and nonhierarchical algorithms exist, we used cluster analysis with k-means solution, a nonhierarchical method. For large numbers of observations, k-means clustering is a popular choice because hierarchical cluster algorithms are computationally expensive (Hand, Mannila, and Smyth 2001). The k-means procedure has been found to recover true cluster structure well (Steinley 2004).
To classify math course-taking sequences into similar groups, we developed several indicators of absolute and relative curricular moves. For absolute curricular moves, we included two indicators: first math course and highest math course. The first math course was coded from 1 through 4, indicating Prealgebra, Algebra I, Geometry, and Algebra II or above, respectively. The highest math course was coded from 1 through 4, indicating Algebra II or below, Trigonometry, Precalculus, and Calculus. For relative curricular moves, we drew upon prior studies of high school track placement, which categorized mobility of track placement into three categories: up, down, and stable (e.g., Hallinan 1996; Lucas 1999; Rosenbaum 1976). Studies of math course-taking patterns also categorized curricular moves, such as up, repeat, and drop/stop in math course-taking sequences (e.g., Frank et al. 2008; Kelly 2009; McFarland 2006; Schiller and Hunt 2011). Drawing on these prior studies, we developed four mutually exclusive curricular move indicators: up, down, repeat, and no math. From 9th grade to 12th grade, we identified the differences in math coursework difficulty levels between years. Using the three-time point transitions, we counted the numbers of up, down, repeat, and no math per student over four years of high school. For example, when a student took Algebra I–no math–Algebra II–Algebra II throughout high school, the number of up, down, repeat, and no math are coded as 1, 0, 1, and 1, respectively. 4 To obtain common scale units across indicators used for cluster analysis with k-means, we standardized six indicators by subtracting the variable mean and dividing by the standard deviation (Steinley 2006). To identify the ideal number of clusters, k, we checked several k-means solutions with different numbers of groups k, from 1 to 20, using three criteria: the logarithm of within sum of squares for all cluster solutions, the η2 coefficient, which is quite similar to the R2 coefficient, and the proportional reduction of error coefficient (Makles 2012). After checking the different k-means solutions, we found that eight is the optimal solution for cluster classification (Makles 2012; Steinley and Brusco 2007). All details are available in Appendix B.
Student, School Characteristics, and Academic Outcomes
We conducted descriptive statistical analyses to examine the extent to which individual and school-level characteristics are associated with subgroup typology membership. Individual-level characteristics included gender, the composite score of SES, and race. Because mathematics course-taking patterns are related to four-year college entry and postsecondary degree completion as well as STEM degree completion (e.g., Rodriguez 2018; Tyson et al. 2007), as relevant, we included educational aspiration for four-year college graduation as well as a STEM career aspiration. In addition, individual characteristics had standardized ninth grade math achievement scores, the math course a student took in the first year of high school, dropout status in the spring semester of 12th grade, learning disability status in grade 9, and English language learner status. In addition to the average SES and math standardized scores, we included the quartile cutoff within each cluster to assess the ranges of SES and math standardized scores.
We also included several school-level characteristics in descriptive analyses. We included high school urbanicity, type (public, Catholic, and other private), and student composition of the school in terms of family SES and race/ethnicity because prior research has shown that these school characteristics are associated with student mathematics course-taking (e.g., Kelly 2009; Muller et al. 2010; Riegle-Crumb and Grodsky 2010). We also included several indicators of organizational structure that influence progression in hierarchical math course-taking sequences. Because mathematics high school graduation requirements influence students’ math course-taking patterns (Kim et al. 2019; Teitelbaum 2003), we included years of mathematics required for high school graduation. As schools may require students to exceed state requirements, we included a school-level mathematics graduation requirement. 5 Next, we included indicators of advanced course offerings on site. Given the empirically demonstrated importance of counselor caseload, we included school counselors’ caseloads as a proxy for access to individualized relevant information on course selection (Woods and Domina 2014).
Finally, we investigated the potential outcomes of having different math course-taking typologies. We selected outcomes for our analyses on the basis of academic milestones students typically reach en route to success in PSE, particularly in STEM fields. We created two potential outcomes at the high school level: completion of (a) Precalculus and (2) Calculus. Students who took Precalculus in high school are more likely to attain bachelor’s degrees in STEM fields (Adelman 1998). Completion of Calculus in high school is also foundational to entrance to more selective postsecondary institutions and to postsecondary attainment more broadly (Rodriguez 2018). We also created two potential outcomes at the PSE level: PSE destination (i.e., no PSE, two years, and four years) and STEM major choice in PSE. We reported the proportion of each PSE outcome in each math course-taking typology. Following prior research (Riegle-Crumb and King 2010), STEM majors are defined as Mathematics, Computer Science, Physical and Life Sciences, Engineering, and Technology (Riegle-Crumb and King 2010; Riegle-Crumb et al. 2012).
Limitations of the Analysis
The analysis used in this study had limitations. First, we did not take into account course levels and performance, although prior studies found prior academic factors influence students’ course-taking flows (Fong et al. 2014; Irizarry 2021; McFarland 2006). For example, grades students received in Algebra I as well as track location in Algebra I (honors vs. regular) can affect their transition to the next level course move, such as up, repeat, or stop. Our supplementary analysis revealed that students who received a grade of A in Algebra I were more likely to experience higher number of up moves across high school years compared with students who received a grade of D in Algebra I. Second, we did not differentiate the highest level of mathematics, such as Calculus versus AP or IB Calculus. If we take into account both grades and course level, the actual number of course sequences in the HSLS:09 sample will be higher than 1,174 sequences identified here, and the number of optimal clusters can be different from the findings reported here. Third, we were limited in incorporating variations of math course offering across districts and states (e.g., multiyear Algebra IA and IB, multiyear Integrated Math) because we used a common standardized secondary school course classification system developed by the NCES. We also included a limited number of school curriculum variables by considering course offering on site only in Calculus, Advanced Physics, and Advanced Chemistry.
Results
Descriptive Distribution of Math Course-Taking Sequence Typology
Using all identified 1,174 course-taking sequences from full analytic sample, cluster analysis with k-means solution identified eight distinctive math course-taking typologies. Table 1 presents the course-taking behavior indicators, the average number of up, down, repeat, and no math moves, and the first and highest math course a student took by clusters.
Distribution of Relative and Absolute Move Indicators, by Clusters from k-Means Solution.
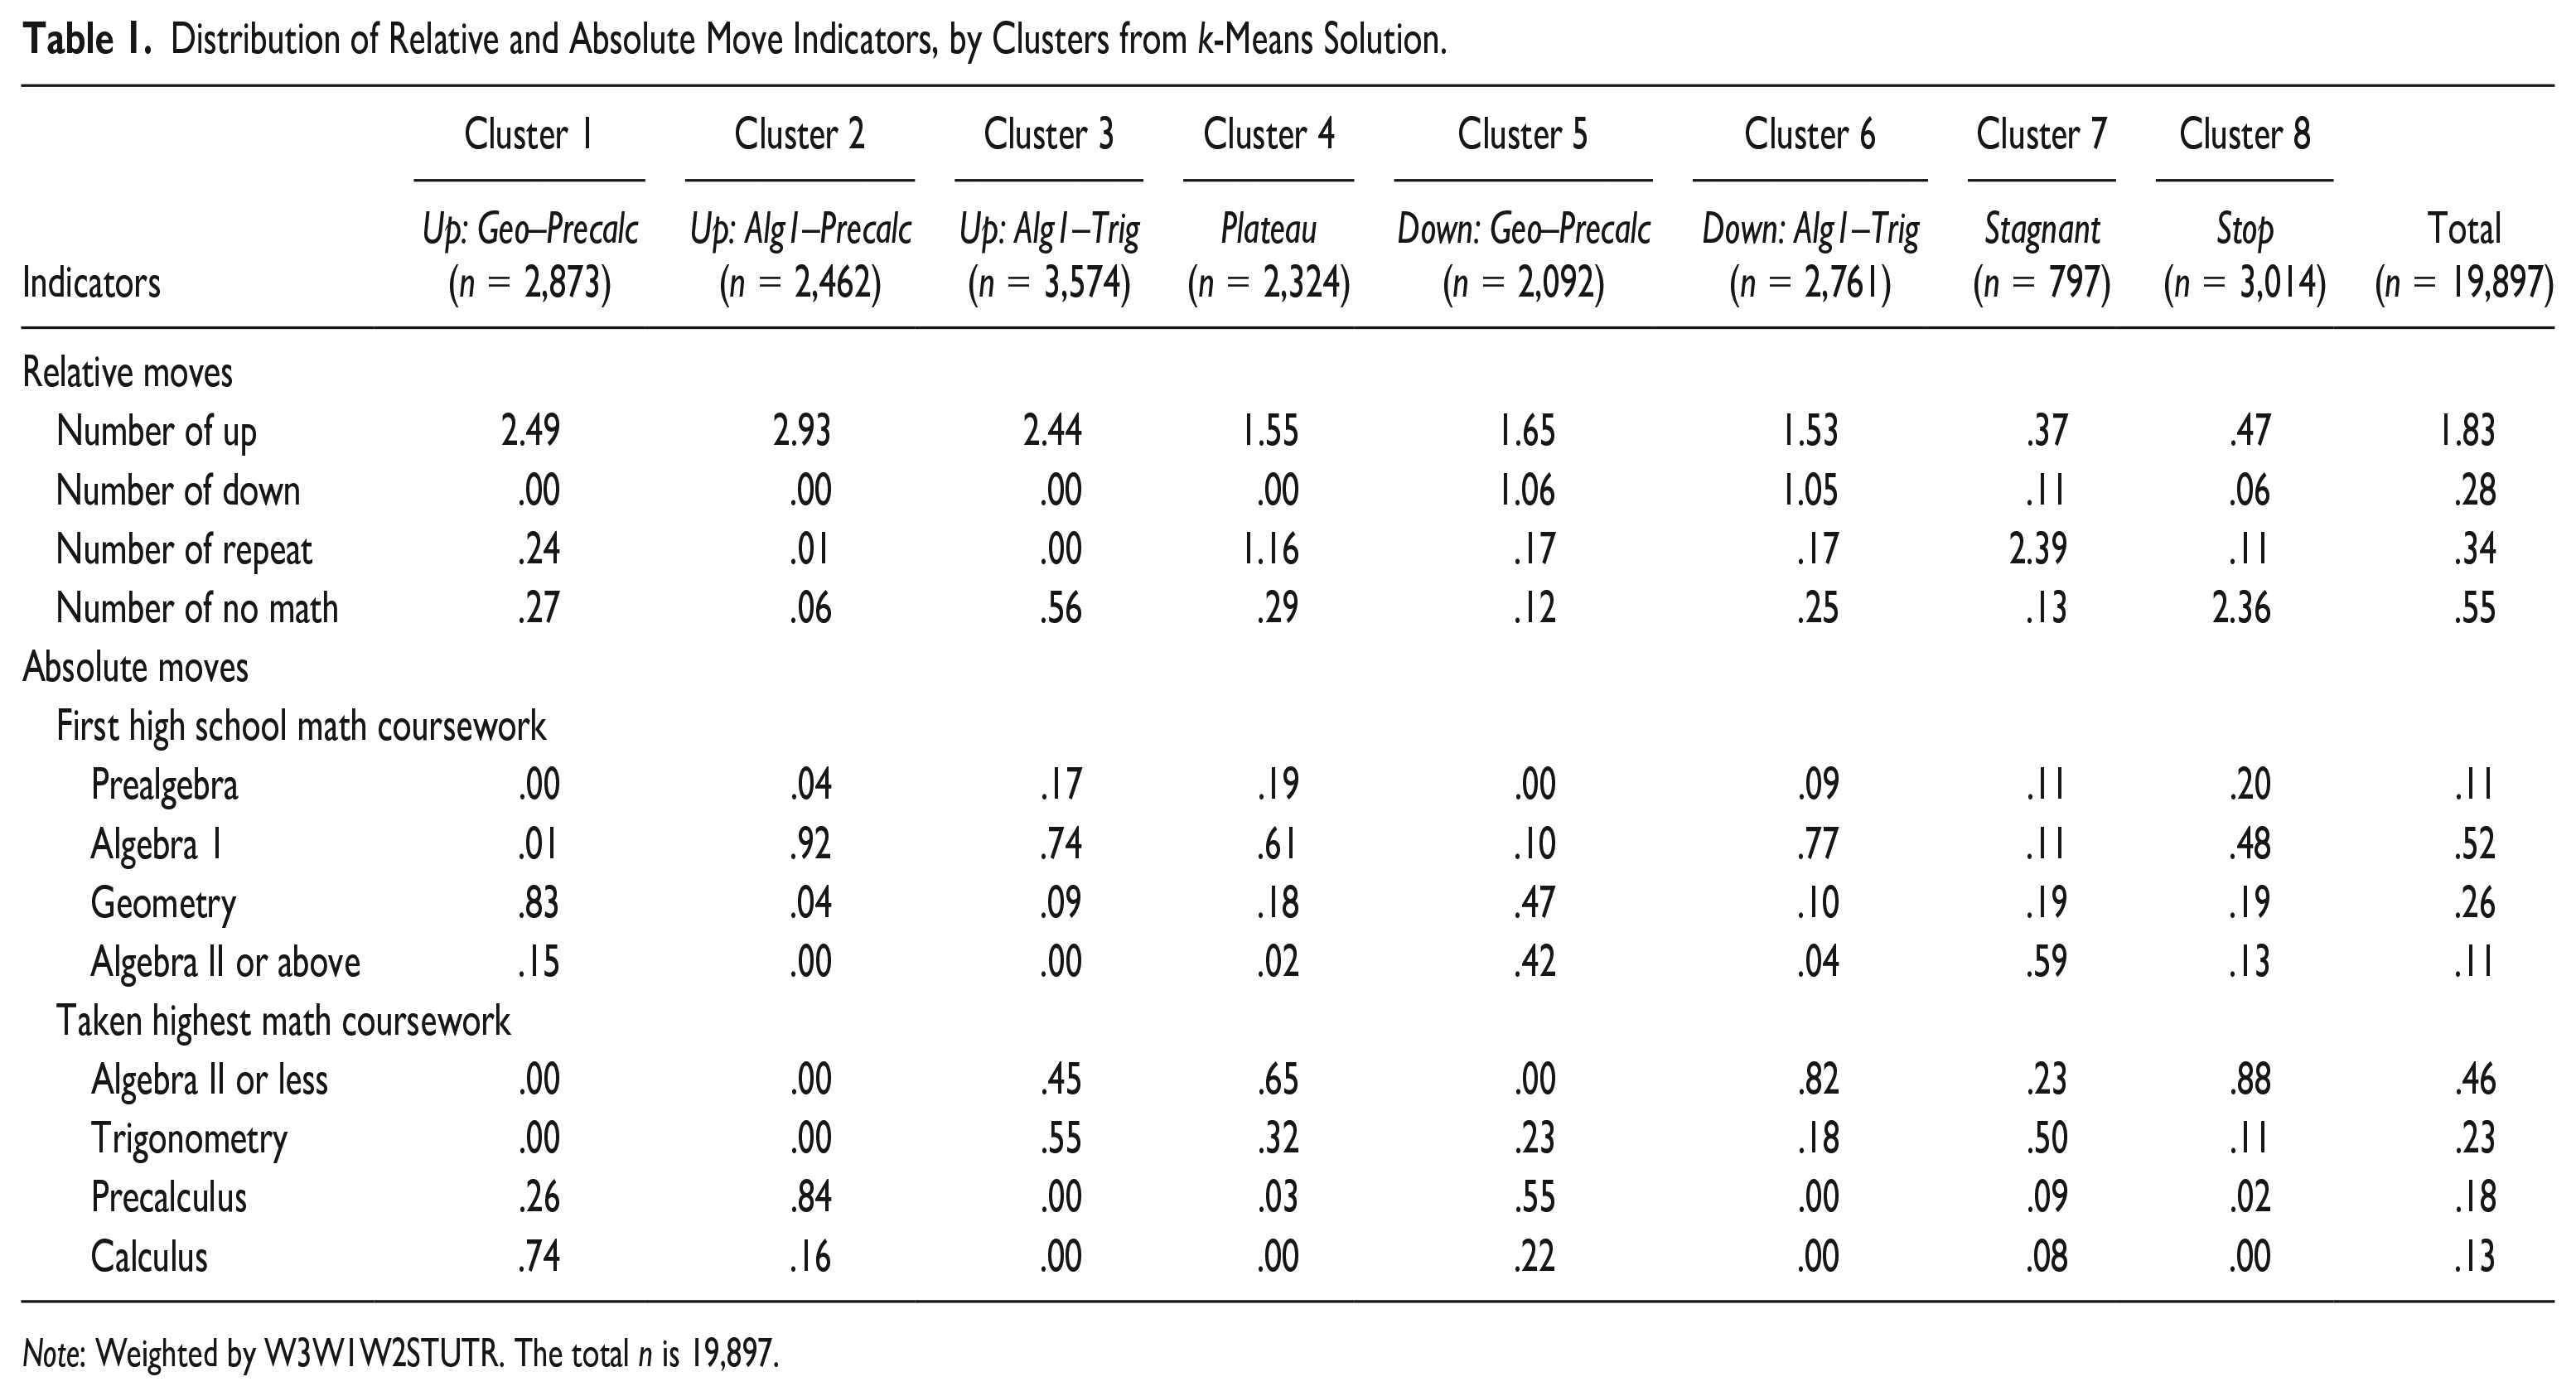
Note: Weighted by W3W1W2STUTR. The total n is 19,897.
Clusters 1, 2, and 3 show consistent up moves throughout high school (i.e., linear progression), although they vary in absolute moves (i.e., the first and highest math course a student took). Students in cluster 1 took Geometry or above in grade 9 and took Precalculus or Calculus by the end of high school. This feature informed the label Up: Geo‒Precalc. This typology represents an accelerated mathematics course-taking sequence. Most students in cluster 2 took Algebra I in grade 9 and then took Precalculus or Calculus by the end of high school. This feature informed the label Up: Alg1‒Precalc. This typology is the commonly expected four-year sequence of mathematics course-taking. Students in cluster 3 tended to take Algebra I or Prealgebra in grade 9 and then took Trigonometry or below by the end of high school. This feature informed the label Up: Alg1‒Trig.
Clusters 4, 5, 6, 7, and 8 show nonlinear progression throughout high school, that is, off track from linear progression. Students in cluster 4 experienced, on average, 1.55 up moves but repeated the same level of math course one time. However, they did not experience either down or no math moves. The majority of students in cluster 4 took Algebra I in grade 9 and took Trigonometry or below by the end of high school. These features informed the label Plateau.
Students in clusters 5 and 6 experienced at least one downward move throughout high school, while they varied in absolute moves (i.e., the first and highest math course a student took). Students in Cluster 5 (Down: Geo‒Precalc) took Geometry or above in grade 9 and took Precalculus or Calculus by the end of high school, whereas a majority of students in Cluster 6 (Down: Alg1‒Trig) took Algebra I in grade 9 and then took Algebra II or Trigonometry by the end of high school (see example course sequences in Figure 1). Many students in cluster 5 reached Precalculus or Calculus by the end of school, even though they experienced one downward move, such as Geometry–Algebra II–Precalculus–Trigonometry sequence and Algebra II–Precalculus–Calculus–Trigonometry sequence. Many students in cluster 5 tend to take the highest level of mathematics in grade 11 and then take less challenging courses in grade 12. Students in cluster 6, however, tend to experience downward move either at grade 11 or grade 12.

Example course sequences by clusters.
Students in cluster 7 experienced, on average, 2.39 repeat moves throughout high school, indicating that students repeated the same level of math for more than two years, on average. These features informed the label Stagnant. Students in cluster 8 experienced, on average, 2.36 no math moves, indicating that these students did not take math courses for more than two years during high school. This feature informed the label Stop.
Figure 1 presents exemplary course sequences in each typology. For visibility, we present the top three most frequent sequences in each typology. The solid red line indicates the most frequent sequence. It is followed by the green long-dotted line and black short-dotted line. In cluster 1, for example, the most frequent sequence is Geometry‒Algebra II‒Precalculus‒Calculus. The next most frequent is Geometry‒Trigonometry‒Precalculus‒No Math. The third most frequent sequence is Geometry‒Trigonometry‒Precalculus‒Calculus. Detailed sequences in each cluster are available in Appendix C. It is noteworthy that there is substantial heterogeneity within clusters. As shown in Appendix C, for example, when we counted sequences with more than 30 cases (following NCES reporting guidelines), we identified more than 30 different sequences within cluster 1.
Our cluster analyses revealed some noteworthy math course-taking sequences. About 45 percent of students took mathematics along a linear trajectory (clusters 1, 2, and 3), while about 55 percent took mathematics along a nonlinear trajectory (down, stop, stagnant, or plateau). When students take mathematics along a linear trajectory, the mathematics course-taking pattern most commonly expected for high school students is Algebra I in 9th grade, Geometry in 10th grade, Algebra II in 11th grade, and higher level courses (i.e., Trigonometry, Precalculus, or Calculus) in 12th grade. But only about 14 percent of students in our total analytic sample showed these course-taking patterns (see Appendix A).
Importantly, even among students who started with the same level of mathematics in grade 9 and reached the same highest level, math sequence pathways are diverse. For example, students who took Geometry in grade 9 and took Calculus as the highest level of mathematics experienced diverse pathways such as Geometry–Trigonometry–Precalculus–Calculus (consistent up moves), and Geometry–Precalculus–Calculus–Trigonometry (a down move from grade 11 to grade 12).
Students in clusters 1, 2, and 3 show consistent up moves throughout high school. The majority of students in clusters 1 (Up: Geo–Precalc) and 2 (Up: Alg1–Precalc) tend to take four years of mathematics, while many students in cluster 3 (Up: Alg1–Trig) tend to take three years of mathematics.
Students in clusters 1 (Up: Geo–Precalc) and 5 (Down: Geo–Precalc) appear to show similar absolute moves (the levels of mathematics in grade 9 and highest mathematics students took). However, students in cluster 1 took mathematics along a linear trajectory, while the majority of students in cluster 5 tend to take a lower level of math in grade 12 after they took mathematics along a linear trajectory until grade 11.
Students in clusters 3 (Up: Alg1–Trig) and 6 (Down: Alg1–Trig) tend to show similar absolute moves (the levels of mathematics in grade 9 and highest mathematics students took). However, many students in cluster 3 tended to take three years of mathematics and did not take mathematics in grade 12, while most students in cluster 6 took four years of mathematics. It appears that many students in clusters 3 (Up: Alg1–Trig), 5 (Down: Geometry–Precalc), and 6 (Down: Alg1–Trig) did not take mathematics in a way to maximize their college readiness and STEM potentials by not taking mathematics or completing less challenging courses after they took advanced-level mathematics.
There were also diverse nonlinear course-taking typologies, such as clusters 4 (Plateau), 5 (Down: Geo–Precalc), 6 (Down: Alg1–Trig), 7 (Stagnant), and 8 (Stop). Students in cluster 4 (Plateau) tended to repeat relatively lower levels of mathematics such as Prealgebra, Algebra I, Geometry, or Algebra II, although some students repeated Trigonometry.
There is substantial variation within the cluster 7 (Stagnant) sequence typology: Some students took advanced-level mathematics courses, such as Trigonometry, throughout high school, while others took low-level mathematics, such as Prealgebra, throughout high school. We conducted analyses of granular transcript data for those who took Trigonometry throughout high school. A majority of students took Integrated Math throughout high school. 6
Student and School Characteristics and Math Sequence Typology
Next, we examined individual and school-level characteristics associated with subgroup typology membership. Table 2 provides a complete descriptive profile of each cluster. 7 Results reveal that several individual factors are correlated with typology membership. For example, students’ race and SES are associated with typology membership. Compared with the overall high school population (the last column in Table 2), White and Asian students were overrepresented in cluster 1 (Up: Geo–Precalc), while Black students were overrepresented in cluster 7 (Stagnant) and cluster 8 (Stop). Latino/a students were overrepresented in cluster 4 (Plateau) and cluster 6 (Down: Alg1–Trig). These results suggest that students with low family SES and minoritized students tend to have nonlinear typology (Down, Stop, Stagnant, or Plateau), whereas high-SES, White, and Asian students tend to have linear typology (Up).
Student and School Characteristics by Clusters.

Note: Weighted by W3W1W2STUTR. SES = socioeconomic status; STEM = science, technology, mathematics, and engineering.
Students’ academic background characteristics are also associated with typology membership. For instance, students with high educational aspirations, STEM job aspirations, and high standardized test scores are more likely to have cluster 1 (Up: Geo–Precalc) or cluster 2 (Up: Alg1–Precalc) typology. Students in cluster 5 (Down: Geo–Precalc) tend to have higher education aspirations and STEM job expectations than the overall high school population. Despite these high aspirations, students in cluster 5 took less challenging courses in grade 12 after completing Precalculus or Calculus at grade 11. Students with low educational aspirations, STEM job expectations, and low standardized test scores are more likely to have cluster 3 (Up: Alg1–Trig), 4 (Plateau), 6 (Down: Alg1–Trig), 7 (Stagnant), or 8 (Stop). In particular, dropout students are more likely to have cluster 8 (Stop) typology. Students with learning disabilities were overrepresented in clusters 6 (Down: Alg1–Trig), 7 (Stagnant), and 8 (Stop).
Several school background characteristics are also associated with typology membership. For example, students with cluster 2 typology (Up: Alg1–Precalc), the commonly expected high school math course-taking sequence, were overrepresented in schools requiring four years of math for high school graduation. In comparison, students with cluster 6 (Down: Alg1–Trig) and cluster 7 (Stagnant) typology were also overrepresented in schools requiring four years of math for high school graduation. Our descriptive analyses suggest unintended consequences of four-year mathematics requirement among particular groups such as students in cluster 6 (Down: Alg1-Trig). When schools require four-year mathematics, students in clusters 1 and 2 tend to take four years of mathematics along a linear trajectory as policy makers expected. However, students in cluster 6 took four years of mathematics and met the graduation requirements by taking less challenging courses at grade 12 (a down move) after an upward linear progression from grade 9 to grade 11.
In addition, our descriptive analyses reveal that the student/counselor ratio is related to nonlinear typology membership. For example, students with clusters 4 (Plateau) and 7 (Stagnant) were overrepresented in schools with higher student/counselor ratios compared with the overall high school population.
Math Sequence Typology and Students’ Potential Outcomes
Last, we examine the association between math sequence typology membership and students’ potential high school and PSE outcomes. The findings are reported in Table 3. Not surprisingly, students are more likely to attend four-year institutions and choose STEM majors when they have linear trajectories of mathematics: clusters 1 (Up: Geo–Precalc) and 2 (Up: Alg1–Precalc). Among students with nonlinear typologies, students in cluster 5 (Down: Geo‒Precalc) are more likely to attend four-year institutions and choose STEM majors compared with students with other typologies such as cluster 3 (Up: Alg1–Trig). Despite a down move experience among cluster 5 students, they tended to start their 9th grade math in Geometry or Algebra II, and they completed either Precalculus or Calculus in grade 11. This advanced mathematics completion may be attributable to better outcomes in STEM major choices among cluster 5 students. The common feature across these three typology groups that are positively correlated with STEM major choice outcomes is that they completed Precalculus or Calculus by the end of high school.
Potential High School and Postsecondary Education Outcomes by Clusters.

Note: The proportion in each cell is weighed by W3W1W2STUTR. The total n is 19,897. PSE = postsecondary education; STEM = science, technology, engineering, and mathematics.
For STEM major choice in PSE, the analytic sample is limited to students who enrolled in postsecondary institutions in 2013 (n = 11,471).
More important, there were significant differences in high school and PSE outcomes when comparing outcomes across groups with similar absolute moves but diverging relative moves. For example, educational outcomes of students in clusters 1 (Up: Geo–Precalc) and 5 (Down: Geo–Precalc) tend to vary. There is a significant difference in the percentage of students who completed Calculus between cluster 1 (73.2 percent) and cluster 5 (21.3 percent). In addition, there is a difference in the percentage of students who enrolled in four-year institutions between these two groups (78.9 percent and 70.8 percent, respectively). Additional analyses reveal that cluster 1 students tend to enroll at more selective four-year institutions (not reported in Table 3). Cluster 1 also shows a higher rate of STEM major choice in college than cluster 5 (39.2 percent vs. 25.0 percent). It is noted that students in these two clusters appear to take a similar level of mathematics at grade 9 (Geometry or Algebra II) and take four years of mathematics, but they tend to have different pathways in transition from grade 11 to grade 12.
Likewise, students in clusters 3 (Up: Alg1–Trig) and 6 (Down: Alg1–Trig) appear to take similar-level mathematics at grade 9 (Algebra I) and complete the same-level highest mathematics, but these students’ access to PSE institutions vary. For example, there is a significant difference in the percentage of students enrolled in four-year institutions between cluster 3 (35.5 percent) and Cluster 6 (24.4 percent).
Conclusion
In this study, we sought to contribute to the scholarship on math course-taking patterns by assessing the micro moves engaged by students throughout the four years of high school mathematics and then characterizing thousands of mathematics course-taking sequences. Although many studies examined the race- and class-based gaps in the highest mathematics taken, very few studies, to date, consider the math course flow, which can reveal if students move coherently and successfully through math course-taking sequences. Our work provides an additional framework—the math course flow typology—to already existing important work. As we argue here, in so doing, we advance understanding of stratification in high school mathematics course-taking patterns and pathways toward PSE.
Our descriptive analyses revealed some noteworthy math course-taking sequences. First, we identified 1,174 combinations of math course-taking sequences. Only about 14 percent of students took the four-year linear sequence of Algebra I–Geometry–Algebra II–Advanced Mathematics (i.e., Trigonometry, Precalculus, or Calculus). In other words, a majority of U.S. high school students’ mathematics coursework did not progress along a linear trajectory. Additionally, even when students took the same mathematics level in grade 9 and reached the same highest level of mathematics during high school, they experienced various math course-taking sequences—for example, stop taking mathematics altogether, repeat coursework, or regress to lower level courses, particularly in transition from 11th grade to 12th grade—possibly leading to different future postsecondary outcomes. When taking into account the course level (e.g., honors vs. regular Algebra I) and performance (e.g., course grades), it should be noted that the number of course sequences can be higher than 1,174 combinations reported here because inclusion of these factors enables researchers to identify far more complex mathematics sequences.
Our analyses underscore the need for policy makers, practitioners, and researchers to specifically recognize diverse course-taking patterns rather than continuing to engage a singular focus on highest math course completed. When policy makers attempt to move accountability systems from a compliance orientation to one centered on continuous improvement and learning (Darling-Hammond et al. 2016), our framework can additionally be useful with respect to offering a tool for secondary schools’ self-assessment with regard to math course-taking histories, thereby offering an important opportunity to intervene in mathematics course flows and potentially altering outcomes associated with a critical mechanism of stratification in postsecondary entrance patterns (Posselt et al. 2012; Riegle-Crumb 2006; Riegle-Crumb and Grodsky 2010; Rodriguez 2018). Such intervention should pay particular attention to a pivotal time in high school years, 11th and 12th grade. With such intervention, more students can reach higher levels of mathematics by the end of high school, thereby potentially altering opportunities for low-income minoritized students to declare a STEM major in a postsecondary institution, graduate from four-year institutions, and persist and graduate in STEM. 8
Using cluster analyses with a k-means solution, we identified meaningful typologies of math course-taking sequences. A typology of math course-taking sequences is a powerful way to understand the thousands of math course-taking sequences that high school students evidenced. Our descriptive analyses revealed some noteworthy student characteristics in each typology. Consistent with prior research (Eisenhart and Weis 2022; Fong et al. 2014; Irizarry 2021), socioeconomically disadvantaged and underrepresented minoritized students are more likely to have nonlinear typologies than their more socioeconomically privileged and White peers. In recent work, Ngo and Velasquez (2020), using data from an urban school district and local community colleges in California, found that many of these students experienced chronic repetition of math coursework in transition to college and never again reached the levels of math they had achieved in high school. These results imply that policy makers, practitioners, and researchers should recognize diverse high school course-taking patterns, math performance levels, and the highest levels of math completed, to reduce inequality in mathematics outcomes, as well as related STEM opportunities in college and career.
Importantly, several school characteristics, such as years of mathematics required for high school graduation and student/counselor ratios, vary across typologies of math course-taking sequences. Although our analyses of student and school characteristics associated with typology membership are very descriptive, our findings suggest some areas for research in policy improvements, such as school curriculum (e.g., advanced course offering on site), high school graduation requirements and unequal access to high school counselors.
Discussion and Future Study
The typologies of math course-taking patterns that we identified here have important implications for future studies. First, future research should take into account course level—as linked to the same course (e.g., regular vs. honors), performance, and differentiated courses in highest level mathematics (e.g., Calculus vs. AP or IB Calculus). By taking into account Algebra I course level and performance, for example, these studies can help identify far more complex math course flows experienced by students in high school and understand why students experienced diverse pathways even when they similarly started high school math at Algebra I.
Second, further research is required to investigate an array of mediating factors that produce descriptive findings reported here on social class- and race/ethnicity-based inequalities in course-taking typologies, such as prior achievement, parental intervention, unequal access to key educational resources (e.g., school counselors), and unequal distribution of learning opportunities (e.g., advanced course offering on site). These studies can help inform policy makers, practitioners, and researchers regarding who is likely to take the different typologies of math course-taking sequences. Studies on course-taking typologies need to be extended to other underrepresented groups in STEM, such as English language learners and students with disabilities.
Third, future research should examine carefully the policy-amenable organizational structures of schools to influence coherent and successful progression in hierarchical mathematics course-taking, such as school-level math course credit requirements and student/counselor ratios (or caseloads). State and local educational policy makers have raised American high school students’ course-taking requirements over the past three decades, and high schools are allowed to exceed state requirements to improve students’ college readiness. However, our findings indicate that these policies may not have uniform equivalent effects without a careful analysis of students’ course-taking sequences (in addition to highest math level reached). By way of example, on the one hand, students with the Up: Alg1–Precalc (cluster 2) sequence typology were overrepresented in schools with a requirement of four years. On the other hand, our data suggest that students with the Down: Alg1–Trig sequence (cluster 6) typology are also overrepresented in schools requiring four years of mathematics. Policy makers and administrators might expect that a student would take advanced levels of math, such as Trigonometry, Precalculus, or Calculus, to maximize their college readiness and STEM potential when a school requires four years of mathematics to meet graduation requirements. However, our analyses suggest that a student who took mathematics with an upward linear progression from 9th to 11th grade and then took a lower level of math (a down move) might be doing so to meet the graduation requirement of four years of math (Eisenhart and Weis 2022; Nikischer et al. 2016). When students may follow Geometry‒Algebra II‒Precalculus‒Calculus instead of Geometry‒Algebra II‒Precalculus‒Trigonometry, for example, they can increase their probability of success in College Calculus, a gatekeeper for STEM majors (Sadler and Sonnert 2018). However, relatively small missteps such as a downward movement at grade 12 can result in loss of opportunities for STEM pathways, become insurmountable disadvantages over time, and make it difficult for these students to catch up with their careers, incomes, or other measures (Eisenhart and Weis 2022; DiPrete and Eirich 2006). Future studies should examine the causal effects of course requirements at the school level on the probability that a student takes a corpus of math courses that exhibits a particular kind of movement over the course of high school. Less economically capitalized White students and minoritized students appear to be underrepresented in Up: Geo–Precalc (cluster 1) and Up: Alg1–Precalc (cluster 2). Given this, future research also needs to examine if the effects of course requirements at the school level on math course-taking sequence typologies are consistent across student racial, ethnic, SES, and other backgrounds and if these graduation requirement policies contribute to reducing inequalities in math course-taking sequence typologies.
Future research should also investigate the role of high school counselors in students moving coherently and successfully through hierarchical math course-taking sequences. Multisite longitudinal qualitative studies (Eisenhart and Weis 2022; Nikischer 2013; Nikischer et al. 2016) reveal that in urban schools serving low-income and underrepresented minoritized students, school guidance counselors were overwhelmed with tasks related to accountability mandates and with students in crisis, with consequent result that students who were on track to graduate were left entirely on their own to select their classes for senior year. As a result, high-achieving students who are interested in pursuing STEM fields beyond high school tended to enrolled in “fun” (non-college-preparatory) classes, hoping for an “easy year” and a higher grade point average in their senior year (Eisenhart and Weis 2022). This may explain why many students in cluster 5 (Down: Geo‒Precalc) and cluster 6 (Down: Alg1‒Trig) experienced down moves in grade 12.
Both quantitative and qualitative researchers need to investigate further whether, and the extent to which, each typology of math course-taking sequences affects students’ morale and aspirations and future attainment outcomes, such as access to postsecondary institutions, success in college-level gatekeeper courses in STEM, and degree completion in STEM. For example, our analyses revealed that students within clusters 3 and 6 (i.e., those who had the same absolute moves but different relative moves) could have different educational outcomes in PSE. Future studies can help sort out which typology, or typologies, might affect four-year college admission and degree completion in STEM. In particular, future research would do well to examine the extent to which sequences have varying effects on outcomes for differentially positioned SES and minoritized students. A small difference during high school years can be magnified over time for particular groups, such as low-income and racially minoritized students, making it difficult for those who are slightly behind at a point in time in educational trajectories to catch up. Future studies should examine if a small step toward off track (nonlinear) math course sequences in high school years can lead to a cumulative disadvantage over time (Eisenhart and Weis 2022; DiPrete and Eirich 2006), with resultant long-term effects on race- and class-based stratification in higher education and social mobility.
Supplemental Material
sj-docx-1-srd-10.1177_23780231231169259 – Supplemental material for On Track or Off Track? Identifying a Typology of Math Course-Taking Sequences in U.S. High Schools
Supplemental material, sj-docx-1-srd-10.1177_23780231231169259 for On Track or Off Track? Identifying a Typology of Math Course-Taking Sequences in U.S. High Schools by Seong Won Han, Chungseo Kang, Lois Weis and Rachel Dominguez in Socius
Supplemental Material
sj-pdf-1-srd-10.1177_23780231231169259 – Supplemental material for On Track or Off Track? Identifying a Typology of Math Course-Taking Sequences in U.S. High Schools
Supplemental material, sj-pdf-1-srd-10.1177_23780231231169259 for On Track or Off Track? Identifying a Typology of Math Course-Taking Sequences in U.S. High Schools by Seong Won Han, Chungseo Kang, Lois Weis and Rachel Dominguez in Socius
Footnotes
Acknowledgements
We would like to acknowledge the generosity of Alan Schoenfeld, Jim Ryan, and Phil Daro, who guided and weighed in on our classification scheme. Their expertise in this area allowed us to make thoughtful decisions as we reduced the number of mathematics categories. Thanks to Margaret Eisenhart and her team, whose prior work on a National Science Foundation (NSF)–funded project with Lois Weis helped highlight the importance of this subsequent study. We would also like to thank our NSF Advisory Board members. In addition, special thanks to Laura Perna, Catherine Riegle-Crumb, Adam Gamoran, and Ken Frank for their feedback on our work. Thanks also to the late Dr. Karen D. King, our previous NSF program officer, for her support of this project, and to our current NSF program officer, Dr. Jolene Jesse, for her continuing support. The article is substantially improved by virtue of this collective attention. Thanks also to Kriti Singh, project team member, for her participation in aspects of this article. Any opinions, findings, and conclusions or recommendations expressed are those of the authors and do not represent views of the NSF.
Funding
The author(s) disclosed receipt of the following financial support for the research, authorship, and/or publication of this article: This research was supported by the NSF, DGE#1660402, Effects of State Policy on High School Science, Technology, Engineering, and Mathematics (STEM) Opportunities and Outcomes for Low-Income Underrepresented Minorities, to Dr. Lois Weis (principal investigator) and Dr. Seong Won Han (co–principal investigator).
Supplemental Material
Supplemental material for this article is available online.
1
Educational researchers, for example, have developed a typology of college students’ course-taking and transfer patterns (e.g., Bahr 2010; Wang et al. 2019) and a typology of state and local college programs (e.g., ![]() ) using a cluster analysis or similar approaches.
) using a cluster analysis or similar approaches.
2
We excluded students who repeated a grade level in high school from our analytic sample.
3
We also coded course-taking sequences by semester and compared grade-by-grade progression sequences with semester-by-semester progression sequences. They were almost identical; most students took the same level of mathematics in one academic year.
4
In some school districts, after Algebra I, students may have the option to take Algebra II and then Geometry. We checked the proportion of students who took mathematics in the following sequence: Algebra II–Geometry. In our analytic sample, 869 students took Algebra II before they took Geometry. When we coded our relative curricular move indicators (i.e., up, down, repeat, and no math), the move from Algebra II to Geometry was coded as down. We checked if this coding affected our cluster analyses results by recoding the move from Algebra II to Geometry as up rather than down in our relative curricular move indicators. For example, when a student took Algebra I–Algebra II–Geometry, the move from Algebra II–Geometry was coded as up rather than down. Likewise, when a student took Algebra II–Geometry–Trigonometry or Precalculus, the move from Algebra II to Geometry was coded as up rather than down. Overall, the cluster analysis findings are highly consistent across these different coding approaches.
5
In general, states set the minimum number of years of mathematics required to meet high school graduation. Schools are allowed to exceed them. In the HSLS, school administrators were asked to report school-level requirements in several subjects for high school graduation. We used school principals’ reports to measure the mathematics credit requirement for high school graduation in each sampled school.
6
The multiperiod sequence of Integrated Math replaces the traditional Algebra I, Geometry, Algebra II sequence courses. Students at a small but growing number of high schools across the country are moving toward an integrated mathematics pathway. In our analytic sample, those who took Integrated Math throughout high school were concentrated in high schools in Georgia. In an effort to use a single standard course code scheme in high school transcript studies conducted by the NCES, the NCES allowed each education agency to map integrated courses to multiple School Codes for the Exchange of Data course codes. The subject coding mechanism used by the NCES takes into account the content covered and difficulty level (National Forum on Education Statistics 2014). When the HSLS transcript study created the indicator of highest level of mathematics, Integrated Math was classified into “other advanced math,” which included Trigonometry, Algebra III, Probability and Statistics, and Noncalculus AP or IB courses (![]() ). Following this NCES mathematics difficulty level coding scheme, we coded Integrated Math as “other advanced math.”
). Following this NCES mathematics difficulty level coding scheme, we coded Integrated Math as “other advanced math.”
7
Because there is a substantial variation within cluster 7 (Stagnant), we conducted descriptive statistics analyses by subsample (i.e., those who took Trigonometry throughout high school vs. others). Compared with other students in cluster 7, it appears that students who took Trigonometry throughout high school had higher SES and higher standardized test scores. Those who took Prealgebra throughout high school tended to take the same low level of mathematics because of low performance in mathematics. In addition, Latino/a students appear to be overrepresented in the group of repeating low level of mathematics, such as Prealgebra, throughout high school. Details are reported in ![]() .
.
8
In so stating, we are not unaware of complexities associated with altering postsecondary entrance patterns for low-income minoritized students, in particular. However, paying greater attention to mathematics course flows will enable a higher proportion of students from varying backgrounds to be competitive for admission to postsecondary institutions, as they will not be “locked out” by virtue of highest level math course taken (Posselt et al. 2012; Riegle-Crumb 2006; Riegle-Crumb and Grodsky 2010; ![]() ).
).
Author Biographies
References
Supplementary Material
Please find the following supplemental material available below.
For Open Access articles published under a Creative Commons License, all supplemental material carries the same license as the article it is associated with.
For non-Open Access articles published, all supplemental material carries a non-exclusive license, and permission requests for re-use of supplemental material or any part of supplemental material shall be sent directly to the copyright owner as specified in the copyright notice associated with the article.