
Abstract
Sociological research on online discourse increasingly uses digital data consisting of messages combining multiple modes of media, with meaning arising from contents’ interaction across modes. Yet, techniques to study this interplay are underdeveloped relative to the toolkit for analyzing solely texts. The authors introduce an automated approach for relationally analyzing texts and images, focusing on how to examine the discursive meaning emerging from concepts’ connections across associated text and image modes. The authors validate this approach using a crowdsourced task and obtain results suggesting that applying social network metrics to semantic space can generate useful insights into how people understand discourse. To illustrate this approach, the authors examine the concept of “securitization” in online white supremacist discourse. The findings indicate that ideas of securitization link notions of personalistic leadership with imagery of space and place. This analysis demonstrates how the authors’ approach helps researchers understand multimodal material and meaning-making in digital discourse.
Keywords
One challenge facing sociological research on digital discourse is that online communication increasingly combines multiple modes of media, with meaning arising from the modes’ interaction. In recent years, social scientists have added to a long tradition of content analysis by developing tools well suited for examining large databases of digital text (Krippendorff 2019), but textual expressions on digital and social media platforms often have images for company (Chen et al. 2021). Analyzing these expressions’ text content with popular computational tools that do not account for the accompanying images may provide a partial or even biased understanding of the discourse the expressions compose. For example, consider social media posts with text that simply signals support for a politician and images that depict right-wing symbols. Such images interact with the associated text to construct a discourse in support of right-wing politics.
In this article, we introduce an approach for relationally analyzing both texts and images in large collections of digital and social media data. We additionally offer evidence of the validity of our approach. Sociological studies of digital discourse using quantitative or computational methods often lack a formal assessment of how well their measurements capture people’s understanding of the communication they experience. This is due, in part, to the methods being complex and difficult to interpret, as well as the results’ associated uncertainty and error (Fong and Tyler 2021; Knox, Lucas, and Cho 2022; Wang, McCormick, and Leek 2020). Yet, many of these studies often treat their results as accurate measurements of people’s perceptions, ideas, and sentiments. Although this in itself is not problematic, it is cause for concern that the measurements—and the assumptions that they capture individuals’ understandings of discourse—are rarely validated. Therefore, we use people’s judgements to validate the findings we obtain from our methodology. Our positive results lend support to other analyses using network-derived metrics and relational approaches when studying discourse (see Basov, Breiger, and Hellsten 2020).
We demonstrate our approach by examining the concept of “securitization” in online white supremacist (WS) discourse. Security forces, ranging from metropolitan police organizations to paramilitary militias, have long played a key role in the American WS movement. For example, police departments often enforced Jim Crow in the United States South, the modern Ku Klux Klan drew many members from the ranks of the police, and veterans of the Vietnam War were instrumental in establishing the contemporary WS movement (Belew 2018; McVeigh and Estep 2019). More recently, some rioters at the Capitol on January 6, 2021—an event that, although not explicitly WS, had WS overtones (Munn 2021)—were active police officers and military personnel from across the country (Kornfield 2021; Luscombe 2023).
The storming of the Capitol additionally underscored the American WS movement’s use of online communication to mobilize supporters and propagate its discourse (McSwiney 2021; Miller-Idriss 2020). Popular social media platforms such as Facebook, YouTube, and Twitter attracted most of the attention in the immediate aftermath of the attack, but expressions of mobilization in the days prior to the riot were also common on other platforms, such as Parler (Heilweil and Ghaffary 2021; Mosley and Hagan 2021). Beyond helping coordinate the Capitol riot and other instances of collective action, the numerous online discursive spaces popular within the WS movement—from mainstream to fringe, rudimentary fora to sophisticated social media platforms—facilitate the movement’s expression of ostracized beliefs and help form shared identities and deeply valued online “families” (Jasser et al. 2021).
The robust online discourse of the American WS movement and, more generally, the right-wing, highlights an underdeveloped dimension of our knowledge about securitization and the movement. Prior research has examined the social conditions and processes that have entwined security forces and the WS movement, shedding light on key historical events and organizational dynamics (e.g., Belew 2018; Jackson 2020; McVeigh 2009; McVeigh and Estep 2019). Relatively less work has focused on the conceptualization and articulation of securitization, or how members of the movement discuss the need to support and act as security officers, purportedly protecting and policing property and neighborhoods with military-grade weapons (for examples, see Beauchamp 2021; Homans 2021).
Our illustrative analysis of securitization in the discourse of the contemporary American WS movement specifically examines whether the notion of securitization plays a role in WS online discourse and, if it does, what its role is. Surprisingly, we find that the concept of securitization amounts to a relatively small volume of the online discourse. However, it is imbued with importance by its place within the discursive space. Securitization stands out for the degree to which it connects multiple topics, specifically place-based images and textual references to Donald Trump. Intriguingly, these two concepts of place and personalistic leadership are central to WS and right-wing politics in the United States and abroad (Cramer 2016; Fitzgerald 2018; McQuarrie 2017; Weyland 2021). Furthermore, securitization is the most important topic for bridging two modes of online communication: text and image. This makes the idea of securitization even more significant, we posit, because it connects information and emotions that may be uniquely conveyed in each mode (Barthes 1977; Joo and Steinert-Threlkeld 2019; Williams, Casas, and Wilerson 2020). That is, by linking discursive topics central to WS political thought and modes of communication, securitization likely plays a critical role within the WS discursive landscape, despite not being the most prominent topic of discussion. These results help advance research on WS and right-wing politics, while also demonstrating an analytical approach useful to social scientists interested in the multimodel material and processes of meaning-making in any kind of social media and digital discourse.
Analyzing Text and Image
We start from a simple yet important insight from the literary theorist Barthes (1977): when text and images together help constitute a discourse, “there is never a real incorporation since the substances of [text and image] are irreducible, but there are. . . degrees of amalgamation” (p. 26). Furthermore, the meaning that emerges from this partial amalgamation depends on the movement between its elements of text and image. In other words, understanding the meaning of a discourse comprising text and image necessitates understanding their relationship and interplay (Barthes 1977).
Of course, we are not the first researchers of digital discourse to recognize the importance of analyzing text and images side-by-side. However, we do pursue a relatively unique aim. We focus on measuring and interpreting the relations between text and image to make inferences about the discursive meaning emerging from these relations. To clarify what is distinct about our focus and the approach we subsequently adopt, this section situates our analytical goal and approach in related scholarship. 1
Although using computational techniques to analyze text data is now commonplace in sociology and cognate disciplines, social science research has yet to develop comparably accessible and conventional computational methods for analyzing images, not to mention multimodal data (e.g., text and image somehow connected). Indeed, in a survey of English-language social science articles published between 2015 and 2019 that empirically examined social media, Chen et al. (2021) found that only 233 of 2,349 used images as (some) data. This is starting to change, however, with growing data availability, more powerful computers, and new methodological techniques designed by and for social scientists (Chen et al. 2021).
The small but growing scholarship computationally analyzing images centers on two tasks, measurement and inference (Williams et al. 2020), like its “text-as-data” sibling and much noncomputational content analysis research (Krippendorff 2019). The former task assesses content; it detects and labels objects in images, finds people and their faces, infers humans’ attributes (e.g., ethnicity, age) and expressions (e.g., emotion, ideology), and so on. It is usually done by building on the manual coding of concepts within and across observations (e.g., Casas and Williams 2019; Trilló and Shifman 2021; van Haperen, Uitermark, and van der Zeeuw 2020), using machine learning (ML) methods (e.g., Cantú 2019; Steinert-Threlkeld, Chan, and Joo 2021; Xi et al. 2020; Zhang and Pan 2019), or a combination of the two, such as by first doing manual coding to uncover concepts—and examples of these concepts—that are then used in ML-driven analysis (e.g., Steinert-Threlkeld and Joo 2020; Steinert-Threlkeld et al. 2021; van Haperen et al. 2020). 2 After identifying and measuring relevant dimensions of images, researchers usually then classify all the images in the database using a framework relevant to their research questions. 3
The latter task, inference, typically happens after images have been measured and classified. Researchers treat images, or, more specifically, their content, as a cause of an outcome or use them to construct predictor or response variables in statistical models. For example, Casas and Williams (2019) examined whether images on Twitter promote online mobilization; Mitts, Phillips, and Walter (2022) analyzed the effect of sets of images (or, videos) on viewers’ support for militant groups; and Steinert-Threlkeld et al. (2021) drew on Twitter images to overcome common obstacles in measuring protest, then used their measurement in a study of state repression, protest size, and protester violence (see also Zhang and Pan 2019).
A small portion of the computational and large-n “images-as-data” scholarship analyzes cooccurring text and image together, such as when a tweet or blog post contains both some text and one or more images. This kind of research often seeks to improve measurement by incorporating textual information into algorithms designed to classify the document (or, frequently, just the image portion) (e.g., Wu and Mebane 2021; Yang 2021; Zhang and Pan 2019). Some of this work does focus on the interaction of text and image, as we do, but stops short of examining how the interplay helps construct meaning in a discourse. 4 For example, studies may analyze how the interpretation of one mode affects the interpretation of the other, such as how an online dating profile’s picture affects the perception of its written portion (Van der Zanden et al. 2022). Other research considers each mode as an input of information about the meaning of a discrete object, such a particular meme, but not a general discourse (e.g., Baishya 2021; Milner 2016).
In contrast, our approach enables analyses of how a discourse’s meaning emerges from the interplay between its textual and pictorial elements, or, more precisely, from the relations between the concepts and notions captured in the discourse’s text and images. In developing this approach, we build on two premises. The first is the general idea that meaning in discourse is relationally constituted by its elements. The second is the more specific insight from formal cultural sociology and semantic network analysis that mapping and analyzing these relations as a network graph can uncover important features of discursive meaning (Bearman and Stovel 2000; Carley 1997; Carley and Kaufer 1993; Edelmann and Mohr 2018; Hoffman et al. 2018; Puetz, David, and Kinney 2021; Rule, Cointet, and Bearman 2015; Stoltz and Taylor 2019; Yung 2021; for reviews, see Basov et al. 2020 and Mohr et al. 2020). Put differently, the relationships between discursive elements (e.g., concepts, ideas, topics) influence not only the elements’ own meaning but the meaning of the discourse they help compose, and using network analysis techniques to systematically study these relations helps us gain unique insight into the discourse. To provide a simplistic example, researchers of militant groups’ discourse might arrive at new insights if they discover that the groups’ concept of violence is significantly linked with notions of morality but not with ideas about a clash of cultures or civilizations.
We explain the methodological details of our analytical approach below. In brief, we render a corpus of online discourse captured in both text and images as a two-mode semantic network graph. In the graph, the concepts forming the discourse are the vertices. Vertices from one discursive mode, text, are connected both to one another (forming a text layer) and to the vertices in the second discursive mode, images, (forming an intermode layer) which are themselves interconnected (an image layer). Then, because we are interested in how concepts’ relations contribute to the larger discursive structure, we calculate the vertices’ betweenness centrality, both within layers and across layers. Betweenness centrality is a network metric well suited for measuring how entities represented by vertices—in this case, discursive concepts—exert influence by connecting other vertices (Freeman 1977). Measuring interlayer betweenness centrality further captures a unique influence gained by linking concepts expressed in text with concepts expressed in images. After calculating the betweenness centralities, we interpret and validate the results.
The validation exercise, which we explain and present after reporting the main analytical results, is an additional contribution of our study. When using a semantic network approach, researchers sometimes make inferences on the basis of analyzing the network using metrics and techniques for social network analysis (SNA), as we do (e.g., Hellsten, Opthof, and Leydesdorff 2020; Nerghes et al. 2015; Shim, Park, and Wilding 2015). Yet these metrics and techniques were developed for studying people and their relationships, and it is not clear if they are appropriate for semantic elements and relations. Few of the studies applying SNA tools to semantic networks validate their results.
5
Basov et al. (2020) explained the problem this way: Most of the measures developed within [SNA] focus on the relations between social actors and are not necessarily suitable as measures of semantic networks of cultural elements, and proper justifications and reconsiderations are yet to be made. For example, while degree centrality signals the importance of a social actor in a network, in semantic networks the words with trivial meaning often have the highest degree centrality. (p. 8)
To summarize, our approach synthesizes and advances three literatures. First, it helps develop the emerging computational “images-as-data” and multimodal scholarship in social science by introducing an accessible approach for measuring the connections between images and text, as well as for analyzing these connections in a way that offers insights about the discursive meaning generated by associated images and text. For both the second and third literatures, formal cultural sociology and semantic network analysis, we show how to render a discourse built on both text and images as a semantic network. In addition, we offer evidence that using common SNA techniques to analyze such a semantic network can generate valid insights into how people understand the discourse.
Empirical Context and Data
Securitization and White Supremacy
The WS movement, like the broader right-wing, is far from a new phenomenon in American politics (Lipset 1955; Lipset and Raab 1973). Moreover, throughout its history, veterans of American armed conflicts, from the Civil War to the Gulf wars, have played a major role in establishing and shaping its trajectory. These veterans’ experiences and expertise have been highly valuable resources for the mobilization of paramilitary organizations and militias built on WS and right-wing thinking, such as how a small group of Vietnam War veterans was instrumental in strengthening white power organizations during the 1970s and 1980s (Belew 2018).
During the past decade, these “securitized” groups’ ideas and membership have increasingly traveled from the fringes to the mainstream of the American political right (Belew and Gutierrez 2021; Jackson 2020; Mudde 2019). For instance, police unions, including the Fraternal Order of Police, the largest and oldest police union in the United States, endorsed Donald Trump during the 2016 presidential campaign (Thomas and Tufts 2020). The largest U.S. border patrol union, with roughly 16,000 members, endorsed Trump before the 2016 election with its first ever endorsement of a presidential candidate (Aguilar 2016). Such involvement of veterans’ organizations and law enforcement in right-wing politics proved crucial for the rise of Donald Trump during the 2016 U.S. presidential election and the radical allies he brought into the mainstream (Zoorob 2019; Zoorob and Skocpol 2020).
Although securitization is, and has long been, important for the American right-wing, the United States is not an exception. In Germany, for instance, far-right ideas have found a receptive audience among military personnel (Bischof 2021). In Austria, veterans have been linked with the popularization of populist radical right ideas (Art 2011). And in Spain, support for right-wing populism is especially high among military personnel (Villamil, Turnbull-Dugarte, and Rama 2021). Furthermore, this relationship between security-minded and security-linked individuals and the extreme right in Europe is not new. Veterans of World War I were crucial supporters of early fascist movements in Italy and Germany (Paxton 2005).
These consistent, cross-national patterns are largely attributable to one of the core tenants of the contemporary radical right: authoritarianism (Mudde 2007). Although it has been conceptualized in various ways, authoritarianism is broadly understood as valuing social cohesion and conformity to ingroup norms over personal freedom and individual autonomy (Engelhardt, Feldman, and Hetherington 2021). Supporting social cohesion and conformity is central to WS movements because it implies support for hierarchies that are often racial (as well as based on gender, religion, and other dimensions of identity). And, importantly for our study, authoritarian preferences also characterize members of security forces, whether the military or governmental and civilian organizations (Simi, Bubolz, and Hardman 2013). It is thus not surprising that previous research has observed that authoritarian impulses of the WS movement, as well as the general right-wing, resonate with security personnel across countries, historical periods, and political contexts.
In sum, the scholarship on contemporary WS and right-wing organization, politics, and thought leads us to expect that the concept and articulation of securitization plays a role in WS discourse. Yet, securitization’s specific role in the discourse, particularly in the relatively new online discourse, is less clear. To shed light on how exactly notions of securitization shape the WS movement’s online discourse and drive meaning-making in the movement, we apply our analytical approach to an original data set of WS online discourse.
Data
Collecting all online material generated by all American WS groups is not straightforward, so we construct a corpus comprising a sample of these groups’ digital and social media platform content. Selecting the sample involved four steps. First, we created a sampling frame by listing all the groups recorded by the Southern Poverty Law Center as being “white nationalists,” “neo-Nazis,” “neo-Confederates,” or “Ku Klux Klan” (Southern Poverty Law Center 2023). Second, we randomly selected 110 groups from this list. 6 Third, we searched for the selected groups’ accounts on Twitter and found that 28 of the 110 groups had had least one unblocked account during data collection in July 2019. Some of these groups were Faith and Heritage, the National Policy Institute, the Pacific Coast Knights of the Ku Klux Klan, and Red Ice. We collected these active accounts’ public text and image content. We also collected tweets’ metadata, such as their time stamps and number of views. 7
Finally, because Twitter, like other mainstream platforms, put some effort to censor extreme content (at the time of data collection), our fourth step involved gathering additional data from two so-called free speech online fora, BitChute and Steemit. These sites are popular with the WS movement, and the right-wing more generally, because of their minimal moderation. They are similar to social media in that they are spaces of active, participatory online discourse, but they are structured differently than social media. Namely, groups typically do not have group-based accounts, and as a result, we could not link our selected groups to BitChute or Steemit posts. Therefore, to collect relevant BitChute and Steemit material, we created a dictionary of terms frequently appearing in the selected groups’ tweets, then used these terms to identify and scrape corresponding BitChute or Steemit content. Putting this step in different terms, the inclusion of BitChute and Steemit observations in our corpus is our attempt to navigate survivorship bias of WS discourse on social media. We can reasonably assume that dimensions of this discourse and groups participating in this discourse were systematically missing from platforms like Twitter because of moderation, so, to mitigate this bias, we collected the additional data from unmoderated sites.
Our data collection yielded 16,776 observations of digital posts containing text and images from January 2013 through July 2019. To be clear, by “text and image” we mean an online, digital expression composed of both a message in text and a picture. Figure 1 offers an example of an observation from our corpus. Table 1 shows the number of observations by platform and time. We understand our corpus as relatively representative of recent WS online discourse in the United States, largely because of our sampling procedure. The representativeness is attenuated by the fact that not all of our sampled groups had active social media accounts, as well as Twitter’s moderation policies. This attenuation is somewhat mitigated by the original sampling procedure being random and the inclusion of WS BitChute or Steemit content. Of course, our discourse of interest is the WS movement’s online discourse, which is made up of the digital material that does in fact exist online, not the content that has been removed.

Example of an observation in the corpus. Observations are online and digital expressions comprising both a message in text and a picture. The observation has been anonymized.
Data across Online Platforms.

Methodological Details
To implement our approach, observations’ text and image content are first split into two kinds of documents: text documents (the text content), which make up a text subcorpus, and image documents (the image content), which compose an image subcorpus. Both kinds of documents remain indexed by their original observations and metadata. That is, while we split each observation’s text and image content into two documents, the pair of documents remains linked through their original observation of an online expression. After creating the two subcorpora, we
measure topics in the text subcorpus,
transform the images documents into text (“image-text”),
measure topics in the image-text subcorpus,
construct a two-mode semantic network graph,
analyze the graph; and
validate the results.
We discuss the first five of these steps in this section. We explain and present the results of the final step, validation, after presenting the main results.
The first step measures topics in the text subcorpus. Since the introduction of latent Dirichlet allocation to infer topics in text (Blei, Ng, and Jordan 2003), social scientists have developed numerous methods for detecting patterns of word usage in unstructured text data, including, for example, conditioning the estimation of topics on document metadata (Roberts, Stewart, and Tingley 2019) and identifying topics from vectorized text (Angelov 2020). Although each method has distinct features, they often draw on the same logic: the way that words tend to appear near one another within documents can shed some light on latent topics or themes constituting both individual documents and the collection of documents. For our approach, any method for measuring topics in text would work, as long as it (1) allows the identification of multiple topics in documents and (2) estimates the degree to which each of these topics are present in a document.
In our own application of the approach, we used structural topic models (STMs). 8 Structural topics models allow the inclusion of covariates when estimating topics’ proportion in documents (Roberts et al. 2019). This capability is important for our study because we aim to analyze the general online WS discourse, and therefore do not want the estimated topics to directly reflect any one attribute of the data or context, such as a particular platform or moment in time. Before fitting the STM, we preprocessed the text data by removing numbers and special characters, removing words with two characters or less and high-frequency English words, converting all characters to lower case, and stemming the words. 9 We then selected a topic solution using a common data-driven technique; the results suggested that 45 topics was ideal (see online supplement, Section A).
The second and third steps call for transmogrifying images into textual topics. There are two reasons for this. First, recording concepts captured in text and images in the same manner—for example, as latent topics inferred from text data, whether originally text or images transformed into text—enables downstream analyses of relations and meaning. Second, doing so makes our approach both relational and accessible to a wider range of social scientists. As mentioned earlier, some recently developed ML classification approaches consider cooccurring text and images (e.g., Wu and Mebane 2021; Yang 2021; Zhang and Pan 2019), but these approaches eventually collapse both modes into one classification, thereby losing information about relations between text and images. Furthermore, these approaches are currently too complex for most social scientists to use. In contrast, the two stages of our approach that convert images into textual topics allow clear, familiar, and interpretable analyses of the relations between modes, and can be implemented using common (and well-documented) off-the-shelf functions for text analysis available with open-source statistical software. Both advantages are made possible by rendering images as text.
To transform our images, we used a publicly available computer vision algorithm (Google Vision; https://cloud.google.com/vision). Researchers adopting our approach could select one of several available computer vision algorithms or build their own (for details, see Joo and Steinert-Threlkeld 2019; Torres and Cantú 2022; Williams et al. 2020), as long as the algorithm assigns labels to the image or objects in the images, uses text to report the detected labels, and records this “image-text” or “image–word lists” at the level of individual images. For example, the algorithm we used outputs a list of words labeling each image, such as smile, chin, and coat, and automatically indexes the words to each image document. 10 Researchers may also consider an algorithm’s (potential) biases when selecting the computer vision algorithm. In our case, the algorithm’s known biases did not register major concern, as our study focuses on kinds of images which are not known to be sensitive to algorithmic biases (Schwemmer et al. 2020). Figure 2 provides an example of computer vision output, including the detected labels reported as text. This text is what we refer to as “image-text.”

Example of a computer vision algorithm generating “image-text” on the basis of the results of labeling. The observation has been anonymized.
After the second step, there is a list of words per image: image-text that can be treated just like text from a “ordinary” text document. In our case, the image documents had image-text with a mean of 9 words and a median of 8 words. In comparison, the text documents in our text subcorpus had a mean and median of 49 and 27 words, respectively. Step 3, the transformation of image-text into textual topics, can be completed using an STM or another text-analysis method to estimate topics in the image subcorpus. 11 When we did this, we again used a data-driven technique to identify an ideal number of topics to model using an STM. The results pointed to a 25-topic solution (see online supplement, Section A). 12
After identifying topics in the text and image subcorpora, each observation—each original online post—is assigned its text content’s distribution of topics and its image content’s distribution of topics. In other words, because the observations of online expressions have both text and image content (see the “Data” section), they will each contain the text topics (with varying prevalence) making up its text portion and each image-text topic (also with varying prevalence) making up its image portion. 13 Through these observations of text and image topics cooccurring with topics of both the same mode and the other mode, we can infer intramode and intermode connections.
In the fourth step, we construct an undirected two-mode semantic graph. In this graph, vertices are topics: one set of vertices, or one mode in a two-mode network, are topics estimated from the textual content; the other set of vertices, or the second mode, are topics estimated from the image-turned-text content. The edges between vertices represent semantic relations.
To identify semantic relations, and define graph edges, we calculated the correlation between topics across observations, a technique used by previous scholarship that inferred relations between topics (e.g., Farrell 2016; Karell and Freedman 2020; Light and Odden 2017). If two text vertices had a Spearman correlation coefficient greater than 0.2, we recorded an edge between them. 14 This created the intratext network layer of our graph. We then repeated the edge encoding for image vertices, creating the intraimage layer. Finally, we calculated the correlations between text and image topics across observations and constructed the cross-mode network layer. 15
Once the two-mode semantic graph is constructed, the fifth stage of our approach is possible: examining the graph using network analysis methods, which can capture how vertices—and thus topics—across the text and image modalities relate to one another. Network science disciplines have developed numerous measures and methodological techniques, and any of these could be applied to the graph (as long as they are appropriate for semantic data and two-mode structures). In our case, we focus on interlayer betweenness centrality, or the extent to which vertices fall on the geodesics, or shortest paths, between other text and image vertices.
16
For each vertex, interlayer betweenness centrality,

which calculates the total number of geodesics,
Knowing vertices’ interlayer betweenness centralities is especially useful for understanding the role of securitization in general WS discourse. The measure of betweenness centrality identifies the extent to which topics (vertices), such as securitization, create, or induce, conceptual linkages between text-based and image-based topics (Bavelas 1948; Cohn and Marriott 1958; Freeman 1977). Such linking is important because previous research suggests that forming conceptual bridges between text and images is a uniquely powerful role in discourse. That is, bridging distinct concepts can result in discursive innovation and novel ideas (Hofstra et al. 2020), and when this bridging occurs across modes, it is connecting text and image, which often convey information and elicit emotions in ways unique to that mode (Joo and Steinert-Threlkeld 2019; Williams et al. 2020). Of course, other measures and analytical techniques might be more appropriate for other research questions, and these are possible to implement with our approach.
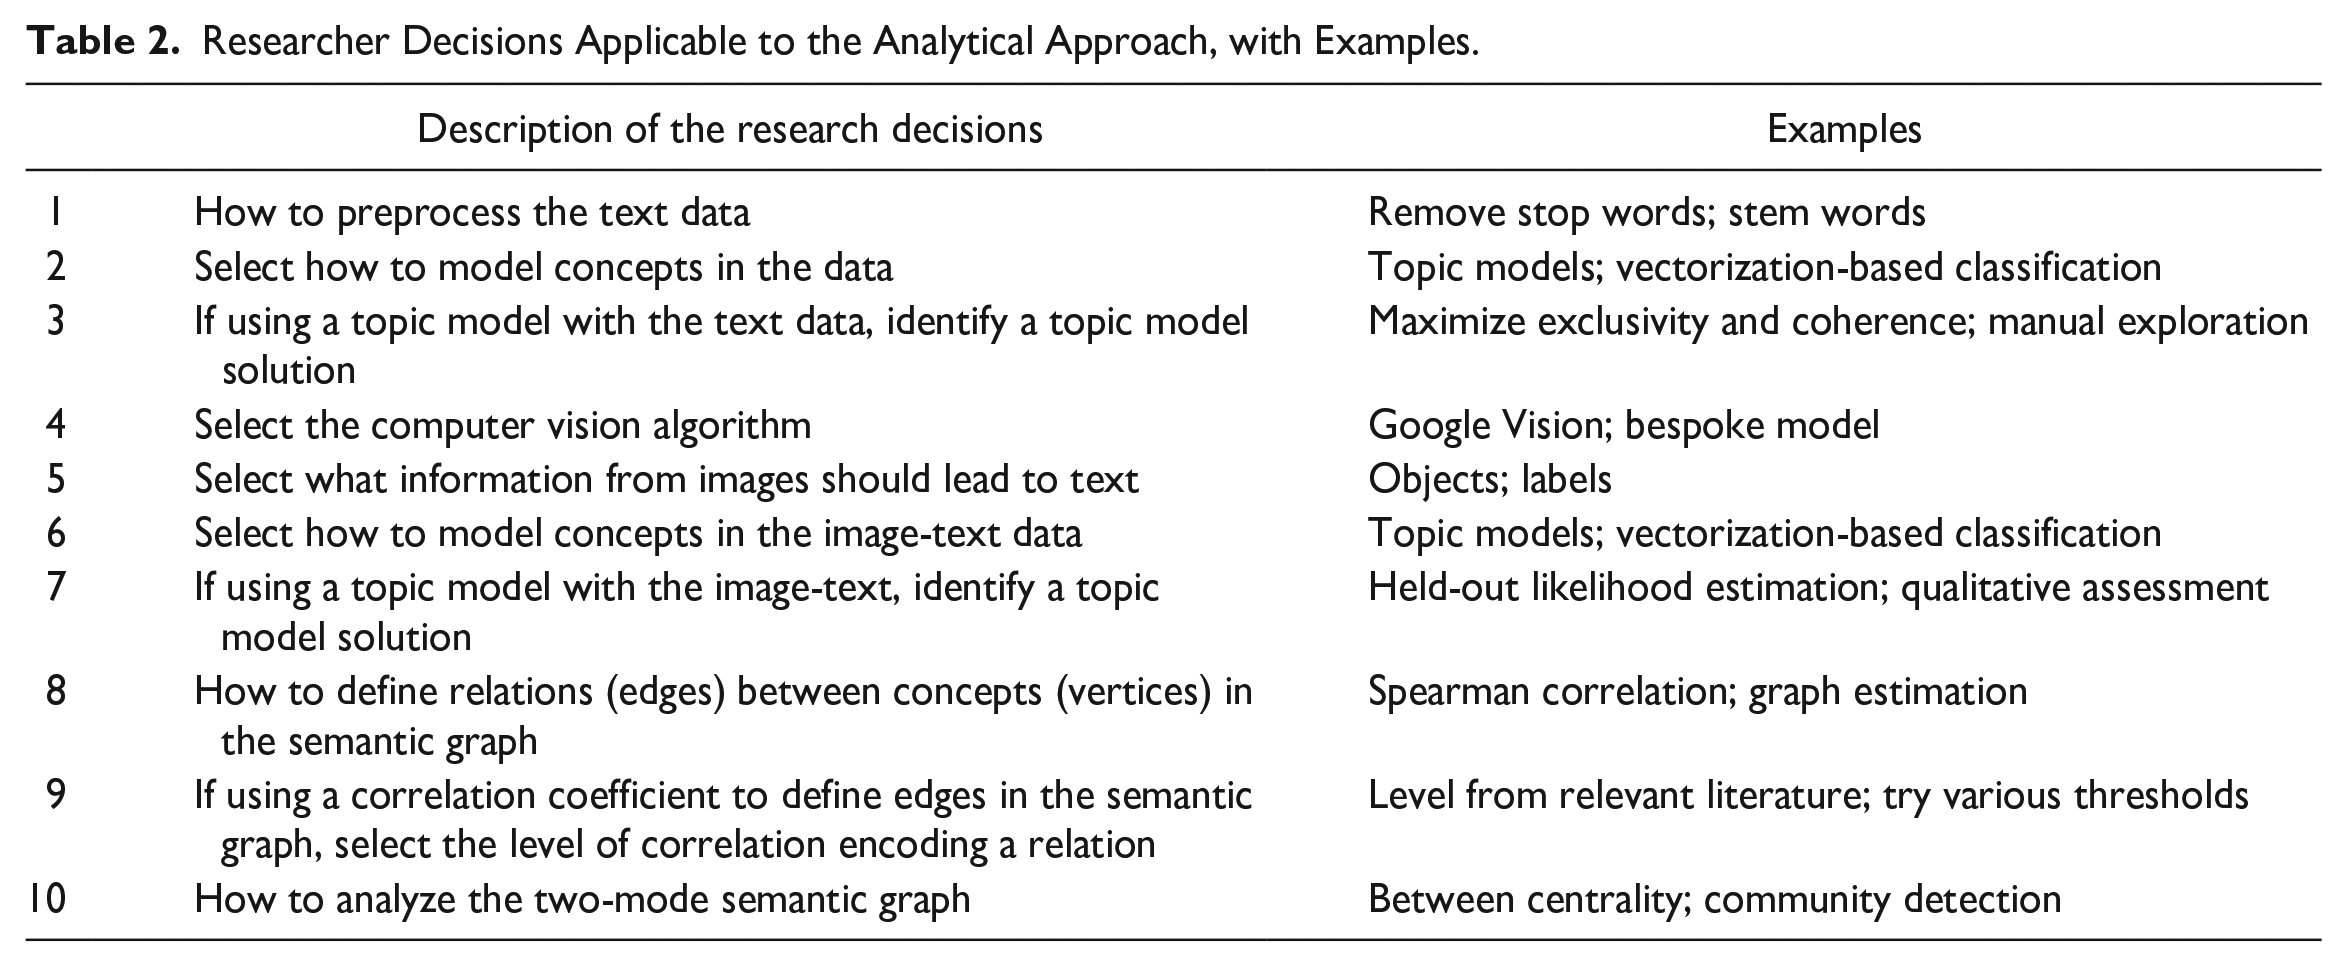
To conclude, we note that we have purposefully designed our approach to be, first, relatively straightforward to understand and interpret and, second, able to be implemented using well-documented and off-the-shelf open-source software (see notes 8, 15, and 16). Nonetheless, the approach requires careful consideration of several researcher decisions, which can lead to erroneous inferences (Simmons, Nelson, and Simonsohn 2011). To increase the transparency of our approach and help mitigate the risk for misleading findings, Table 2 lists the researcher decisions.
Researcher Decisions Applicable to the Analytical Approach, with Examples.
Results
In our empirical illustration, we are interested in whether securitization plays a role in online WS discourse and, if so, how. To answer these questions, we present a series of results. First, we confirm that the concept of securitization appears in online WS discourse, but show that it is not a major component, by volume. Then, we present evidence indicating that securitization plays a uniquely strong connecting role in the discourse. We gain further insight into how it shapes the discourse by examining the ideas securitization connects. Finally, we validate our findings using a human-based test.
The Discursive Prevalence of Securitization
We investigated and interpreted the topics in the WS discourse by reading topics’ most frequent words, most frequent and exclusive (FREX) words, 18 and most strongly associated documents. Table 3 lists three text topics that will be important in the remainder of our analysis, and Table 4 lists nine important image topics, including the “securitization” topic. Section B in the online supplement presents all the 45 text topics and 25 image topics. Both tables include the labels we assigned after interpretation, the estimated proportion of each topic in its respective subcorpus, and each topic’s top FREX words. We see in the complete results that the data do capture a general WS discourse (online supplement, Section B). We find topics associated with the American WS movement, as well as far-right politics in general, such as anti-Semitism, the Ku Klux Klan, and anti-immigration. We also find that the discourse includes more mundane themes, such as electronic gadgets, cryptocurrency, and video games.
Labels, Estimated Proportion, and Top FREX Words of Key Text Topics.

Note: Words have been stemmed. FREX = frequent and exclusive.
Labels, Estimated Proportion, and Top FREX Words of Key Image Topics.
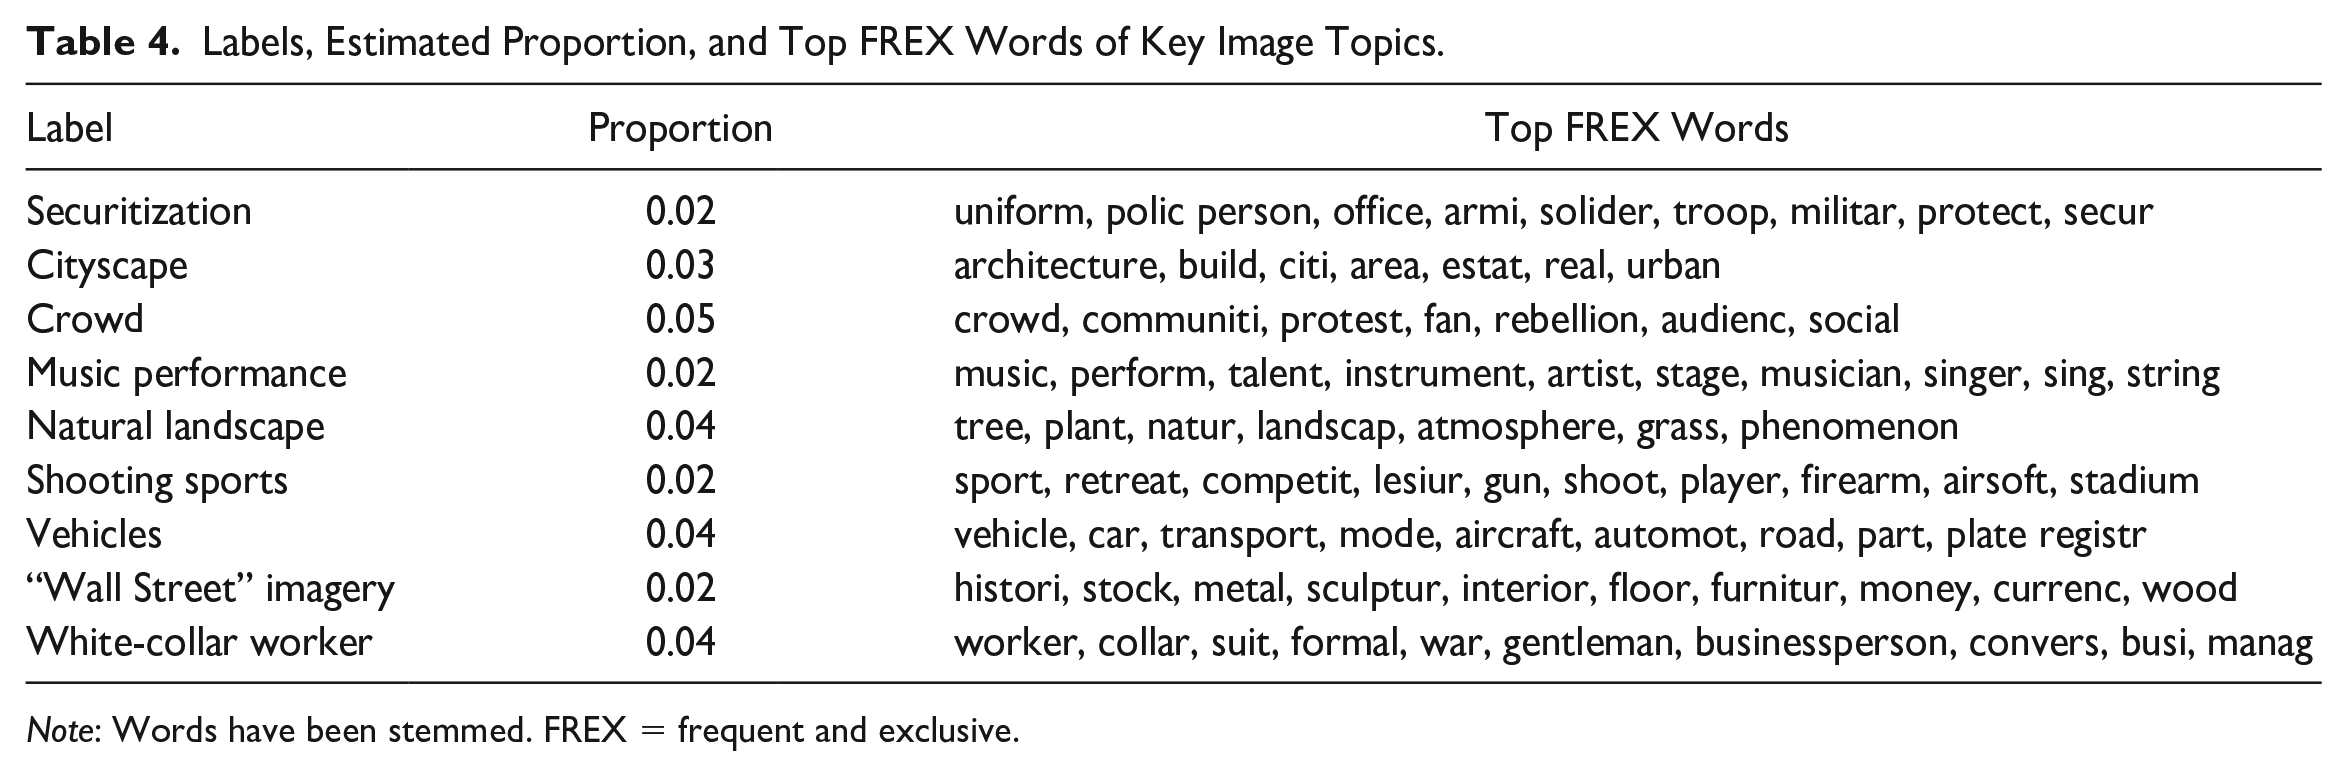
Note: Words have been stemmed. FREX = frequent and exclusive.
We additionally find evidence that securitization is present in the discourse. An image topic, which we label “securitization,” frequently contains words such as police person, solider, troop, protect, and security (Table 4). When we viewed highly associated documents (in this case, images), we saw that many were pictures of police with riot-control equipment and other instances of armed security individuals. Our models estimate that the securitization topic makes up 2 percent of the content. This is less than the mean prevalence of image topics, 4 percent. These results suggest that any discursive importance held by the concept of securitization is not based on volume. Indeed, the following results indicate that the concept’s importance comes from the relational role it plays in the discourse, particularly how it connects topics across text and image modes.
The Discursive Role of Securitization
Figure 3 shows the two-mode graph of topics’ semantic relations. It includes colored fields denoting communities detected by modularity optimization (generalized Louvain) to underscore that common network analysis methods are compatible with our approach (see row 10 in Table 2). 19
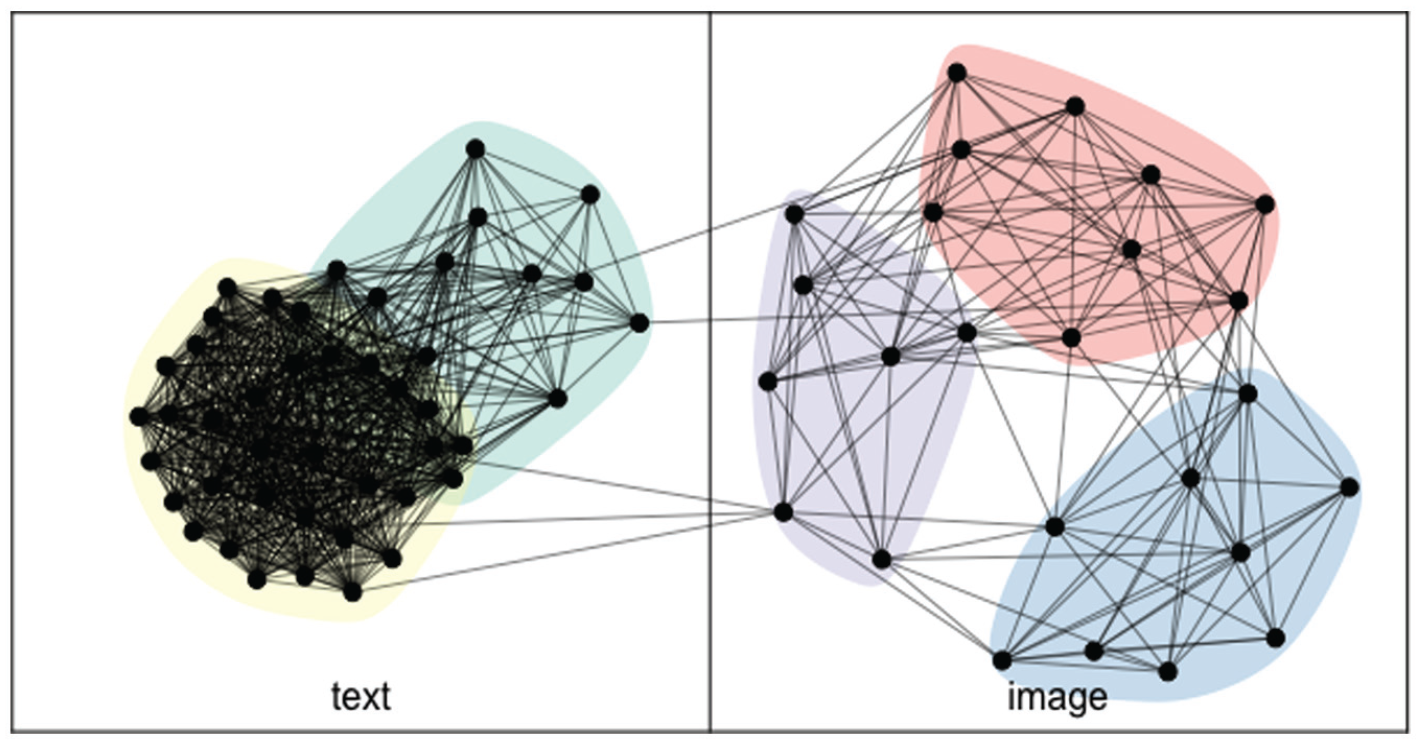
Two-mode semantic graph.
With the graph data structure, we can analyze the relations between topics. As explained earlier, we focus on interlayer, or text-and-image, betweenness centrality. Table 5 presents the topics with the top 10 interlayer betweenness centrality scores, as well as whether the topic appears in text or images. (online supplement, Section B, lists the betweenness centrality scores for all 70 topics.) We see that securitization has the highest betweenness centrality across modes. This indicates that the topic of securitization connects the most text and image topics in the discourse. Put differently, when tracing the shortest semantic relations between concepts represented in text and concepts reflected in images, the highest number pass through the concept of securitization.
The Topics with the Top 10 Interlayer Betweenness Centrality Scores.

The securitization topic is most correlated with the image topics of crowds (r = .64), shooting sports (r = .60), vehicles (r = .48), and cityscapes (r = .45). It is most correlated with the text topics of news media headlines from Nordic countries (r = .25), Trump (r = .22), and cars (r = .21). Table 6 shows the securitization topics’ connected topics. Note that three of the eight associated image topics evoke space and place: “crowd,” “cityscape,” and “natural landscape.” The securitization topic also has second order ties, or relations with yet more topics through its directly connected topics. A straightforward extension of our approach is the analysis of how topics of interest, such as securitization, are connected to broader collections of topics, such as the second-order topics and groups of topics, like the communities shown in Figure 3.
The Text and Image Topics Connected with the Securitization Topic (i.e., Securitization’s “Alter” Vertices).
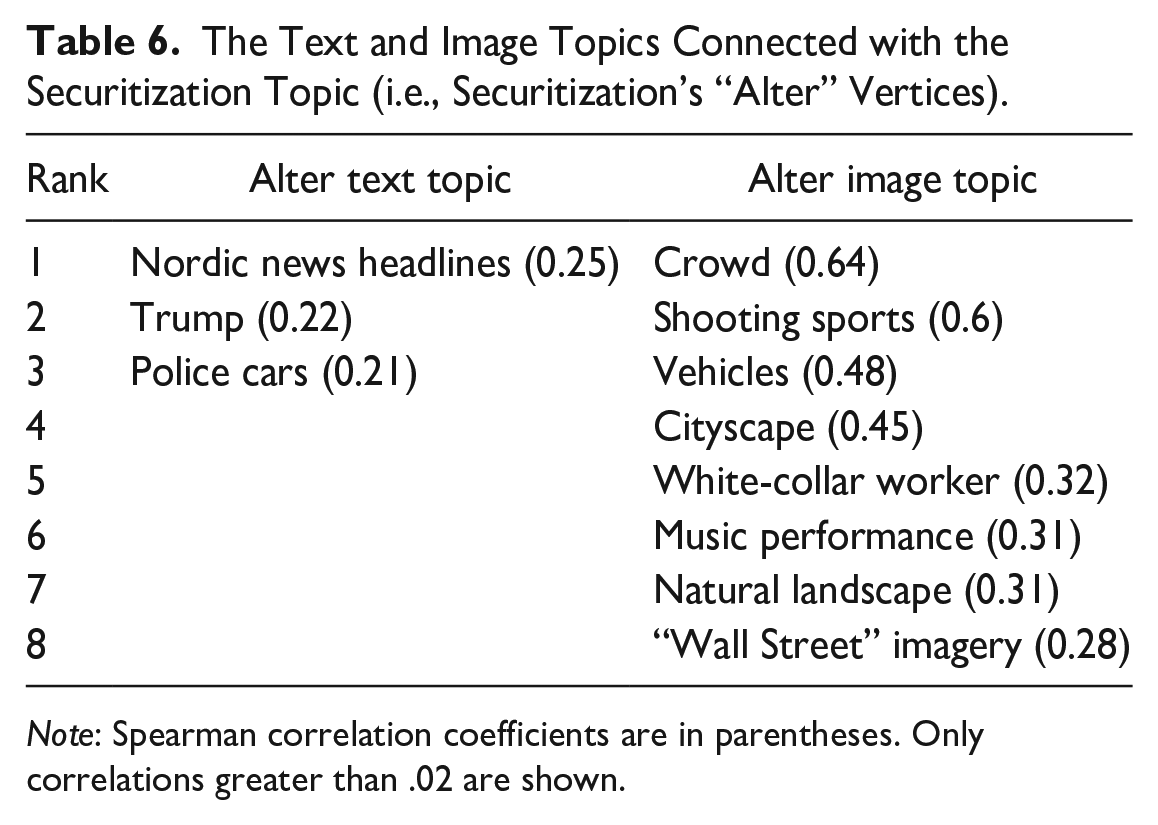
Note: Spearman correlation coefficients are in parentheses. Only correlations greater than .02 are shown.
Validation
Our main results rely in part on the measurement of network vertices’ betweenness centrality. However, despite recent research suggesting that people’s understanding of the world draws on networked associations (Lynn and Bassett 2020), it is not clear whether these centrality scores accurately capture how people perceive discourse. Betweenness centrality, like many other network measures, has mainly been applied to and interpreted in the context of humans’ social networks (e.g., Bavelas 1948; Burt 2000; Cohn and Marriott 1958; Lutter and Weidner 2021; Stovel and Shaw 2012), and even with the common application of network measures to semantic networks, little effort has been devoted to validating whether the metrics made for social networks support sound inferences of semantic networks (Basov et al. 2020). Therefore, in the final stage of our analysis, we validated our interpretation of interlayer betweenness centrality.
As there is no “ground truth” network graph of WS discourse to compare our findings to, we built on previous human-based validations of large-n text analyses (Lowe and Benoit 2013; Nelson et al. 2021; Ying, Montgomery, and Stewart 2022) and developed an exercise centered on a simple test: do our findings correspond with individuals’ own understanding of the target semantic relations? In other words, our validation exercise tasked people with implicitly confirming or refuting the securitization topic’s betweenness centrality score obtained through our approach. The validation results show how people’s interpretations of relations between texts and images strongly associated with securitization mapped onto our network analysis results.
We implemented the validation exercise via Appen, an online crowd sourcing platform. To start, we opened the exercise to English-speaking residents of the United States in Appen’s curated pool of potential annotators. 20 Individuals meeting these criteria who opted into our task first read instructions explaining the task, which included examples of the kinds of text and images they might see. They then had the opportunity to practice by completing a shortened version of the task formatted in the same way as the real task. Those who finished the practice task were able to do the real task. Upon completion, the annotators were paid a small amount of money. In total, 250 annotators performed the validation exercise.
During the validation exercise, annotators were initially presented with two sets of three documents. One set contained text connected to the securitization topic; the other set contained images connected with securitization. To select the documents in these two sets, we first calculated the document-level prevalence of the topics linked with the securitization topics (i.e., the 11 topics listed in Table 6). That is, we summed the prevalence of securitization’s three connected text topics—“Nordic news headlines,” “Trump,” and “police cars”—for each document in the text subcorpus and then repeated this for the prevalence of the eight connected image topics (e.g., “crowd,” “natural landscape”) in the documents in the image subcorpus. Then, we selected the three text documents that had the highest combined prevalence of the (text) topics connected with securitization. These three documents were all favorable written expressions of Trump-related policies and politics. They constituted the set of texts shown to individuals. Next, we selected the three image documents that had the highest combined prevalence of the (image) topics associated with securitization. These images were all of urban and natural landscapes. They formed the image set shown to individuals. We did not tell individuals the topic labels when presenting them with sets of documents (or at any other step of the validation task).
After annotators were shown both sets of documents, they were asked to conceptualize what each set represented as a whole, such as a concept of “urban and natural places.” Then, we showed individuals a series of 10 images: the three images with the highest prevalence of the securitization topic and seven images with a high prevalence of randomly selected topics with very low interlayer betweenness centrality scores. These latter images can be thought of as placebos. The securitization and placebo images were shown in a randomized order.
After displaying each image, we asked individuals whether the displayed image linked the two concepts they had earlier formed by considering the Trump texts and landscape images. 21 If our semantic network analysis of WS discourse accurately captured how people tend to understand topics and their semantic relations, then the participants should have selected the securitization images as bridging the two concepts and not have selected the placebo images. Section C in the online supplement shows the exercise’s instructions and example task.
Figure 4 presents the results of the validation exercise. The bars indicate the number of annotators who reported that the displayed securitization (or placebo) image linked (or did not link) the two concepts they had formulated based the Trump texts and landscape images. The panel on the left shows the annotators’ response totals when they saw a securitization image (i.e., high-betweenness images). The panel on the right shows the response totals when annotators saw the placebo, or nonsecuritization, images (i.e., low-betweenness images). About 75 percent of annotators labeled each of the three securitization images as linking the concepts. In contrast, between approximately 25 percent and 50 percent of annotators said each placebo image linked the concepts. When aggregating and weighting the results by annotator agreement and quality, we obtain similar outcomes (online supplement, Section D).
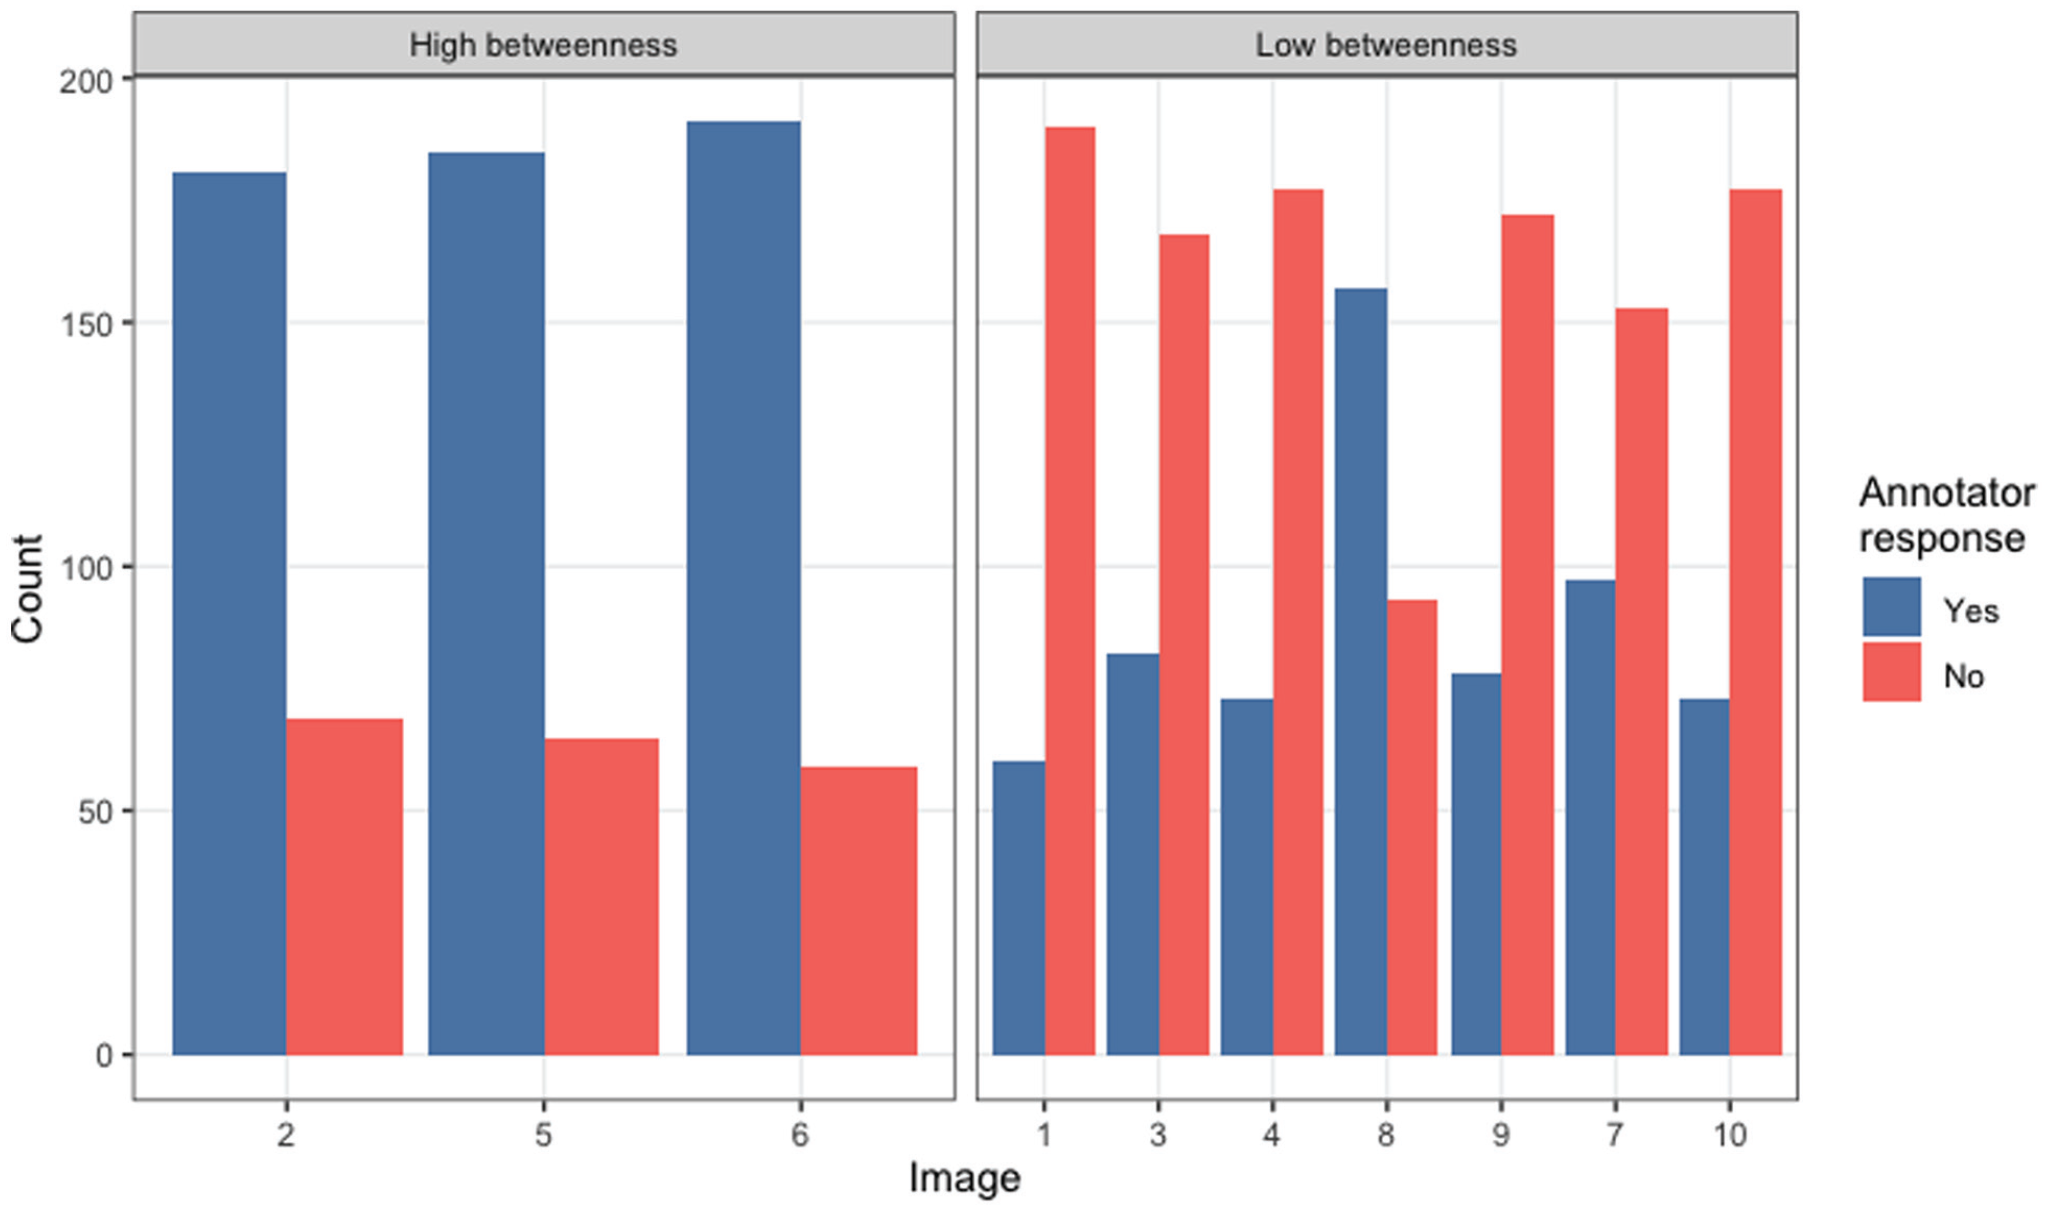
Results of the validation exercise. The left panel shows the annotators’ responses when shown securitization images (i.e., high-betweenness images); the right panel shows the annotators’ responses when shown nonsecuritization images (i.e., low-betweenness images). The images are numbered in a randomized order in which they were shown to annotators.
The results of our validation exercise indicate that our analysis of topics in multimodal WS digital media—including our measurement of betweenness centrality—accurately captures how people understand the relational meaning of securitization in our discourse. A sizable majority of annotators identified high-betweenness images as connecting the documents that our analysis suggested should be connected. A majority also identified low-betweenness images as not connecting the documents that should not have been connected. These results instill confidence in our analytical inferences.
Discussion and Conclusion
This article expands the social science toolkit for analyzing discourses captured in multimodal digital data, such as social media posts containing both text and images. With its validation test, the article also provides suggestive evidence that other research applying SNA measures to semantic networks may be accurately capturing how people understand discourse. Yet, there are of course limitations to the current iteration of the analytical approach we lay out. One limitation is the difficulty of incorporating into the network analyses the uncertainty associated with the measurement of topics (Knox et al. 2022; Lowe and Benoit 2013). In addition, there are potential biases in the algorithms translating images into texts. As discussed earlier, we acknowledge this potential source of bias, but it probably plays a minimal role in our particular analysis because we focus on kinds of images unlikely to be sensitive to recently uncovered algorithmic biases (Schwemmer et al. 2020). These limitations notwithstanding, we believe our approach can make the analysis and interpretation of text and image data more accessible to a wide range of social science researchers.
The analytical approach can be modified and developed in numerous ways. One modification would be to pool the text and image documents—recall that these are observations’ text and (textually transformed) image portions—into one corpus instead of two subcorpora, and then analyze the one corpus. This modification would likely be appropriate when the text and images have significant overlapping content and/or the researcher is less interested in the particularities of each mode. Analyzing the text and image documents separately and then finding their connections, as in our empirical illustration, helps detect topics unique to and similar across each mode. This distinction between modes may be especially useful when studying fringe or marginalized groups who may use one mode in a special way, such as subversively humorous images (Jarvis and Eddington 2021b). Preserving the intermodal distinction could also be useful for understanding the dynamics of seemingly irrational and paradoxical discourse by identifying relevant context, such as how antiracists might use images to mock racists, thereby clarifying the intent of (hypothetical) sarcastic text that may initially appear to inexplicably condone them (see Jarvis and Eddington 2021a).
To develop our approach, the text and image data could be linked with information on social actors, such as the authors of the documents, to examine the interaction between cultural and social domains (e.g., Karell and Freedman 2020). In addition, a temporal dimension could be added, perhaps using documents’ time of publication, to model semantic change over time. Also, the textual content and relations could be measured using techniques other than STMs, such as word embeddings (see Stoltz and Taylor 2021). Finally, we encourage scholars using semantic network approaches to build on our validation exercise, as different research questions, data, and analytical methods might call for different assessments of validity.
This article’s empirical analysis demonstrates the kinds of insights our approach makes possible. For the case of WS and the concept of securitization, the results suggest that securitization stands out in online WS discourse not through the amount of text and images dedicated to it, but rather by how it links other concepts across modes of expression. What might be the consequences of the securitization topic discursively connecting a topic about physical spaces and a topic about a right-wing populist leader? After all, connecting two distinct concepts can lead to discursive innovation and novel ideas (Hofstra et al. 2020). We use these final paragraphs to reflect briefly on what it might mean for securitization to connect the specific topics that is does.
Previous scholarship has argued that the rise of the WS movement, and the broader right-wing, is a political phenomenon deeply rooted in a sense of geographical space (Fitzgerald 2018; Hochschild 2018; Olivas Osuna et al. 2021; Wuthnow 2019). Of course, notions of place and spatial boundaries are nothing new to politics in general and electoral politics in particular (Lipset and Rokkan 1967; Rodden 2019). Yet the spatial specificity of WS and right-wing radicalism has ignited renewed interest in the role of place-based identities, understood as “sense of belonging to a group whose membership is defined by living in a particular place and having a psychological attachment of group-based perception with other group members” (Munis 2022:3). For instance, Cramer (2016) emphasized the importance of rural consciousness among the American right.
Our findings extend this insight that place matters deeply for right-wing discourse by showing that notions of place arise even among WS online communities, which are often physically detached from geographic locations and can involve individuals situated in any place. On the basis of the results, we suspect that place-based identities will continue to be an important component of WS and right-wing groups even as their members spend increasing amount of time online.
Scholarship on the political right has additionally found that personalistic leadership is important to right-wing populist movements (as it also is for populist left-wing movements). Its importance lies in the ability of strong leaders to promise the capability of carrying out the will of “the real people,” a key goal of populist movements (Weyland 2021). Our results add to this insight by suggesting a link between personalistic leadership and place-based imagery in contemporary American WS discourse—a link formed by securitization. This triptych of leadership-securitization-place could support calls for movement leaders to condone and protect place-based identities from perceived outside groups (e.g., immigrants, refugees, members of other ethnic groups) and influences (e.g., norms and ideas associated with other geographic parts of the country) (see Fitzgerald 2018). Yet, to be clear, these interpretations are early formulations based on our results. Further research is needed to better understand the ideologies and justifications emerging from linkages between securitization, personalistic leadership, and space and place.
Supplemental Material
sj-docx-1-srd-10.1177_23780231231161049 – Supplemental material for Analyzing Text and Images in Digital Communication: The Case of Securitization in American White Supremacist Online Discourse
Supplemental material, sj-docx-1-srd-10.1177_23780231231161049 for Analyzing Text and Images in Digital Communication: The Case of Securitization in American White Supremacist Online Discourse by Daniel Karell, Michael Freedman and Noam Gidron in Socius
Footnotes
Acknowledgements
We thank Jakob Boros for research assistance. We also thank Tamar Mitts, Yuan Hsiao, and the participants in the International Conference for Method Triangulation (Academia Sinica) for helpful comments and advice.
Supplemental material
Supplemental material for this article is available online.
1
We provide only a brief review of the scholarship here. For more thorough reviews, see Williams et al. (2020) and ![]() .
.
2
Explaining current ML techniques for analyzing images is outside the scope of this paper. For readers interested in details of the social science state-of-the-art methods, we recommend Torres (2018), Joo and Steinert-Threlkeld (2019), Zhang and Pan (2019), Williams et al. (2020), and ![]() .
.
3
4
5
![]() offered a simulation-based validation, which surpasses most semantic network studies we are aware of. Although this kind of validation is valuable, we see human-based validation as also important, as semantic network scholars typically use their results to make inferences about what people think, understand, and perceive.
offered a simulation-based validation, which surpasses most semantic network studies we are aware of. Although this kind of validation is valuable, we see human-based validation as also important, as semantic network scholars typically use their results to make inferences about what people think, understand, and perceive.
6
The size of the sample was limited by the available financial resources.
7
8
To implement, we used the R package stm (version 1.3.6).
9
We removed words in the Snowball stoplist and stemmed words using wordStem, which is based on the C libstemmer library generated by Snowball.
10
The algorithm also measures other characteristics of the images, such as the locations of specific objects within the image frame (with the location given as coordinates). We do not use this additional information, but we provide it with our public data set to facilitate future research. See note 7.
11
The image-text (i.e., output of a computer vision algorithm) may include only a single word per object in the image. For example, it may include car but not car and vehicle. As a result, any detected topics would be based on the cooccurrence of words reflecting different objects (e.g., car, steering wheel, and person, suggesting a “driving” topic) rather than on the cooccurrence of synonyms (e.g., car, pickup truck, and vehicle, suggesting an “automobile” topic).
12
We do not preprocess the image-text (as we did with the text data), because the image-text comprises words arranged as a list.
13
To add further clarity, the dataset we constructed after the first three stages is an m-by-n matrix, where each row is an observation of a digital expression (m = 16,776) and each column (n) contains the estimated prevalence of each text and each image-text topic. There are 70 of these columns because we used topic solutions of 45 and 25 for the text and image STMs, respectively.
14
We replicated the analysis using lower thresholds, and the main results remained largely unchanged. Researchers adopting our approach will likely be guided by their own research question when selecting an appropriate threshold.
15
We built the graph using the R package multinet (version 4.0).
16
We measured betweenness centrality using the R package igraph (version 1.2.6).
17
The definition of the igraph function is provided at https://igraph.org/r/doc/betweenness.html; see also ![]() :37).
:37).
18
19
Communities were detected using R package multinet (version 4.0).
20
Appen shares few details of the annotators to protect their anonymity. The information available after we concluded the exercise indicated that all annotators did report English as their primary language and that they all resided in the United States. The states with the most annotators were New York (n = 34), Virginia (n = 31), and Illinois (n = 29).
21
We additionally asked individuals to offer an open-ended brief explanation of their choice, but most of these responses were too brief or vague to analyze meaningfully.
Author Biographies
References
Supplementary Material
Please find the following supplemental material available below.
For Open Access articles published under a Creative Commons License, all supplemental material carries the same license as the article it is associated with.
For non-Open Access articles published, all supplemental material carries a non-exclusive license, and permission requests for re-use of supplemental material or any part of supplemental material shall be sent directly to the copyright owner as specified in the copyright notice associated with the article.