
Abstract
The temporary monthly child tax credit implemented in 2021 had the potential to affect many aspects of child and family well-being, including poverty, hardship, use of food pantries, spending on child-related items, and parents’ mental health and employment. The authors assess these effects using data from two longitudinal studies of well-being in New York City. They find that the monthly child tax credit led to significant declines in the risk for facing material hardship, multiple hardships, running out of money, and using food pantries. The authors do not find evidence of significant changes in parents’ mental health, employment, or spending on childcare or enrichment activities.
Higher incomes are associated with better outcomes for children across multiple domains of development and well-being (Brooks-Gunn and Duncan 1997; Chaudry and Wimer 2016; Cooper and Stewart 2017). Adults with higher incomes also have better health and well-being (Adler et al. 1994; Evans and Garthwaite 2014; Lynch and Kaplan 1997; Shields-Zeeman et al. 2021; Wolfe et al. 2012). A growing literature seeks to answer an important question: are these associations between income and child and family well-being causal? The answer sheds light on the additional benefits of policies that raise family income. Most studies examining the causal links between income and child and family well-being use “natural experiments” that rely on quasi-random variations in income to predict changes in child and family outcomes. They show that increases in income and reductions in poverty lead to improvements across of host outcomes related to children’s development and well-being (e.g., Aizer et al. 2016; Akee et al. 2010; Duncan, Morris, and Rodrigues 2011; Hoynes, Miller, and Simon 2015; Milligan and Stabile 2011; see Garfinkel et al. 2022 and Wimer and Wolf 2020 for a review). In this study, we add to this literature by examining how the changes in family income due to the expansion and monthly delivery of the federal child tax credit (CTC) in 2021 affected several outcomes linked to child and family well-being. Specifically, we look at family’s experiences of material hardship and use of emergency food assistance, as well as parent’s spending on child-related goods and services, mental health, and employment.
The 2021 expansion of the CTC under the American Rescue Plan (ARP) increased credit amounts, removed the earnings requirement, and delivered the credit in monthly installments of $250 or $300 per child (depending on age) to most families between July and December 2021. This reform led to substantial income gains for families across the country, but they were largest for low-income families that were previously ineligible for the full CTC. The expansion also followed nearly two decades of advocacy and research that highlighted the coverage gaps left by the CTC and the potential for CTC expansions to both reduce child poverty and improve child well-being (Acs and Werner 2021; Center on Poverty and Social Policy 2021; Collyer, Harris, and Wimer 2019; Curran and Collyer 2020; Garfinkel et al. 2016; Marr, Cox, and Sherman 2021; Parolin et al. 2021; Shaefer et al. 2018).
The monthly CTC payments moved millions of children out of poverty (Creamer et al. 2022; Parolin, Collyer, et al. 2021). As a result, the payments could have also affected experiences in other domains that we explore in this analysis. We assess the short-term effect of the monthly CTC payments in 2021 on each of these domains using data from the Poverty Tracker (PT) and the Early Childhood Poverty Tracker (ECPT), two longitudinal studies of poverty and well-being in New York City. We take advantage of the detailed longitudinal data in the PT and ECPT to estimate the effects of the monthly CTC payments on these outcomes using a difference-in-differences framework. New York City is of particular relevance because it is home to the largest population of children in the country (roughly 1.8 million), and it is a high-cost city with high levels of income inequality and a demographically diverse population. There are areas of city where more than half of children were previously ineligible for the full CTC (Collyer 2019) and thus benefited substantially for the expansion we examine here.
Background
The Expanded CTC
The ARP temporarily transformed the CTC into a nearly universal child allowance for 2021 through three fundamental changes. The law (1) expanded eligibility, (2) increased the maximum credit amount, and (3) allowed the credit to be delivered in monthly installments for the second half of 2021. Prior to this temporary expansion, tax filers could receive a maximum CTC of $2,000 per child at tax time. However, the credit was not fully refundable. Instead, it phased in with earnings, and tax filers claiming dependent children needed to earn a certain amount in order to qualify for the maximum credit. Overall, one in three children did not receive the full benefit because their families did not earn enough to qualify. Children with single parents, Black and Latino children, and those in larger families were disproportionately ineligible for the full credit (Collyer et al. 2019; Curran and Collyer 2020; Goldin and Michelmore 2022). Children in areas where incomes were lower and poverty rates were higher were also more likely to be ineligible for the full tax credit. More than 50 percent of children in certain areas of New York City were ineligible for the full credit (Collyer 2019).
The ARP expanded CTC eligibility to the overwhelming majority of children in the United States (including those in families with the lowest incomes who were previously excluded) by removing the earnings requirement and making the credit fully refundable. It also raised the maximum annual credit values to $3,000 for children ages 6 to 17 and to $3,600 for children younger than 6. Beginning in mid-July 2021 and through mid-December 2021, the credit was delivered in monthly installments of up to $250 per older child or up to $300 per younger child for a period of six months.
It is important to note that although the ARP expanded eligibility for the CTC, monthly payments did not reach all eligible families. Families that did not file taxes in the prior year (2020), presumably because they had incomes below the tax-filing threshold, generally needed to register with the Internal Revenue Service (IRS) in order to receive their monthly credit. Several estimates suggest that the total number of children in eligible tax units was between 64 million and 67 million children (Cox et al. 2021; Parolin, Collyer, et al. 2021), and the IRS distributed CTC payments to more than the 60.9 million children in August 2021 and to 61.2 million children in December 2021 (Parolin, Collyer, and Curran 2022).
Income, Family Well-Being, and Our Outcomes of Focus
In this study we focus on the possible effects of the income gains from the monthly CTC on factors associated with child and family well-being in the months that payments were made. The outcomes we consider include various forms of material hardship, use of emergency food assistance, spending on child-related items, parents’ mental health, and parents’ employment. Here, we briefly review the prior literature on the associations between income and these outcomes, with a particular focus on studies of public programs that increase income.
Material Hardship
Researchers have consistently found that experiences of hardship are associated with children’s health (Frank et al. 2010; Yoo, Slack, and Holl 2009), internalizing and externalizing behaviors (Zilanawala and Pilkauskas 2012), and maternal depression (Heflin and Iceland 2009). Altogether, this evidence suggests that policies which reduce material hardship could contribute to broader improvements in child and family well-being. A robust literature also documents the negative association between income and material hardship (see Thomas 2022 for a review), with the acknowledgment that there are other determinants of material well-being in addition to income (Mayer and Jencks 1989; Sullivan et al. 2008). Most studies examining the links between income transfers and hardship focus on food hardship, insufficiency, or insecurity, with many exploring the effect of Supplemental Nutrition Assistance Program (SNAP) benefits on these outcomes (DePolt, Moffitt, and Ribar 2009; Gundersen and Kreider 2008; Mykerezi and Mills 2010; Ratcliffe, McKernan, and Zhang 2011). For example, Ratcliffe et al. (2011) took advantage of variation in state-level SNAP policies between the late 1990s and 2005 to estimate the causal effects of these benefits, finding that receipt of SNAP reduces the likelihood of food insecurity by roughly 30 percent.
There is a small but growing body of studies examining the impact of cash transfers on food insecurity (Schmidt, Shore-Sheppard, and Watson 2016; Shaefer et al. 2019). Most relevant to our present study, Parolin, Ananat, et al. (2021) found that the monthly CTC of 2021 led to a 7.5 percentage point reduction in food insufficiency among low-income families with children (from 27.6 percent before the rollout of the payments). They used weekly data collected through the U.S. Census Bureau’s Household Pulse Survey. Shafer et al. (2022) found similarly substantial reductions in food insufficiency among households with children associated with the rollout of the monthly CTC payments.
In the present study, we examine the effect of CTC payments on several forms of hardship in addition to food hardship. These include housing hardship, unmet medical need, utilities hardship, and running out of money. Compared with studies examining income increases and food hardship, there are fewer examining how changes in income affect these other forms of hardship. As noted in Kondratjeva et al. (2021), expanding household well-being indicators to include specific household experiences of hardship allows a more comprehensive picture of families’ financial situations. Examples of studies examining the effects of income on hardships other than food hardship include Pilkauskas and Michelmore (2019), who found that a $1,000 increase in the Earned Income Tax Credit (EITC) reduced housing hardship (e.g., moderate or severe housing cost burdens and doubling up), and McKernan, Ratcliffe, and Iceland (2018), who examined the effects of SNAP, Temporary Assistance for Needy Families, and public health insurance on aggregate hardship measures and found that participation in these programs reduces the total number of hardships that low-income families face by 48 percent. In a more recent study, Pilkauskas et al. (2022) examined the effects of the monthly CTC payments on a sample of families with very low incomes and found that the payments reduced the number of hardships faced and their levels of food insecurity. However, to date there are no studies examining the impact of the monthly CTC on a comprehensive set of hardships nor on any aggregate hardship indicators (e.g., experiencing multiple forms of hardship) in a representative sample.
Use of Food Pantries
Income constraints can lead families to turn to emergency social services, such as food pantries, for assistance. Although food pantries provide families with necessary food during a time of emergency, a systematic review of nutritional studies focused on pantry users showed that their diets were inadequate in calories, diversity of food groups, and consumption of macro- and micronutrients (Simmet et al. 2017). Inadequate diet in childhood has also been linked to long-run health problems (Hoynes, Schanzenbach, and Almond 2016) and lower educational attainment (McIntyre, Kwok, and Patten 2018), suggesting that child well-being is improved when families do not need to rely on food from emergency food providers.
Although several studies have examined the impact of income transfers on food hardship or insecurity, far fewer examine the relationship between income and use of emergency food assistance or how income changes affect use of these services. However, studies have examined how the number of visitors to food pantries falls off around the time that SNAP benefits are delivered (Byrne and Just 2021; Fan et al. 2021), with one study (Mabli and Worthington 2014) estimating a 5.7 percentage point reduction in food pantry use. These studies suggest that receipt of income transfers through SNAP may reduce need for emergency food assistance, though to our knowledge, studies to date have not examined changes in pantry use associated with cash-based transfers or with the monthly CTC.
Psychological Distress
Given the range of poverty- and hardship-related outcomes that the CTC expansion could affect, we anticipate that the policy could also improve parents’ mental health. We specifically examine psychological distress, a challenging emotional state that negatively affects an individual’s ability to cope with their circumstances and that presents a significant burden to the health, well-being, and life outcomes of those experiencing it and their families (Fryers, Melzer, and Jenkins 2003; Gadalla 2009; Gershoff et al. 2007; Mistry et al. 2007). Among the potential risk factors for psychological distress, socioeconomic conditions, particularly low incomes, are consistently associated with higher distress (Fryers et al. 2003). Parents living in poverty can experience a host of challenges to their well-being, including economic uncertainty, environmental stressors, and other poverty-related hardships, all of which contribute to psychological distress (Radey and McWey 2021; Ridley et al. 2020; Santiago, Kaltman, and Miranda 2013; Taylor and Conger 2017). Indeed, research has shown that poverty-related hardships such as problems paying bills and having household utilities shut off may mediate (i.e., partially explain) the relationship between poverty and mental health problems (Heflin and Iceland 2009).
An emerging body of research has begun to demonstrate the positive mental health benefits of antipoverty programs such as cash transfers and expanded tax credits (Boyd-Swan et al. 2016; Collin et al. 2021; Courtin et al. 2021; Evans and Garthwaite 2014; Gangopadhyaya et al. 2020; Milligan and Stabile 2011; Morgan et al. 2020; Qian and Wehby 2021; Schmidt, Shore-Sheppard, and Watson 2021). Studies that have examined the EITC have shown that refundable state EITC programs are associated with short-term improvements in low-income mothers’ overall health, including physical and mental health, over and above nonrefundable EITC programs (Qian and Wehby 2021). We add to this literature by exploring the effects of the monthly CTC payments on psychological distress.
Parental Employment
The majority of family income comes from employment, and the benefits associated with income described above are likely generalizable to income from earnings. Some researchers have raised concerns that income transfers such as the expanded CTC could reduce employment incentives and lead to lower rates of parental employment (Corinth et al. 2021). However, a recent study of the Canada Child Benefit did not find that the benefit affected parental employment (Baker, Messacar, and Stabile 2021), and recent studies of the expanded CTC revealed no evidence of an employment response in the months the credit was delivered (Ananat et al. 2022; Lourie et al. 2022; Roll, Hamilton, and Chun 2021). We add to this evidence base by examining the impact of the monthly CTC on parental employment in New York City.
Spending on Child-Related Items and Services
In addition to reducing material hardships or need for emergency food assistance, increases in income due to the CTC could lead families to be able to invest more in child-related services and items, such as childcare, enrichment activities, books, toys, and children’s clothing (Amorim 2021; Gregg, Waldfogel, and Washbrook 2006; Jones, Milligan, and Stabile 2019). Gregg et al. (2006) exploited changes in family income resulting from child benefit reforms in the United Kingdom between 1995 and 2003 and found that increases in income for families with children led to increases in spending on children’s clothing, books and toys. Similarly, Jones et al. (2019) examined how household expenditure patterns were affected by the Canada Child Benefit, finding that the Canadian program increased spending on basic needs such as transportation, childcare, and food at home, and decreased expenditures on food in restaurants. In the U.S. context, Amorim (2021) examined the effects of income gains from cash transfers distributed from the Alaska Permanent Fund Dividend on child-related spending by exploiting exogenous variation in the values of the payment across time. The study revealed that immediately after receiving cash transfers, parents across the income distribution increase spending on clothing and durable goods that may improve children’s material well-being.
These studies thus suggest that the CTC payments could lead to greater spending on child-related goods and services. Several studies have reported on how people receiving the monthly CTC payments reported spending it (Karpman et al. 2021; Pilkauskas and Cooney 2021; RAPID-EC 2021; Roll, Chun, et al. 2021; Zippel 2021), but they have not examined changes in spending patterns resulting from the CTC using a causal identification strategy. However, a recent study by Lourie et al. (2022) showed an overall increase in total consumption as a result of the CTC, particularly on groceries, education-related spending, and health care, with stronger effects for families with more children or with lower incomes. In this study, we build upon these analyses by examining the effect of the CTC on parents’ spending on childcare, children’s enrichment activities, and children’s books, clothes, and toys.
Data and Methods
Data
We use two longitudinal data sets to investigate the effects of the expanded CTC on several indicators of well-being: The PT and the ECPT. Launched in 2012, the PT surveys a representative sample of New Yorkers every three months for up to four years, providing critical information on the dynamics of poverty, hardship, and well-being in the United States’ largest city. In addition to measures of poverty and hardship, the PT collects a wealth of information on topics such as employment, assets and debts, and health. The majority of the PT subjects were recruited through random-digit dialing (RDD), and additional methods have been used to enroll hard-to-reach groups in the panel. Since 2012, the study has recruited four cohorts, and those recruited in 2015, 2017, and 2020 are still active members of the panel. See Appendix A for additional information on the PT.
Launched in 2017, the ECPT, a parallel study to the PT, is a longitudinal study of families in New York City with young children. The study uses repeated surveys to explore the impact of family resources and poverty on children’s short- and long-term developmental outcomes. In 2017, the ECPT recruited a representative sample of 1,576 New York City families with at least one child younger than 3 years, and it currently has an active panel of roughly 1,100 families with children. The majority of the ECPT sample was drawn from the Department of Health and Mental Hygiene 2017 Child Health Survey, which was a large survey of children younger than 13 in New York City. See Appendix A for additional information on the ECPT. Surveys in both the PT and ECPT are completed by phone or online, depending on the subject’s preference.
The PT and ECPT are well-suited to study the effect of the CTC on New York City families with children for several reasons: (1) surveys fielded prior to and following the first CTC payment included questions on our focal outcomes; (2) in this period, the studies’ active panels included more than 3,000 subjects and survey response rates were high; (3) the sample composition remained similar before and after the payments were made; and (4) the composition largely reflected that of the New York City population.
All PT surveys fielded between May 5 and December 31, 2021, included questions on our primary domains of interest: experiences of material hardship, use of emergency food assistance providers (such as food pantries), and parents’ spending on child-related goods and services, their psychological distress, and their employment. The ECPT surveys fielded in this period also included the same questions on spending, psychological distress, and employment. We refer to the set questions covering all of these focal outcomes collectively as the “CTC module.”
There were 9,758 PT and ECPT surveys fielded between May 5 and December 31, 2021 (all including the CTC module), and 7,001 (72 percent) of respondents completed the module before December 31 (Table 1) (though this is higher when including surveys completed after this date). More than 40 percent of the respondents who completed the surveys during this period were parents of resident children (Table 1). Of these surveys, 3,554 subjects completed a survey before July 15, 2021, and 3,447 completed it after. The relatively small reduction in sample size in the post-CTC rollout period versus the pre-CTC rollout period (3,554 vs. 3,447) is because some respondents did not complete the survey or completed the survey after December 31, 2021. Despite this difference, there is a high degree of comparability across several demographic characteristics between the pre-and post-July 15 samples. Table B1 in Appendix B presents the demographic composition of the sample that completed the CTC module before and after July 15, showing no significant changes in the composition between the periods. 1
Sample Sizes Overall and by Cohort.

The sample that completed the CTC module also largely reflects the composition of the city’s population. Table B2 in Appendix B shows the composition of the city’s population (on the basis of the 2017–2019 sample from the American Community Survey) alongside that of the combined PT and ECPT samples that completed the CTC module. The result show comparability between our study samples and the city’s population in terms of racial and ethnic composition, age, and marital status. Women are overrepresented in the combined PT and ECPT sample, but this makes sense as being the primary caretaker for a young child was requisite for participation in ECPT. New Yorkers born outside the United States are also somewhat underrepresented in the combined PT and ECPT samples, as are those with a high school degree or less, with the former possibly explaining the latter. In terms of poverty status, New Yorkers living in poverty (measured using the official poverty measure) are also overrepresented in the combined PT and ECPT panels, but we note that we are comparing to American Community Survey data collected before the pandemic which could be driving some of these differences. By and large, the PT and ECPT alignment with the city’s composition across several key demographics underscores the quality of the data.
Overall, the sample that completed the CTC module was comparable with the city’s population, there was a good response rate to the surveys featuring the CTC module, and the samples that completed these surveys were balanced between the period when CTC payments were made and prior. Combined, these results show how the PT and ECPT data are fitting for examining the effects of the monthly CTC payments.
Outcome Measures
We use the PT and ECPT surveys to evaluate the effect of the monthly CTC on several different outcomes, described in Table 2.
Outcomes Included in the Child Tax Credit Module.

Note: K6 = Kessler Psychological Distress Scale; PT = Poverty Tracker.
Analytical Approach
Following Parolin, Ananat, et al. (2021) we estimated the effects of the CTC payments on the various outcomes described in Table 2 using a difference-in-differences approach, as specified in equation 1:

The model compares how our focal outcomes changed for those in the treatment and control groups between the time immediately before the CTC payments were made and in the months when they were made. PostCTC represents a binary indicator of whether the time of survey occurred after July 15, 2021, the day on which the CTC monthly payments were first dispersed.
We estimate the treatment variable in three ways: (1) with a binary treatment indicator, (2) with a continuous measure of treatment, and (3) with the same continuous measure of treatment but in a sample restricted to families with children. For the binary treatment indicator, respondents who have resident children younger than 18 years were identified as the treatment group (coded 1) and those who live in childless households were the control group (coded 0). The continuous treatment measure exploits variations in the monthly net income gains that families could realize under the CTC expansion. The gains are higher for families with (1) more versus fewer children, (2) children younger than age 6 versus older children, and (3) lower levels of income than higher levels. This is because the credit increased with each additional child, it was larger for younger children, and those with lower levels of income qualified for smaller credits under prior law than higher income families. For all families in the sample, we used data collected on income and on the number and age of children in the family to estimate both the total annual CTC that they were expected to receive under prior law and under the expansion. The annual income increase was thus equal to the difference in these calculated credit amounts, and the monthly increase was the annual increase divided by 12. In Figure 1, we depict the increase in monthly income calculated in the sample by income level and number of children, showing the significant variation therein.

Continuous treatment value by Adjusted Gross Income and family size.
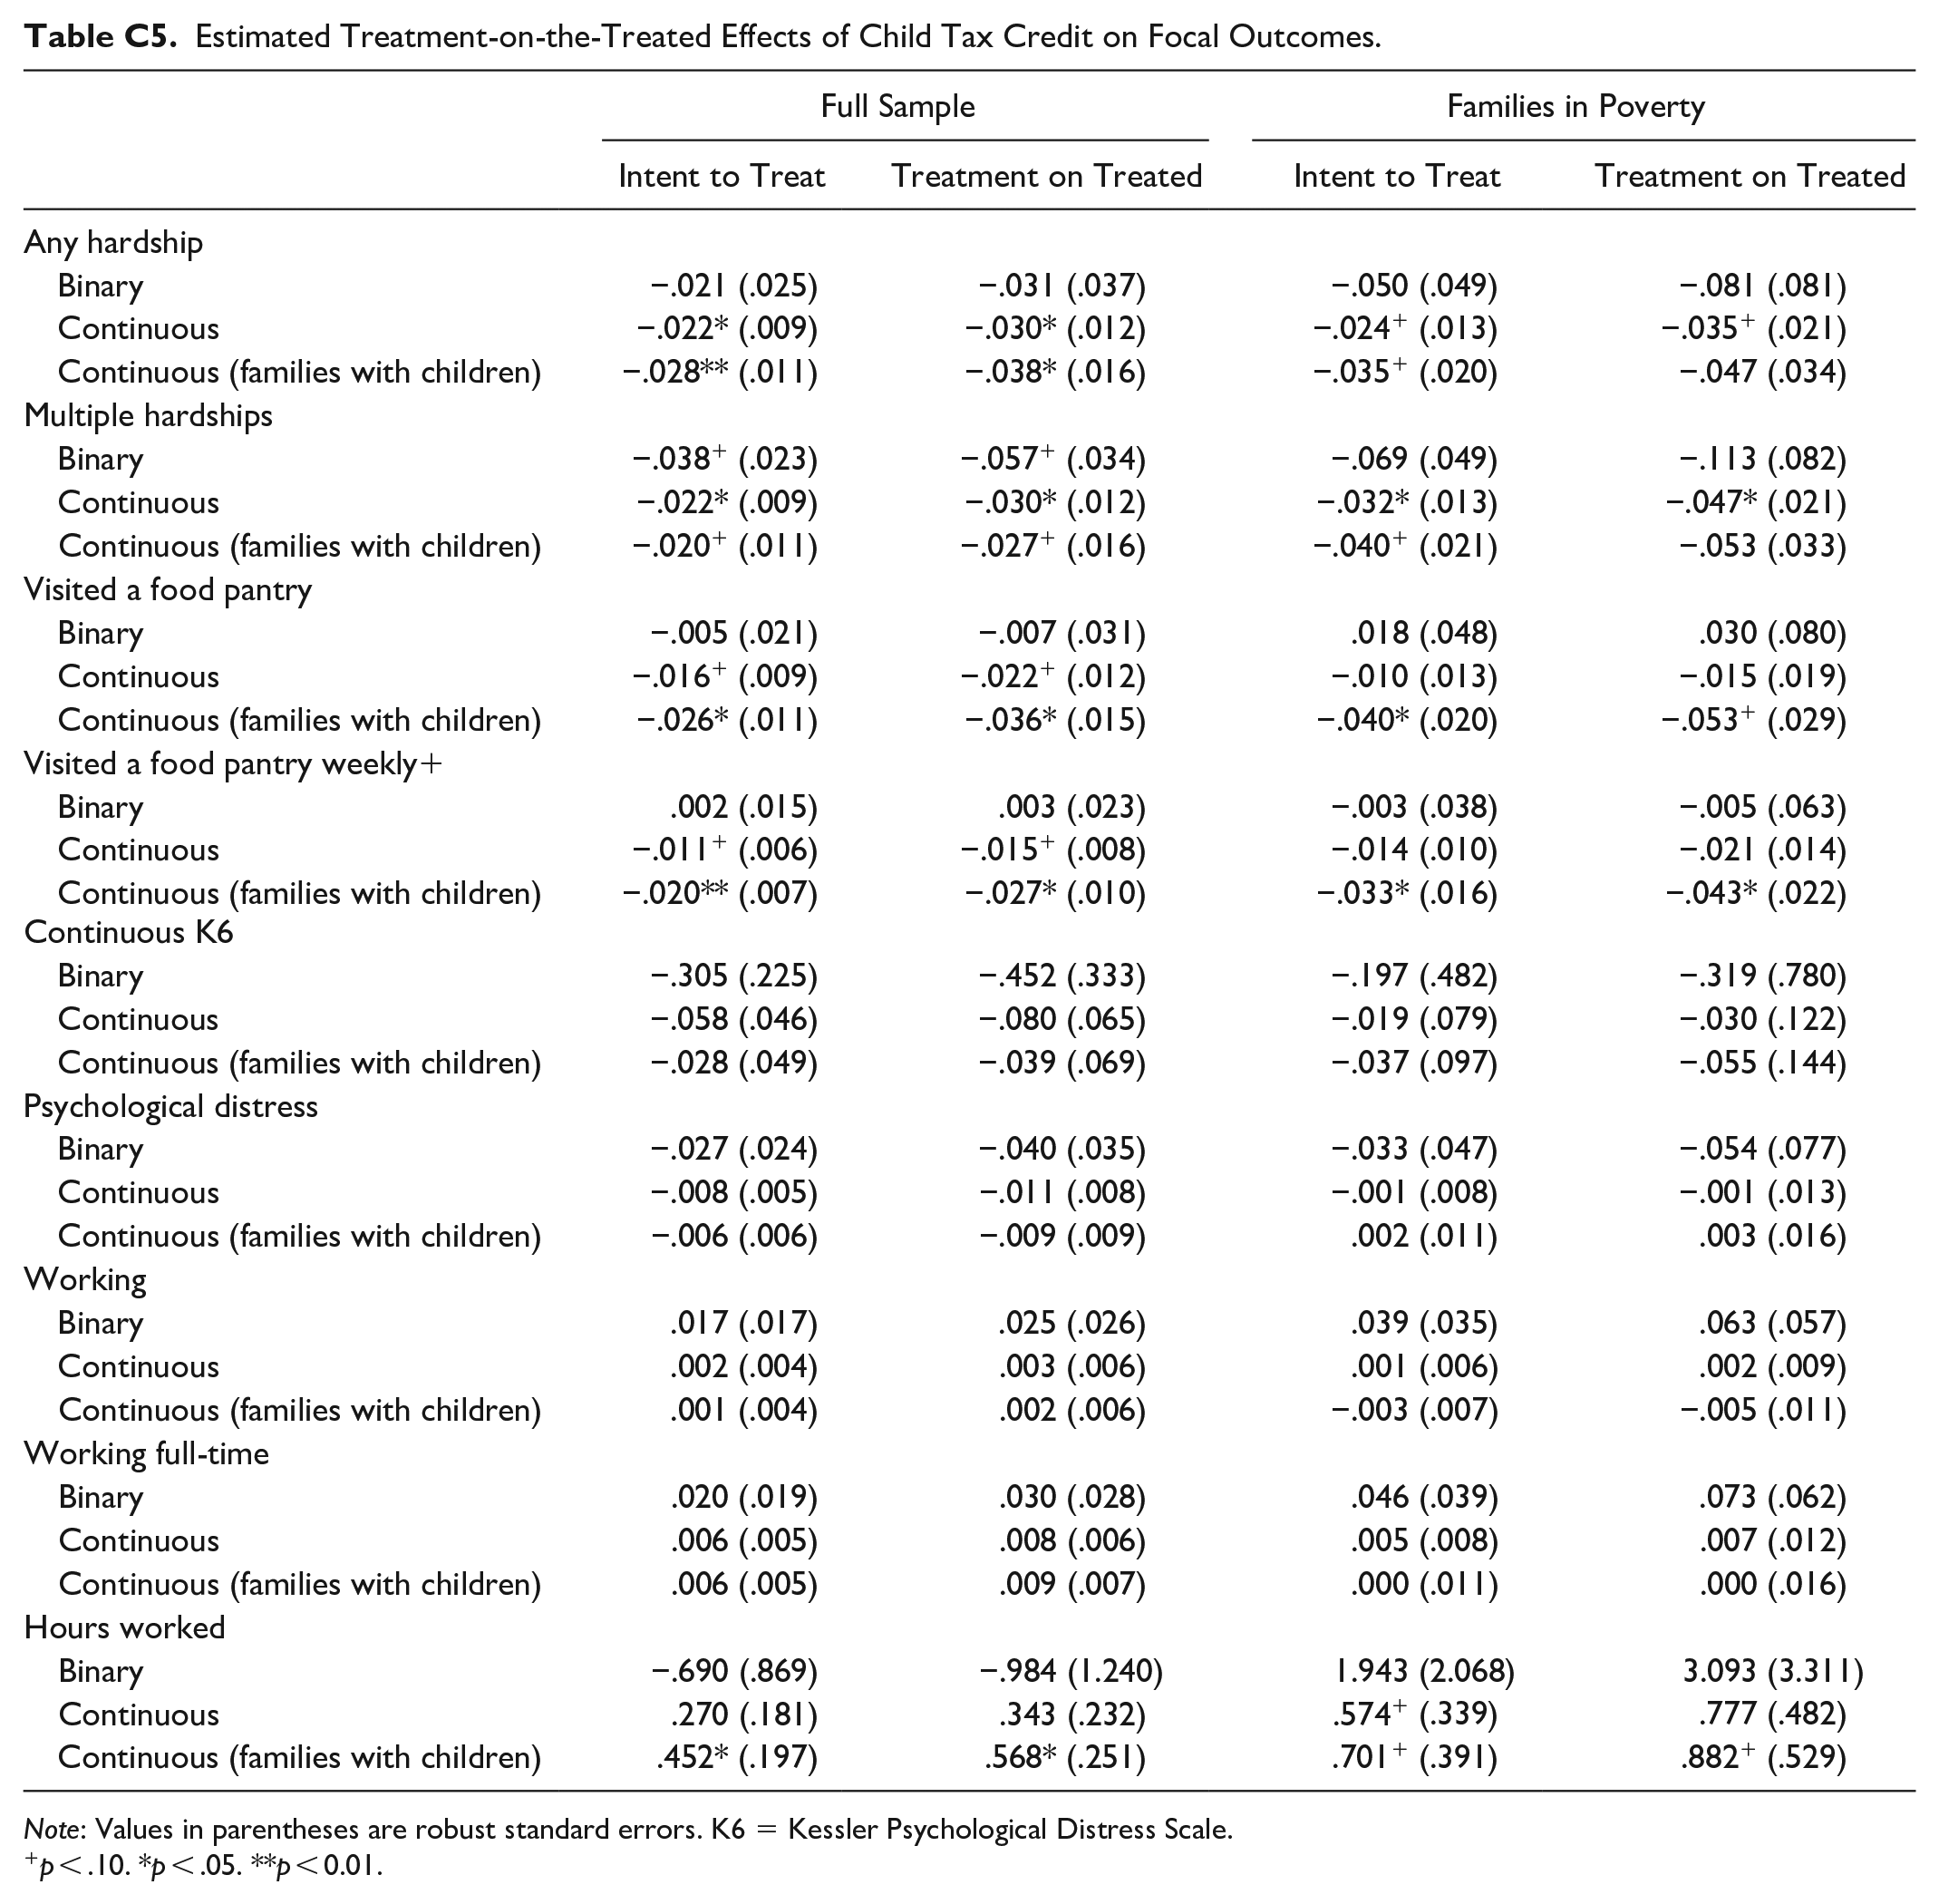
We used these treatment indicators described above to estimate the effect of the CTC on the “intent-to-treat” population. We also use data collected on the actual receipt of the CTC and the amount received to estimate the “treatment-on-the-treated” effect, presented in Appendix C. We note that given the likely underreporting of CTC receipt, we view these results as exploratory (as the self-reported receipt of the CTC is potentially biased). Following Parolin, Ananat, et al. (2021), the treatment-on-the-treated effect is estimated using a two-stage least squares model that employs our treatment indicator as an instrumental variable. In the case of our binary treatment, reported receipt of the CTC will be an endogenous variable. In the case of our continuous treatment, the monthly net benefit, based on the CTC amount respondents reported receiving, is the endogenous variable.
In each model, we control for the age, sex, education status, immigration status, race/ethnicity, and marital status of the respondent, survey wave, and the panel cohort (all captured in vector
In all models,
Finally, the difference-in-differences framework used here relies on the parallel trends (or common trends) assumption, in which trends in the observed outcome(s) are assumed to be the same in the treatment and control groups in the absence of treatment. We thus look at several years of data collected prior to the rollout of the CTC to assess these patterns in the beginning of our results section before turning to our difference-in-differences estimates.
Results
Our results are organized into two sections. We first present descriptive trends from 2016 to 2021 on our focal outcomes for both families with and without children, breaking out the periods before and after the rollout of the CTC payments in 2021. These results highlight the changes in these outcomes for both groups when the monthly payments were delivered and test for parallel trends in the prepayment period. In the following section, we present our difference-in-differences estimates of the effects of the CTC on our outcomes of focus. We only review the intent-to-treat estimates from these models in the body of this paper, but the treatment-on-the-treated estimates can be found in Appendix C, Table C5. We conclude with a summary of our sensitivity tests.
Descriptive Results
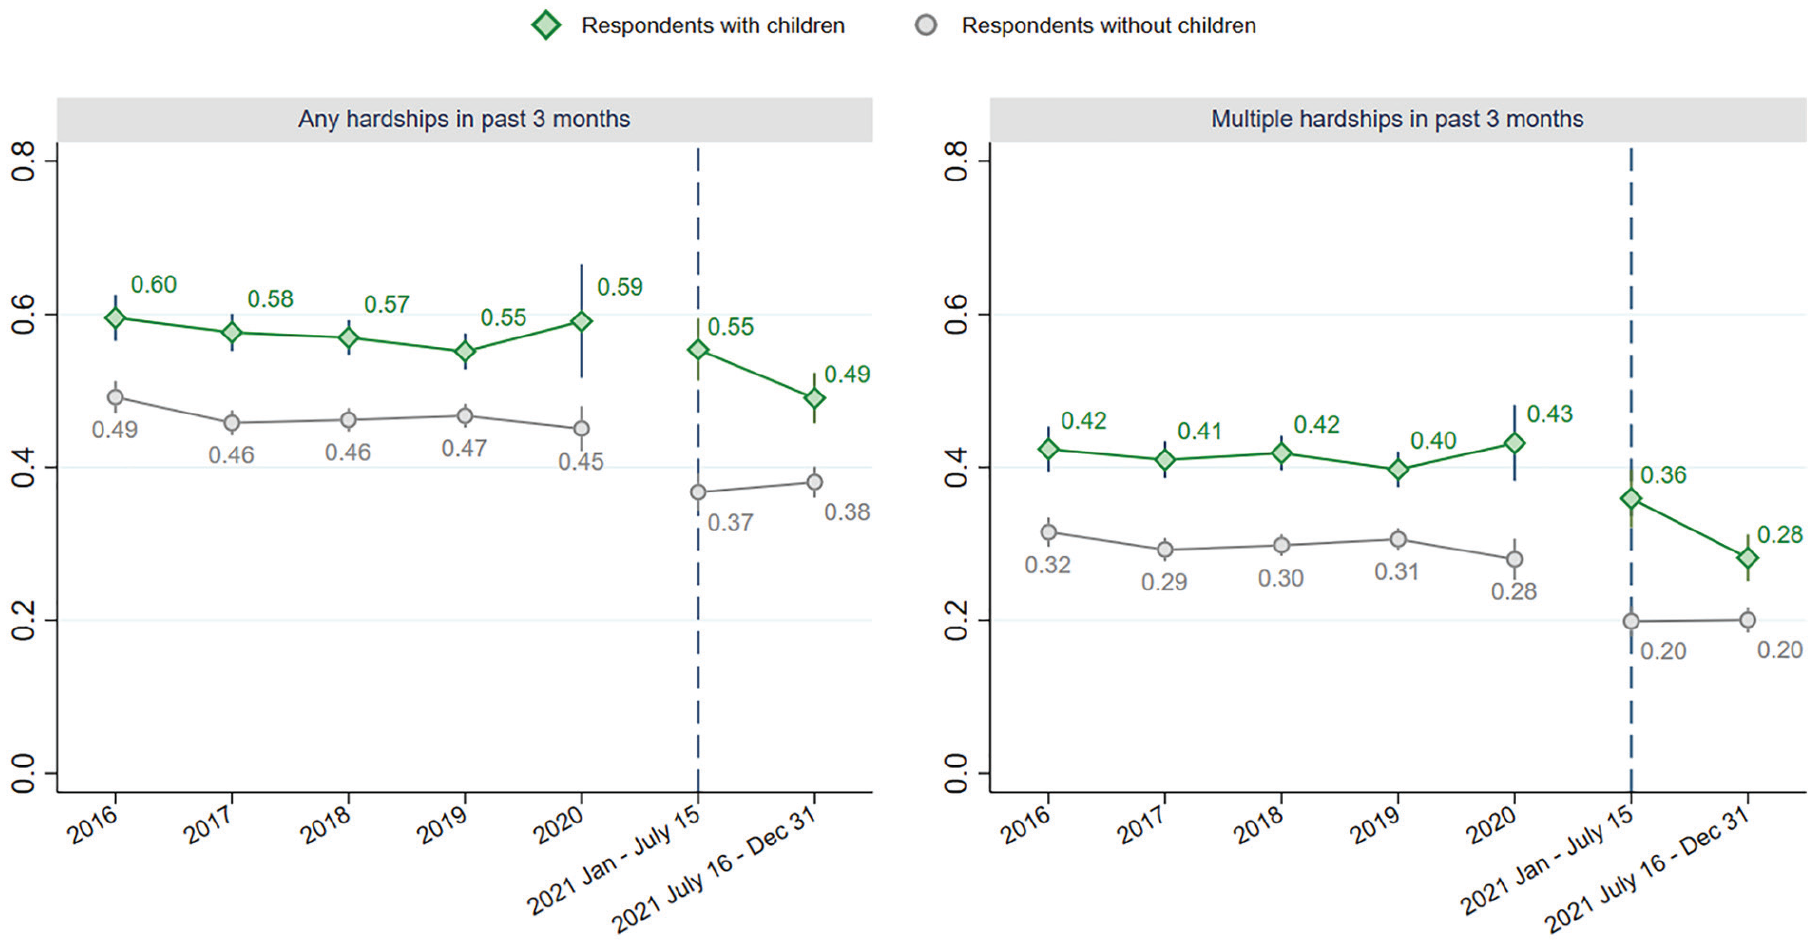
Our first descriptive results chart hardship rates for families with and without children from 2016 to 2021 (Figure 2). Note that because of data limitations, the definitions of “any hardship” and “multiple hardships” prior to 2021 do not include housing hardship, whereas 2021 rates do. The first takeaway from Figure 2 is that, in all years, families with children were more likely to face hardship (or multiple hardships) than those without children, but the year-to-year fluctuations in hardship rates tracked similar patterns for both groups between 2016 and the first half of 2021. 2 It might seem surprising that there were not significant increases in hardship in 2020 because of the pandemic, but these findings track external indicators and are associated with substantial government support provided in 2020. 3 Between 2020 and the first half of 2021, we see declines in our hardship measures for both families with and without children, a trend also in line with external data sources 4 and associated with government supports. 5
Trends in material hardship.
The second takeaway from Figure 2 is that between the first and second half of 2021 (i.e., before and after the rollout of the monthly CTC payments), rates of hardship fell for those with children but remained essentially the same for those without children. For example, the prevalence of multiple hardships fell from 36 percent to 28 percent for those with children (Figure 2, right panel) but stayed at 20 percent for childless families. Across all of the time periods examined, this is the only one in which hardship rates between families with and without children converge. It is also the only period, to our knowledge, with a policy in place that so disproportionately benefits families with children versus those without, suggesting that the monthly CTC payments led to significant declines in hardship for these families (which we assess further with our difference-in-differences models). A similar pattern emerges when examining individual forms of hardship, with the most notable declines in the share of families facing financial, food, and housing hardship (Appendix C, Figures C1 and C2).
Similar to trends in Figure 2, the use of food pantries from 2016 to 2020 followed similar patterns for those with and without children but fell between the first and second half of 2021 for those with children (from 23 percent to 19 percent) while remaining the same for those without (Figure 3). We note that rates of pantry use across these years come from survey questions referencing the past 12 months in the case of pre-2021 data and the past 30 days in the 2021 data. In the first half of 2021, families with children were also more likely to report having visited a food pantry than those without children, which deviates from the earlier patterns where rates of pantry use were similar for both groups when reported in reference to the past 12 months. This deviation suggests that there may be behaviors related to pantry use that are unique to families with children in 2021.

Trends in use of food pantries.
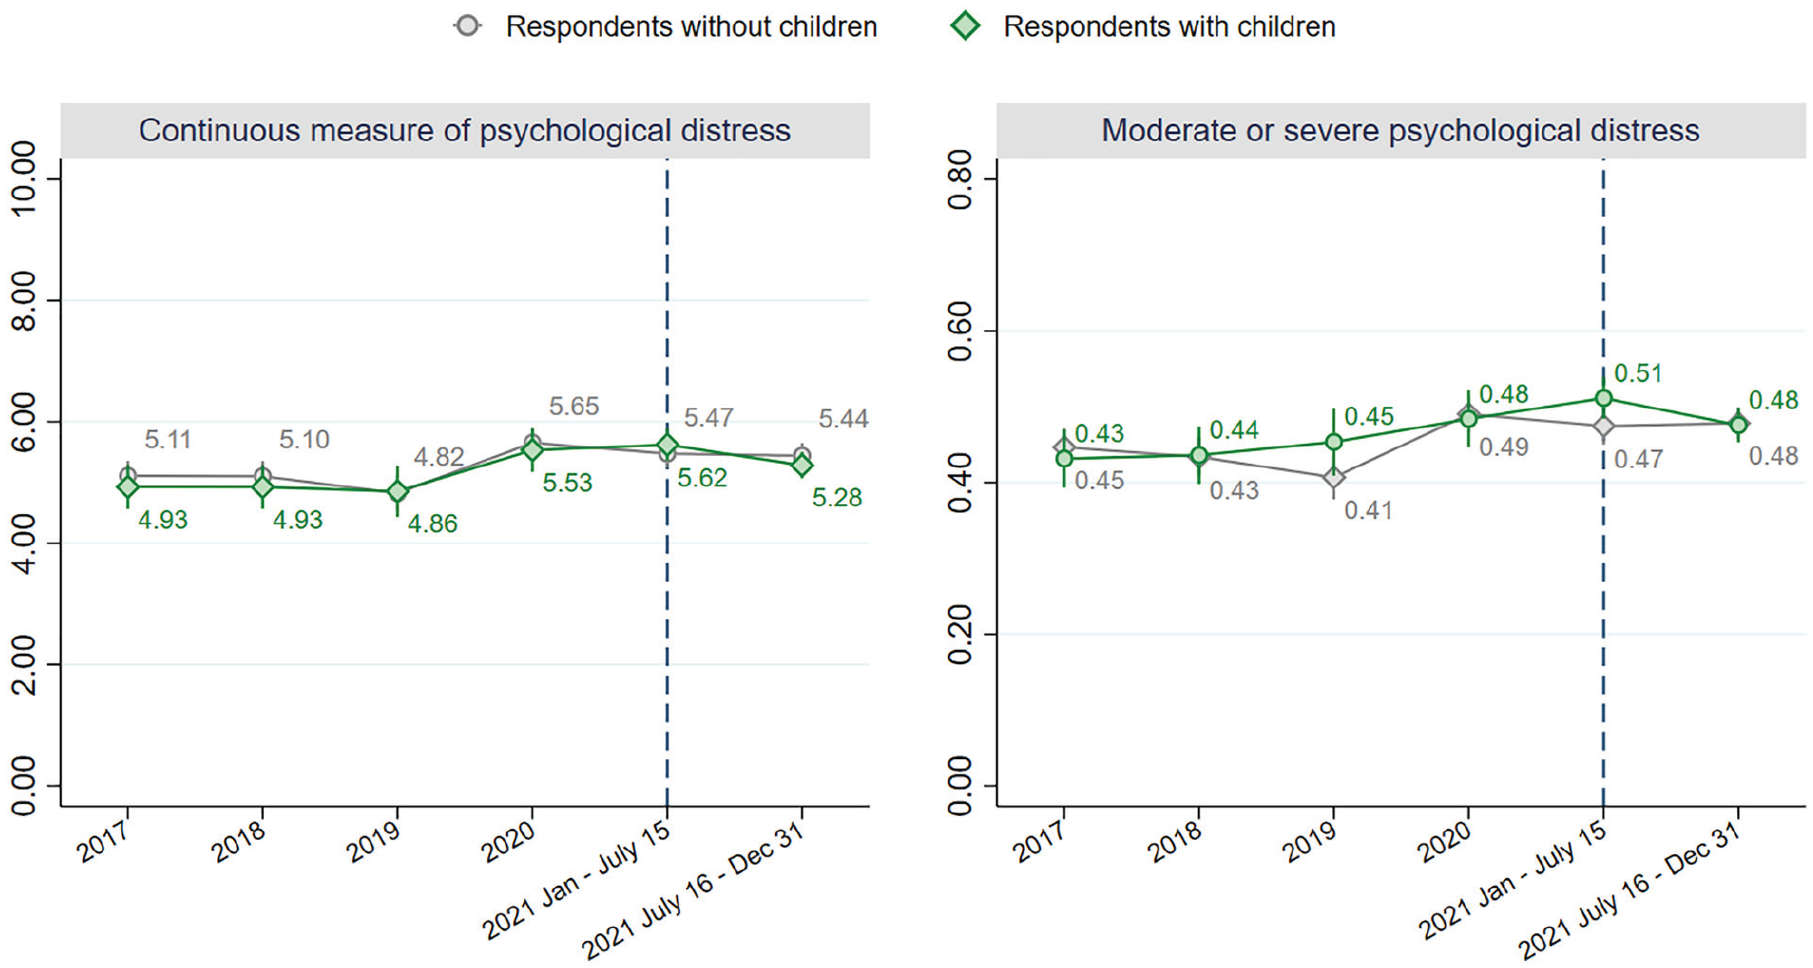
Looking at trends in psychological distress (Figure 4), average rates of psychological distress (measured using the continuous K6 measure) are largely similar for families with and without children and followed similar trajectories between 2017 and the first half of 2021. There was also a sharp rise for both groups in 2020 (Figure 4, left panel). Levels of distress declined somewhat between the first and second half of 2021 for those with children, but these changes are not statistically significant. The share of families classified as facing “moderate or severe psychological distress,” however, rose for families with children in the years before 2020 and fell for those without children (Figure 4, right panel). Figure 4 does not shed much light on the possible effect of the monthly CTC payments on psychological distress, suggesting that our difference-in-differences estimates using the continuous treatment estimate will be more appropriate for isolating this possible effect.
Trends in psychological distress.
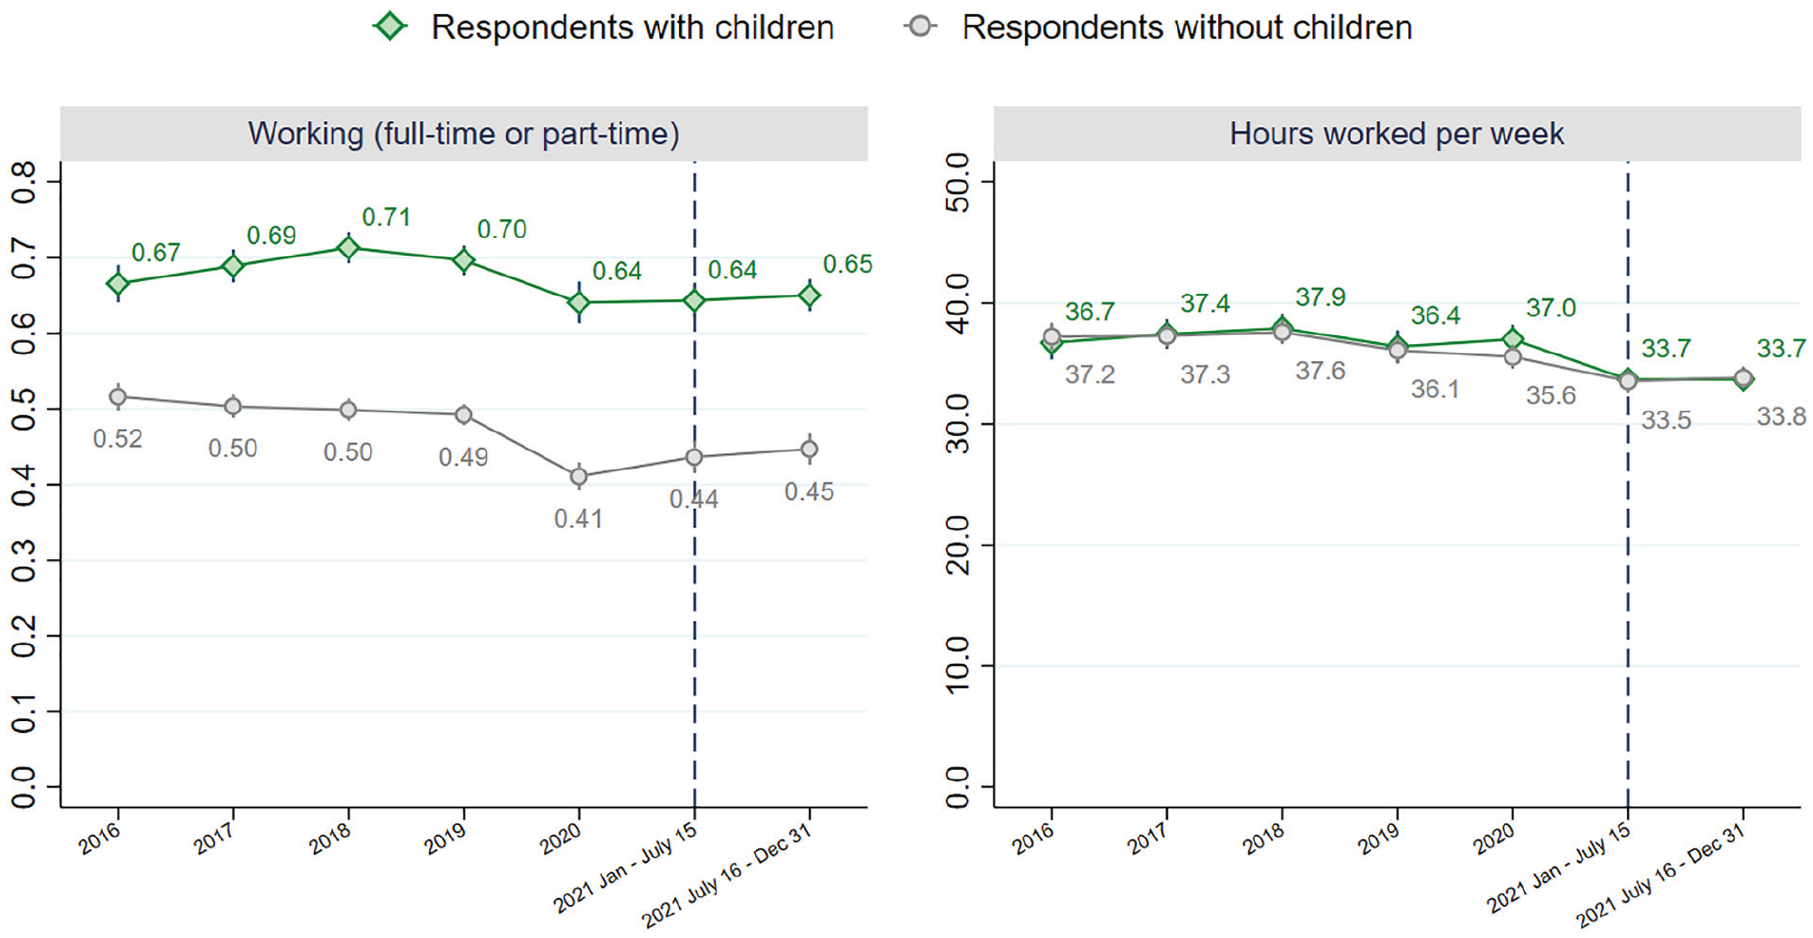
Finally, annual trends in parental employment rates (Figure 5) also show similar trends when comparing families with and without children. There was a noticeable decline in employment for both groups in 2020 (Figure 5, left panel). There was also an increase in employment among those without children between 2020 and the first half of 2021, whereas rates for those with children remained stable. In the period when monthly payments were made, however, employment levels among respondents with children and without children remained stable. Across the same period, we see no significant difference in reported weekly hours worked between those with and without children (Figure 5, right panel).
Trends in employment.
Altogether, these descriptive results suggest that families with children faced fewer material hardship and used food pantries less frequently the months when the IRS delivered monthly CTC payments compared with earlier periods. However, there is little evidence suggesting reductions in parents’ psychological distress or employment associated with the payments. The historical trends also demonstrate that there are no substantial violations of the parallel trends assumption that underlies our difference-in-differences models, but some of the results (particularly those related to pantry use and psychological distress) suggest that there may be biases introduced when comparing families with and without children. Given these findings, along with unique challenges faced by families with children in 2020 and 2021 (specifically those related to childcare and school closures), we see the estimates of the CTC payments’ effects on the basis of the continuous treatment in the sample limited to families with children to be less at risk for potential bias and focus the discussion of our difference-in-differences results largely on these estimates. Note that the one outcome we do not examine here is child-related spending as we do not have the relevant data prior to 2021.
Difference-in-Differences Estimates
Material Hardship
Table 3 presents the difference-in-differences estimates of the changes in the likelihood of experiencing any hardship (panel A), multiple hardships (panel B), and in the average count of hardships (panel C) for families with children after the rollout of the monthly CTC payments. We show estimates for our three treatment specifications estimated using the full sample and for families living in poverty. 6
Difference-in-Differences Estimates of Effect of Monthly Child Tax Credit Payments on Likelihood of Families With Children Facing Hardship.
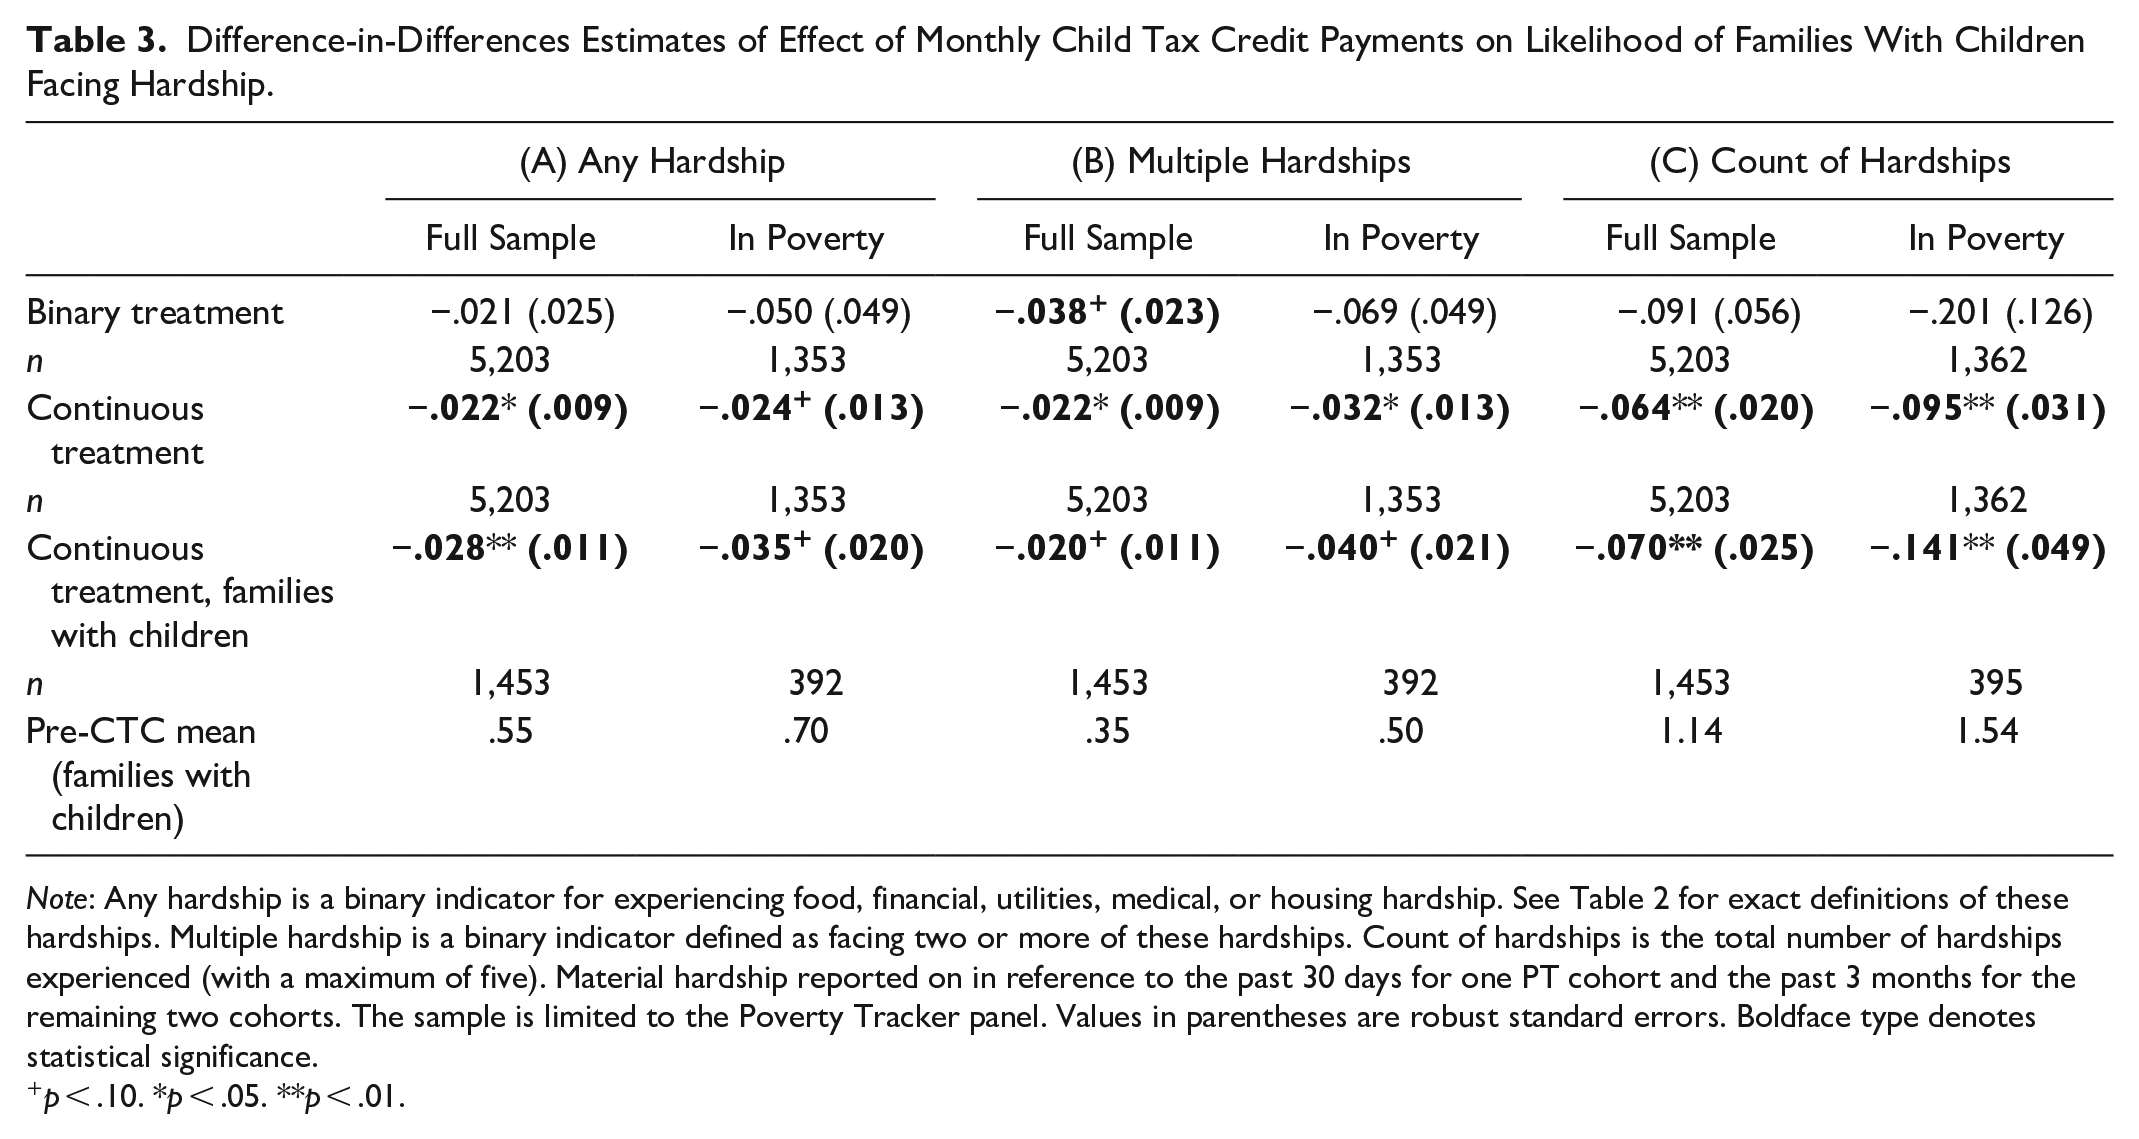
Note: Any hardship is a binary indicator for experiencing food, financial, utilities, medical, or housing hardship. See Table 2 for exact definitions of these hardships. Multiple hardship is a binary indicator defined as facing two or more of these hardships. Count of hardships is the total number of hardships experienced (with a maximum of five). Material hardship reported on in reference to the past 30 days for one PT cohort and the past 3 months for the remaining two cohorts. The sample is limited to the Poverty Tracker panel. Values in parentheses are robust standard errors. Boldface type denotes statistical significance.
p < .10. *p < .05. **p < .01.
In all of the models, we see a reduction in hardship for families with children in the period when the CTC payments were made (Table 3, panel A). Although most of our binary treatment estimates do not pass tests of statistical significance (at the p < .10 level), those estimated with the continuous treatment do. Focusing on the results in the sample limited to families with children, we estimate a 2.8 percentage point reduction in hardship for each $100 increase in income from the CTC (at the p < .01 level). As the average increase in monthly income from the CTC was $187 per family, this amounts to a reduction in hardship of 5.2 percentage points on average, or a 9.5 percent reduction compared with the pretreatment hardship rate (55 percent). Among families with children living in poverty, the results show reductions of a larger magnitude compared with those based on all families: a 3.5 percentage point reduction in the overall risk of hardship per $100 (at the p < .10 level), or 10.0 percentage points on the basis of the average income increase of $287 among families in poverty. This translates to an 14 percent relative reduction compared with the pretreatment mean of 70 percent.
Our models also identified a substantial reduction in the share of families facing multiple hardships when they received the monthly CTC payments (Table 3, panel B) and in the total number of hardships they faced (Table 3, panel C). Again, focusing on results estimated from the sample limited to families with children, we find that the share of families facing multiple hardships fell by 2.0 percentage points (at p < .10) per $100 income gain, which translates to a reduction of 10.7 percent compared with the pretreatment mean (35 percent) on the basis of an average income increase of $187. Looking at families in poverty, we find a 4.0 percentage point (at p < .10) reduction in the risk for multiple hardships per $100, or a 22.9 percent reduction versus the pretreatment mean of 50 percent and an average income gain of $287 among this group. The effects follow a similar pattern when we switch to looking the effect on the total count of hardships faced by families, thought reductions in the count of hardships were significant at p < .01 (Table 3, panel C).
In Figure 6, we examine the effect of the CTC on each domain of material hardship in the sample subset to families in poverty (for full-sample results, see Table C1). The estimates show reductions in all domains, but the most substantial reduction was financial hardship (running out of money), and we see moderately significant reductions in food and utilities hardship. In the sample limited to families with children, we find a 7.9 percentage point decline in financial hardship (at p < .01) per $100 increase in CTC income, a 3.7 percentage point decline in food hardship (at p < .10), and a 2.5 percentage point decline in utilities hardship (at p < .10) (Figure 6).

Difference-in-differences estimates of effect of monthly child tax credit payments on likelihood of families with children facing various hardships (families in poverty).
Altogether, the monthly CTC payments are associated with a significant decline in the share of families with children in New York City facing hardship overall and multiple forms of hardship. There were also declines in various forms of hardship for families with children between the pre-and post-CTC rollout periods, although the statistically significant declines were those associated with financial hardship (running out of money), while estimated changes for other forms of hardship were less precise.
Use of Food Pantries
Table 4 presents changes between the pre- and post-CTC rollout periods in the share of families reporting any use of food pantries in the 30 days before they were surveyed (panel A) and frequent pantry use (weekly or more, panel B). Our trend analysis presented earlier (Figure 3) suggests that families without children are not the best comparison group for this outcome, so we focus our discussion on the estimates produced with the sample limited to families with children using the continuous treatment estimate. These results show a significant decline in overall use (panel A) and frequent use of food pantries (panel B) associated with CTC payments. For each additional $100 gain in CTC payments, we see a 2.6 percentage point decline in the use of food pantries among families with children and a 2.0 percentage point decline in frequent use (at p < .01). To put this in perspective, this amounts to a more than 10 percent reduction in the use of food pantries and a 20 percent reduction in frequent use of pantries for each additional $100 in CTC payments compared with the pretreatment means of 23 percent and 10 percent, respectively. The percentage point reductions are also of a larger magnitude when looking at families in poverty (4 and 3.3 percentage points, respectively).
Difference-in-Differences Estimates of Effect of Monthly Child Tax Credit Payments on Likelihood of Families With Children Facing Visiting a Food Pantry.

Note: Visited a food pantry is represented by a binary indicator set to 1 for respondents reported receiving free food from a food pantry in the 30 days prior to being surveyed. Visited a food pantry weekly or more often is a binary indicator set to 1 for those who reported receiving food from a pantry weekly or more frequently in the past 30 days; it is set to 0 for those who received free food less frequently and for those who did not report receiving free food from a pantry in the past 30 days. The sample is limited to the Poverty Tracker panel. Values in parentheses are robust standard errors. Boldface type denotes statistical significance.
p < .10. *p < .05. **p < .01.
Taken together, the results in Table 4 suggest that the payments reduced the overall needs and the intensity of need for emergency food assistance, given that families were less likely to use them at all, and among those who continued to use them, they did so less frequently.
Psychological Distress
Table 5 shows results from difference-in-differences models estimating changes in psychological distress using our three treatment measures. Turning first to the continuous measure of psychological distress (panel A) the binary treatment indicator suggests a decrease in overall psychological distress scores for all families concurrent with the expansion of CTC payments beginning July 15 (overall and for those in poverty), though these changes are statistically significant. A similar pattern emerges when looking at the estimates derived from the continuous treatment measures. We also estimated treatment effects of the CTC on the prevalence of moderate levels of psychological distress (panel B), and we do not find significant changes in the period during which the monthly CTC payments were made.
Difference-in-Differences Estimates of Effect of Monthly Child Tax Credit Payments on Parents’ Psychological Distress.

Note: Psychological distress is measured using the Kessler Psychological Distress Scale, which asks about the frequency of experiences of nervousness, hopelessness, worthlessness, depression, restlessness, and that everything was an effort in the previous 30 days. Values in parentheses are robust standard errors.
Employment
Table 6 shows the estimated changes in working full- or part-time (panel A) working full-time (panel B) and hours worked (panel C) for families with children between the pre- and post-treatment periods on the basis of our difference-in-differences estimates. The results show no evidence of significant reductions in employment in response to the monthly CTC payments. In fact, all of the coefficients of full-time employment are positive and we see a significant increase in weekly hours worked (of 0.45 hours per week) among families with children when estimated in the sample restricted to families with children (at p < .05).
Difference-in-Differences Estimates of Effect of Monthly Child Tax Credit Payments on Parents’ Employment.
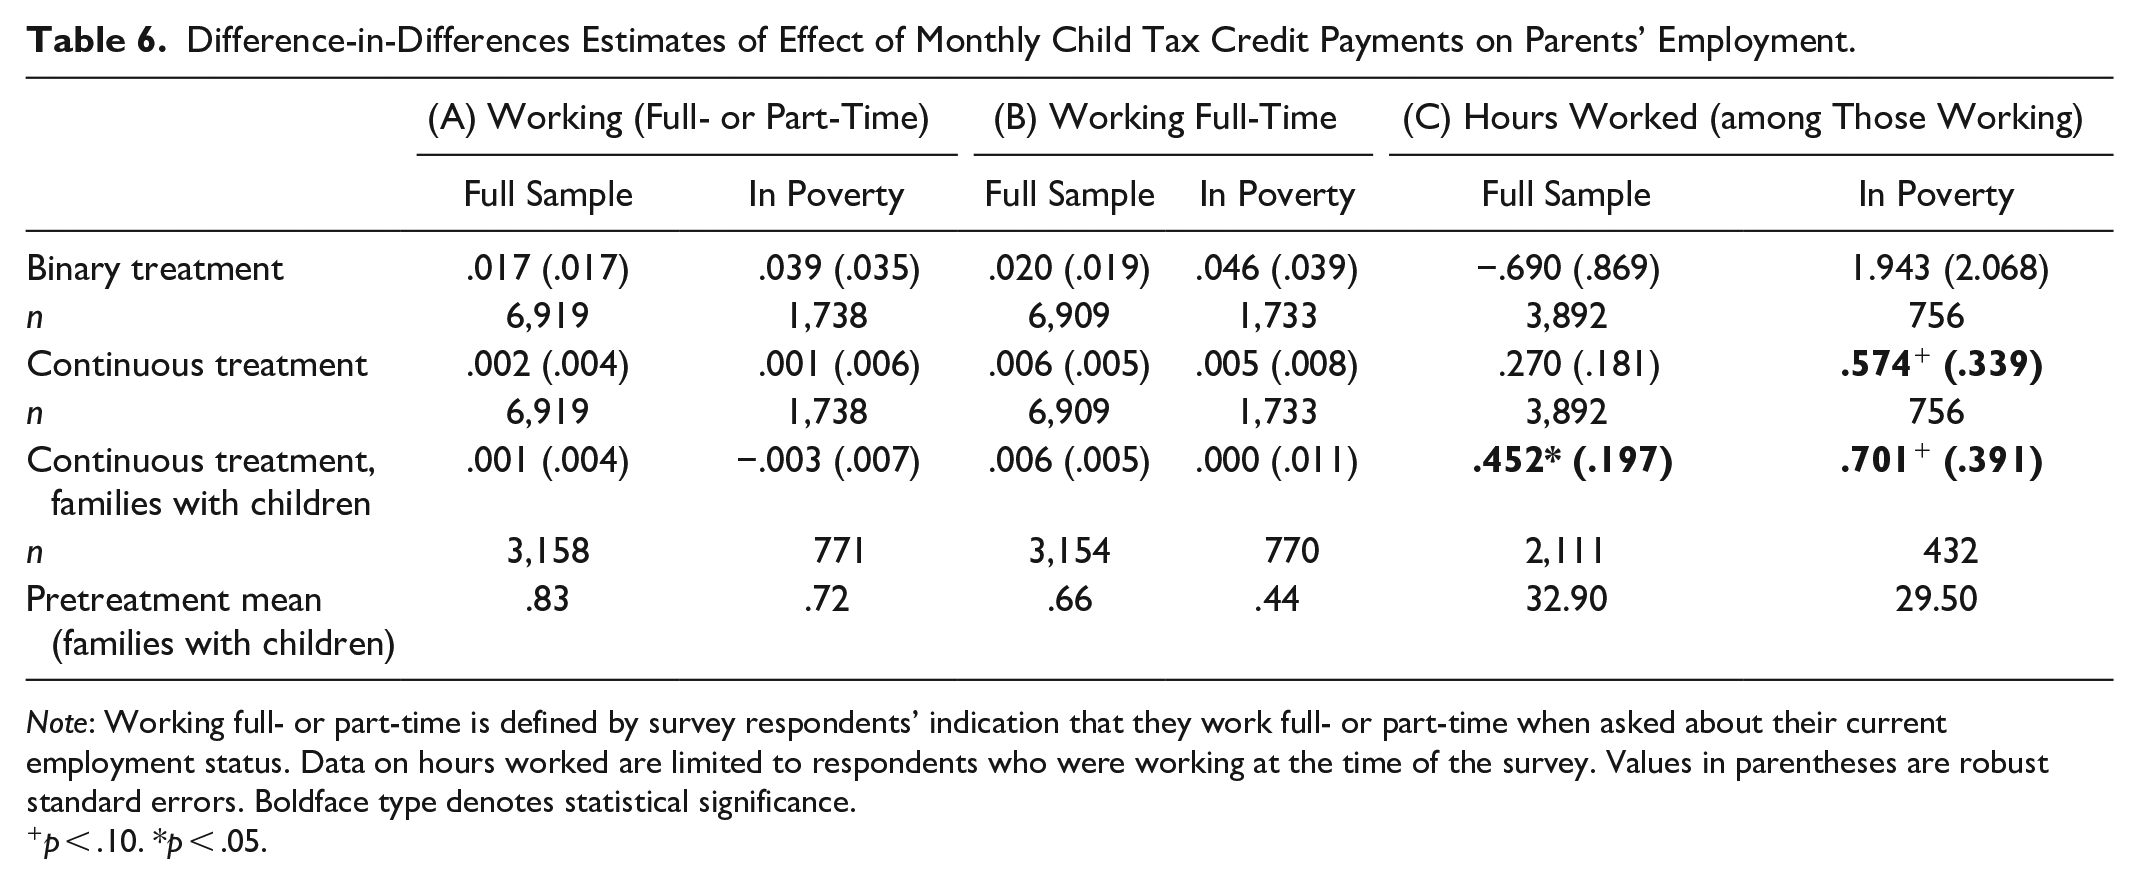
Note: Working full- or part-time is defined by survey respondents’ indication that they work full- or part-time when asked about their current employment status. Data on hours worked are limited to respondents who were working at the time of the survey. Values in parentheses are robust standard errors. Boldface type denotes statistical significance.
p < .10. *p < .05.
Child-Related Spending
Both before and after the rollout of the monthly CTC payments, the PT and ECPT surveys asked respondents with resident children how much they spent on books, toys, and children’s clothing; childcare; and extracurricular activities in the 30 days prior. Table 7 presents the estimated change in spending in these domains in response to the CTC payments on the basis of our difference-in-differences models. Because the distributions of reported spending levels were all right-skewed, we used a log-linear model. These models are by definition limited to families with children, and thus we use the continuous treatment measure to estimate the effect. Overall, we do not identify any significant changes in spending in these domains associated with the CTC payments on the basis of this specification.
Difference-in-Differences Estimates of Effect of Monthly Child Tax Credit Payments on Child-Related Spending.

Note: Spending is reported in reference to the past 30 days. Values in parentheses are robust standard errors.
When reviewing the results in Table 7, the lack of statistically significant treatment effects on child-related spending initially surprised us, given the emerging literature from self-reports on how parents reported spending the money (Roll, Chun, et al. 2021). We thus sought to test whether the same results would be consistent when limiting the sample to female respondents. The question was driven by the idea that in two-parent families with a mother present, the mother is more likely to oversee household management (including money management), particularly when resources are constrained (Lauer and Yodanis 2014; Pahl 1995; Treas and Tai 2012). When limiting the sample to mothers and female caretakers, our estimates show a 16 percent increase in spending on children’s books, toys, and clothes, and a 31 percent increase in spending on these items among mothers in poverty (both significant at p < .10) (Appendix C, Table C2). These results suggest that the monthly CTC payments may have led to increases in spending on these items but did not lead to changes in spending on childcare or enrichment activities. Additional data on these spending outcomes would, however, provide a better understanding of the CTC’s effects, as we discuss further in the discussion section.
Sensitivity Tests
In this analysis we explore several different outcomes and use various estimates of the treatment. As such, we face a higher probability of falsely identifying a significant effect (i.e., type I error). To address this possibility, we ran a series of models where we corrected for multiple hypothesis testing by controlling for the false discovery rate and calculating the sharpened q statistics on the basis of the methods outlined by Anderson (2008) (Appendix C, Table C3). Our core findings that the monthly CTC payments reduced the risk for facing hardship overall, financial hardship in particular, and in the count of hardships families faced and in their use of food pantries, remain significant when making this correction in our models with the continuous treatment estimates (see the first sharpened q statistic in the table). Two other factors that we did not control for in our models, family size and parental employment status, could also affect our estimates of the treatment effect. For example, some of the significant reductions in food pantry use could be driven by changes in employment. We did not account for these factors in our model because family size determines the size of the treatment and employment could be endogenous to the treatment. However, we did test our models when including controls for family size and parental employment, and our core findings of reductions in hardship and food pantry use are robust to these specifications (Appendix C, Table C4).
Discussion
The expansion of the CTC under the ARP marked a historic shift in U.S. social policy, albeit one that so far has only been temporary. For the second half of 2021, families across the country received a monthly benefit akin to a universal child allowance. Importantly, it was a cash payment as opposed to an in-kind transfer, which have in recent decades made up a larger share of benefits distributed to families with children (Pac et al. 2017). The expanded CTC was also available to nearly all families, including those with very low or no earnings who were ineligible for the credit under prior law. This group also stood to benefit the most from the expansion given the higher levels of hardship they experienced.
Theory and prior research suggest that the increased income families received from the expanded CTC could affect family well-being across multiple domains in both the short and long term (Brooks-Gunn and Duncan 1997; Chaudry and Wimer 2016; Cooper and Stewart 2017). In this study, we use data from the PT and ECPT to examine the effect of the expanded monthly CTC on several short-term outcomes related to child and family well-being, including many not yet explored in relation to this policy. Note that our analysis focuses on the months that the monthly payments were made and, as such, we are unable to draw any inferences about the longer term impacts of an expanded CTC. We find that the monthly CTC payment has significant effects on the likelihood of facing any form of material hardship, multiple forms of hardship, financial hardship (running out of money), and in the use of food pantries. We find no evidence of effects on parents’ psychological distress or employment and mixed results when looking at spending on child-related items.
To summarize our results, we find that the monthly CTC payments contributed to significant declines in the share of families with children facing any hardship (falling by 9 percent on the average), multiple hardships (falling by 11 percent on the average), and in the total number of hardships they endured (also falling by 11 percent on average). The share of families facing financial hardship (running out of money) also fell by 16 percent, on average. Among families in poverty, we found even larger reductions in the risk for facing any hardship and multiple hardships, financial hardship, and in the total number of hardships faced. For this subgroup, the effects on experiences of any or multiple hardships, however, were marginally significant, while the effects on the total number of hardships and on financial hardship were significant at p < .01. Clearly, the monthly CTC payments reduced hardships among families with children. Relatedly, our findings suggest significant declines in use of food pantries because of the payments: a 10 percent reduction in the overall use of pantries and a 23 percent reduction in the share of families visiting food pantries weekly or more frequently, per $100 increase in income from the CTC again with greater declines for those in poverty.
We do not identify any significant changes in parents’ psychological distress or employment in response to the CTC. Given that prior research shows income gains improving mental health, these findings may suggest that such improvements are less likely to occur with a temporary income shock such as the CTC. Our analysis does not show statistically significant reductions in full-time employment associated with the CTC payments. Instead, we find a significant increase in the number of hours worked among working parents. These findings are consistent with research using the latest Current Population Survey data (Ananat et al. 2022), which also does not reveal reductions in labor supply associated with the delivery of the monthly CTC payments. Parents may have had more flexible schedules in the period when most of the payments were made because schools were open, but these findings could also be the result of parents having more cash on hand to cover the fixed costs associated with work (e.g., transportation costs) as well emergency expenses that arise and prohibit work if they are unaffordable (e.g., car repairs).
Results related to changes in spending on child-related goods and services were more mixed. Our estimates provide some suggestive evidence of an increase in spending on books, toys, and clothes among families in poverty when we limit to female respondents, consistent with findings from prior research in the UK (Gregg et al. 2006) but not on other measures such as spending on childcare. However, our analyses of spending were limited in that we do not have data on these spending patterns from earlier years. We thus do not know if seasonal variation in spending that we observed is similar to or different from changes between these periods in earlier years, and we are not able to fully account for seasonal variation in spending over the period when the CTC was in effect.
Our study does entail some limitations. First, our sample is restricted to children and families living in New York City and may not generalize to the entire U.S. population. However, New York City is home to the largest population of children in the country (roughly 1.8 million) and is particularly relevant in that there are areas of New York City where more than half of children were previously ineligible for the full CTC. New York City is also a highly diverse urban center with high costs of living and high levels of income inequality, meaning it is a valuable site for understanding how the CTC may help families residing in such areas. Second, although representative, our sample is also constrained by sample sizes that limit our power to precisely measure certain changes. Despite these sample size limitations, we were able to identify statistically significant effects on hardship and frequency of use of food pantries, providing promising evidence of the potential benefits of policies such as the CTC.
Finally, the temporary nature of the CTC expansion allowed the investigation of only short-term effects on child and family well-being. It is possible that the immediate increase in household income provided a short-term improvement in material hardships that could dissipate over time. Relatedly, our estimates do not account for the possibility of income/consumption smoothing over time; this would be an important question for future research. We also note that if the CTC expansion were reinstated as a longer term policy, economic inflation is another potential factor that could compromise the staying power of our estimated effects. Under current law, the CTC is not indexed to inflation, and recent reports from Collyer et al. (2022) and McCabe (2022) demonstrates how the antipoverty effects of an expanded CTC would diminish substantially over time if it was not pegged to inflation. Thus, tying any future CTC expansions to inflation would likely be key to realizing and maintaining the improvements in well-being documented in this study.
Altogether, our findings provide additional evidence of the effects of the monthly CTC payments on child and family well-being in the second half of 2021, particularly for families living below the poverty line. They suggest that the significant poverty reduction associated with the CTC payments (Parolin, Collyer, et al. 2021) also translated to improvements in family’s broader economic circumstances, with significant reductions in experiences of material hardship and deprivation. Future research should investigate whether these positive impacts are sustained over time and whether the disappearance of the payments in 2022 led to reversals of these trends.
Footnotes
Appendix A: Additional Information on the Poverty Tracker
The PT study surveys representative samples of adult New Yorkers, who are interviewed quarterly for a period of up to four years (see Table A1 for details about the panels). To ensure that the data are representative of the diverse experiences of low-income New Yorkers, the PT periodically includes subsamples of New York City respondents in the panels to supplement its larger sample, which is recruited using random digit dial methods. These subsamples of New Yorkers include those using social service agencies (in the first two panels), and New Yorkers of Chinese origin (in the fourth panel). In this appendix, we provide additional information about the various PT panels.
Appendix B
Poverty Tracker and ECPT Sample Composition Compared with American Community Survey.

| ACS NYC Adult Sample Composition (2017–2019) (%) | PT and ECPT Sample Composition (%) | |
|---|---|---|
| Poverty status | ||
| Not in poverty (OPM) | 83 | 79 |
| In poverty (OPM) | 17 | 21 |
| Respondent race/ethnicity | ||
| Asian, non-Latino | 15 | 15 |
| Black, non-Latino | 22 | 21 |
| Latino | 28 | 26 |
| Multiracial or another race/ethnicity | 3 | 5 |
| White, non-Latino | 33 | 33 |
| Age category | ||
| 18–34 years | 33 | 29 |
| 35–49 years | 25 | 33 |
| 50–64 years | 23 | 20 |
| ≥65 years | 19 | 18 |
| Respondent marital status | ||
| Single | 57 | 53 |
| Married | 43 | 47 |
| Respondent gender | ||
| Female | 53 | 67 |
| Male | 47 | 33 |
| Respondent immigration status | ||
| U.S. born | 54 | 63 |
| Foreign born | 46 | 37 |
| Respondent educational attainment | ||
| High school degree or less | 41 | 28 |
| Some college | 22 | 23 |
| College graduate or more | 37 | 49 |
Note: The American Community Survey (ACS) sample includes three years of data covering 2017 to 2019. We do not include data from the 2020 ACS, because of cautions against its representativeness (Asiala et al. 2021). ECPT = Early Childhood Poverty Tracker; OPM = official poverty measure; PT = Poverty Tracker.
Appendix C
Estimated Treatment-on-the-Treated Effects of Child Tax Credit on Focal Outcomes.
| Full Sample | Families in Poverty | |||
|---|---|---|---|---|
| Intent to Treat | Treatment on Treated | Intent to Treat | Treatment on Treated | |
| Any hardship | ||||
| Binary | −.021 (.025) | −.031 (.037) | −.050 (.049) | −.081 (.081) |
| Continuous | −.022* (.009) | −.030* (.012) | −.024 + (.013) | −.035 + (.021) |
| Continuous (families with children) | −.028** (.011) | −.038* (.016) | −.035 + (.020) | −.047 (.034) |
| Multiple hardships | ||||
| Binary | −.038 + (.023) | −.057 + (.034) | −.069 (.049) | −.113 (.082) |
| Continuous | −.022* (.009) | −.030* (.012) | −.032* (.013) | −.047* (.021) |
| Continuous (families with children) | −.020 + (.011) | −.027 + (.016) | −.040 + (.021) | −.053 (.033) |
| Visited a food pantry | ||||
| Binary | −.005 (.021) | −.007 (.031) | .018 (.048) | .030 (.080) |
| Continuous | −.016 + (.009) | −.022 + (.012) | −.010 (.013) | −.015 (.019) |
| Continuous (families with children) | −.026* (.011) | −.036* (.015) | −.040* (.020) | −.053 + (.029) |
| Visited a food pantry weekly+ | ||||
| Binary | .002 (.015) | .003 (.023) | −.003 (.038) | −.005 (.063) |
| Continuous | −.011 + (.006) | −.015 + (.008) | −.014 (.010) | −.021 (.014) |
| Continuous (families with children) | −.020** (.007) | −.027* (.010) | −.033* (.016) | −.043* (.022) |
| Continuous K6 | ||||
| Binary | −.305 (.225) | −.452 (.333) | −.197 (.482) | −.319 (.780) |
| Continuous | −.058 (.046) | −.080 (.065) | −.019 (.079) | −.030 (.122) |
| Continuous (families with children) | −.028 (.049) | −.039 (.069) | −.037 (.097) | −.055 (.144) |
| Psychological distress | ||||
| Binary | −.027 (.024) | −.040 (.035) | −.033 (.047) | −.054 (.077) |
| Continuous | −.008 (.005) | −.011 (.008) | −.001 (.008) | −.001 (.013) |
| Continuous (families with children) | −.006 (.006) | −.009 (.009) | .002 (.011) | .003 (.016) |
| Working | ||||
| Binary | .017 (.017) | .025 (.026) | .039 (.035) | .063 (.057) |
| Continuous | .002 (.004) | .003 (.006) | .001 (.006) | .002 (.009) |
| Continuous (families with children) | .001 (.004) | .002 (.006) | −.003 (.007) | −.005 (.011) |
| Working full-time | ||||
| Binary | .020 (.019) | .030 (.028) | .046 (.039) | .073 (.062) |
| Continuous | .006 (.005) | .008 (.006) | .005 (.008) | .007 (.012) |
| Continuous (families with children) | .006 (.005) | .009 (.007) | .000 (.011) | .000 (.016) |
| Hours worked | ||||
| Binary | −.690 (.869) | −.984 (1.240) | 1.943 (2.068) | 3.093 (3.311) |
| Continuous | .270 (.181) | .343 (.232) | .574 + (.339) | .777 (.482) |
| Continuous (families with children) | .452* (.197) | .568* (.251) | .701 + (.391) | .882 + (.529) |
Note: Values in parentheses are robust standard errors. K6 = Kessler Psychological Distress Scale.
p < .10. *p < .05. **p < 0.01.
Acknowledgements
We thank all members of the PT and ECPT research teams based at Columbia University for their work on these projects. We also thank Katherine Friedman, Janira Gayle, Nicholos Wilkinson, Ho Yan Wong, and Christopher Yera for their research assistance, as well as Yajun Jia and two reviewers for their helpful comments.
Funding
The author(s) disclosed receipt of the following financial support for the research, authorship, and/or publication of this article: This research was supported by a grant from Robin Hood.
1
Table B1 also compares the composition of the full sample and the sample subset versus respondents with children, showing that they are largely similar, but there are some notable differences. Compared with the full sample, Latino respondents, foreign-born respondents, and women are overrepresented among the population of respondents with children. Respondents from the ECPT cohort are also overrepresented among respondents with children, which makes sense as having children was requisite for participation at the time of the ECPT cohort’s recruitment.
2
In 2020, we see a modest increase in these hardship measures for families with children and a modest decline for families without, though the margins of error around these estimates show the changes were not significant for either group.
3
The poverty rate, for example, fell between 2019 and 2021 (Fox and Burns 2021), and the national food insecurity rate, which remained stable between these years (![]() ). The decline in poverty and stable rates of food insecurity are attributed to the expansive government supports provided in 2020, including support delivered through policies such as expanded unemployment insurance, SNAP, and stimulus payments.
). The decline in poverty and stable rates of food insecurity are attributed to the expansive government supports provided in 2020, including support delivered through policies such as expanded unemployment insurance, SNAP, and stimulus payments.
4
This trend is also in line with external data sets, such as the Household Pulse Survey, in which a sample of households across the country were interviewed in several weeks of 2020 and 2021 (U.S. Census Bureau 2022). The Household Pulse Survey asks about experiences of food insufficiency, falling behind on rent, and difficulty with expenses in the seven days prior to survey administration, and when looking at all observations in 2020 and the first half of 2021, we see significant declines in their prevalence between the periods (Appendix C, ![]() ). Note that the overall prevalence of these hardships is lower in the Household Pulse Survey, in part because of the shorter reference period, and thus the magnitude of the changes between the periods is smaller than that observed in the PT data, but both amount to similar relative changes (roughly 10 percent reduction in all hardships rates for both families without and without children).
). Note that the overall prevalence of these hardships is lower in the Household Pulse Survey, in part because of the shorter reference period, and thus the magnitude of the changes between the periods is smaller than that observed in the PT data, but both amount to similar relative changes (roughly 10 percent reduction in all hardships rates for both families without and without children).
5
This included the stimulus checks delivered in the first half of 2021 and the continuation of many expansions instituted in 2020, such as expanded unemployment insurance and SNAP.
6
As described earlier, the poverty indicator is based on prior survey data.