
Abstract
As large corpora of digitized text become increasingly available, researchers are rediscovering textual data’s potential fruitfulness for inquiries into social and cultural phenomena. Although textual corpora promise to enrich our knowledge of the social world, avoiding problems related to data quality remains a challenge to related empirical research. Hence, evaluating the quality of a corpus will be pivotal for future social scientific inquiries. The authors propose a conceptual framework for total corpus quality, incorporating three crucial dimensions: total corpus error, corpus comparability, and corpus reproducibility. These dimensions affect the validity and reliability of inferences drawn from textual data. In addition, the authors’ framework provides insights toward evaluating and improving studies on the basis of large-scale textual analyses. After outlining this framework, the authors then illustrate an application of the total corpus quality framework by an example case study using digitized newspaper articles to study topic salience over 75 years.
The combination of available large-scale digitized corpora as well as novel tools from fields such as natural language processing and machine learning have elevated computational text analysis in empirical studies of the social world (for overviews, see, e.g., Edelmann et al. 2020; Evans and Aceves 2016; Grimmer, Roberts, and Stewart 2022; Wilkerson and Casas 2017). Computational tools increasingly grant social scientists insight into numerous social phenomena, events, situations, and relations through analysis of vast amounts of digitized text data (e.g., DiMaggio, Nag, and Blei 2013; Fligstein, Brundage, and Schultz 2017; Fuhse et al. 2020; Gentzkow, Shapiro, and Taddy et al. 2019; Grimmer 2010; Grimmer and Stewart 2013). Computational text analysis has thus been fundamental to study “old questions in new ways” (Bearman 2015). As the quantity of digital and digitized text corpora continues to increase globally, gauging and diagnosing the quality of processed machine-readable corpora also become increasingly crucial. To ensure that empirical insights are valid and reliable and to avoid issues of “garbage in, garbage out” (Geiger et al. 2020), we need to know that the data quality is good enough. Yet, despite their importance for social science inquiries, understanding error structures in textual data and, in turn, how they affect the validity and reliability of estimates obtained with large-scale computational text analyses remain largely underdeveloped (for notable exceptions, see Hsieh and Murphy 2017; Olteanu et al. 2019; Sen et al. 2021).
In this article we propose a conceptual framework for assessing the quality of textual data that enables researchers to systematically diagnose a corpus’ scientific value along three quality dimensions: total corpus error, corpus comparability, and corpus reproducibility. The first dimension, total corpus error, allows us to reason how accurate estimates of theoretical concepts inferred from the textual material are; it builds on and develops the total survey error (Andersen et al. 1979; Groves and Lyberg 2010; Lyberg 2012). The second dimension, corpus comparability, indicates how well estimates and variables from the available corpus compare with subsets of the given corpus and related estimates from other corpora. The third and last dimension, corpus reproducibility, highlights the advantages of transparency and openness in the data curation process. This framework for evaluating the quality of textual data allows researchers to detect low-quality data before delving into further computational analysis, to reflect on potential avenues for improving data quality so the corpus can be used for social inquiry, and thus to enhance the validity and reliability of empirical insights.
Researchers working with processed machine-readable corpora are faced with a fundamental question: is my corpus of sufficient quality to answer my research question? The concept of quality in evaluating data has a long tradition in the field of survey methodology, in which the concept of data quality rests on the notion of “fitness for use” as part of the total survey quality (Biemer and Lyberg 2003; Juran and DeFeo 2010; Pipino, Lee, and Wang 2002). 1 Furthermore, the total survey error framework helps in understanding the accumulation of all errors arising from the design, collection, processing, and analysis of survey data (Biemer 2010). Each error, in turn, either increases the bias and/or variance of the estimators of interest. Analogously and closely related to notions developed in survey methodology and especially to the total survey error framework, in this article we develop a framework to assess textual data quality. Certainly, there are essential differences between analyzing large-scale textual data and survey data. Unlike subjects in surveys or interviews, authors of many corpora did not produce their texts for research. Hence, the contents of most corpora need not relate, a priori, to investigations by researchers, who also exercise only limited control over the production process affecting data quality. Texts do not follow the classical row-column format that survey data and many other large-scale data sources tend to come in, yielding unique challenges to mainly data creation processes. Yet approaching the quality of a textual corpus from a perspective of “fitness for use” directs our attention to crucial aspects of curating and preparing data for scientific inquiry and later inferences. We suggest that researchers can diagnose the scientific value of each corpus and the knowledge they may gain from it by carefully and systematically exploring quality dimensions and potential sources of error. Evaluating the different quality dimensions allows reflection on different error sources’ impacts on scientific conclusions and enables collaborative data curation between multiple researchers.
Given recent developments in the analyses of large-scale data, a number of works have introduced frameworks for identifying errors in different types of observational data sources obtained from databases and Web sites, for example, for housing data (Amaya, Biemer, and Kinyon 2020; Biemer and Amaya 2020), Twitter data (e.g., Hsieh and Murphy 2017; Sen et al. 2021), and event data (e.g., Demarest and Langer 2019). In this article we expand current discussions to provide a general quality framework for textual data, a “nontraditional data format” (Amaya et al. 2020) that does not conform to the usual row-column format. Building upon previous work, we extend the ideas of Lyberg (2012) and Amaya et al. to textual data. We hold that the steps required to collect and curate textual data differ substantially from other large-scale data sources, yielding a distinct error structure that needs attention and formalization. Indeed, with this article, we aim to dissect the traditional idea of measurement and data processing errors. Instead, we categorize the errors associated with different parts of data collection and transformation procedures needed to transform textual content into data, leveraging the idea of focusing on the source of errors (Amaya et al. 2020). By demystifying when and how different errors occur, the framework offers a tool for researchers to make informed decisions regarding where data quality enhancing efforts have the greatest effect.
The article contributes to discussions of the importance of determining the nature of errors in a given body of textual data in order to understand their potential effects on scientific inquiries when making inferences about theoretical constructs (Franzosi 2004). It also contributes to a growing literature on the consequential decisions taken in curation and preprocessing before analysis of corpora (Barberá et al. 2021; Björk 2015; Denny and Spirling 2018; Geiger et al. 2020; Jo and Gebru 2020; Nguyen et al. 2020; Schofield, Magnusson, and Mimno 2017; Sen et al. 2021; Tahmasebi and Hengchen 2019). We consider the presented framework as the first step toward a taxonomy for systematically evaluating data quality issues and their impact on the reliability and validity of scientific insights of each specific corpus. Moreover, the framework can be a tool for researchers when making decisions during data curation and before venturing into large-scale computational text analysis.
Using Text as Data in Empirical Studies
In empirical research, texts serve either in their manifest, face-value form or as sensors reflecting social phenomena, such as what a group of people was experiencing at a specific time or how people interpret and evaluate events, actors, or relations. Regardless of the researcher’s approach, decisions made in initial data curation steps may significantly impact later analyses. Figure 1 schematically presents scientific inquiry and corpus creation as two interrelated processes necessitating diagnosis and evaluation of the quality of a textual corpus.

Using text as data in scientific applications.
The process of scientific inquiry within social science has been predominantly deductive. Driven by theory, researchers initiate their scientific inquiry by formulating a research question, defining the target population for which they want to make inferences as well as the theoretical constructs of interest. Advances in statistics, natural language processing, and machine learning, and new computational text analytic models give researchers new tools for an inductive research process given large-scale data. Unsupervised methodologies from natural language processing and machine learning allow quantitative discoveries of patterns in the data that may offer “new directions, questions, and measures in a research project” (Grimmer et al. 2022). To encapsulate recursivity of both deductive and inductive research processes, we hence omit arrows within the scientific inquiry work flow and use a bidirectional arrow between the two processes in Figure 1.
Methods for operationalizing theoretical constructs are highly dependent on the available data. Hence, researchers set out to identify the source materials available, such as historical documents, radio broadcasts, or digital data, to answer the research question. Accordingly, sources can be analogue documents, either handwritten or printed, audio or “born digital” (e.g., see Bail 2012; Garcia and Rimé 2019). The first two types need to be transformed into a machine-readable format (i.e., converted from nondigital to digital) to facilitate computational approaches. This transformation from original documents and transcripts to machine-readable text data occurs in several steps along the digitization process. Digitalization can be conducted either manually using annotators transcribing the source material or computer-assisted using different algorithms, including optical character recognition (OCR) or handwritten text recognition. The resulting machine-readable corpus is seldom ready to use but must be further processed and curated. Some sources contain additional nontextual information, such as speaker tonality or font sizes, whereas others do not. Such metadata can be added to the corpus manually or via automatic processes. We call this process data enrichment (see Figure 1). Data enrichment and other processing steps result in a processed machine-readable corpus (i.e., the best possible digital representations of original content).
In sum, textual information from paper documents, audio recordings, textual “born digital” data are prone to the same kinds of error structures.
The Total Corpus Quality Framework
Analogous to the total survey quality perspective, we have identified three dimensions that together capture the quality of the corpus for its intended research purpose: (1) total corpus error, (2) corpus comparability, and (3) corpus reproducibility (see Figure 2). The first dimension captures the accuracy of estimates with respect to the research question. The latter two concern more qualitative aspects of “fitness for use.” We believe that the accuracy dimension, captured by the total corpus error, is the cornerstone of quality: if errors in the corpus are too large, the corpus may simply not be suitable for use to answer a particular research question. Likewise, data that are not comparable with other sources (or different parts of the material are not comparable with each other) or unattainable to the broader research community creates difficulties in using it for scientific inquiry (Biemer and Lyberg 2003).

Schematic representation of dimensions and their elements of the total corpus quality framework.
Total Corpus Error
We view the total corpus error as the difference between a “true” answer to the research question of interest and the actual conclusions based on the textual material at hand. A “true” answer to a research question is, to be sure, merely an abstraction and unattainable. Still, it helps to illustrate the different sources of errors in using textual material for scientific inference. We suggest that the difference between a result based on the given data and a “true” result stems from three primary error sources: source errors, textual representation errors (TREs), and research inference errors (RIEs).
Source Errors
Textual data come from various sources, such as paper documents, digital text files, and digital or analogue audio recordings. We define source errors as the errors inherent in the physical source material, which distort the original information, making it difficult or impossible for researchers to read or listen to the content. Source errors thus affect the potential quality of the corpus already before corpus creation and is usually not possible to correct by the researcher.
We can use the size of the source error to answer the question: ow much of the original content is still available in the observed material? For example, background noises or screams in an audio file may make a speech inaudible to any person listening to the recording. Similarly, liquids may have dissolved the ink in handwritten texts and made the content unreadable. In “born digital” texts, source errors are usually less common, but may still arise because of corrupt hardware. Importantly, we consider source errors random (e.g., a damaged page or a garbled recording). More systematic excisions or distortions of the original text we consider coverage errors (see below). A high source error indicates that the data used in subsequent analyses will have a noisy version of the original material. Hence, source errors weaken the signal in the corpus, limiting the potential scientific conclusions one may draw from the material, much like random measurement error in the total survey quality framework.
TREs
TREs capture the differences between source material and machine-readable textual representations of the material. Hence, TRE answers the question, How different are the processed machine-readable and observed corpus? A high TRE indicates that the machine-readable corpus is dissimilar from the observed material. The sizes of these dissimilarities tend to be measurable, as one may compare the digitized material with what a researcher sees in the observed corpus. Considerable dissimilarities between the observed and the machine-readable material weaken the scientific value of the corpus. Thus, TRE also relates to the measurement error in the total survey error tradition with the critical difference that it can be estimated by comparing the observed source material and the machine-readable representation. Furthermore, TREs occur at several steps in the corpus creation process. These steps include creating a first machine-readable representation of the data, turning the textual content into documents (segmentation), and enriching the corpus before finalizing the material. We therefore categorize TREs into four main categories: source-to-(digital)-text errors, text-to-documents errors, documents-to-corpus errors, and processing errors.
Source-to-(digital)-text errors
Researchers may perform the processes of going from observed sources—be they printed texts or audio recordings—to machine-readable representations either manually or using more or less automated computational methods. 2 Researchers can read documents and listen to audio recordings and manually write them down in a machine-readable form. Creating a machine-readable corpus via manual transcription typically thereby requires only one step. In the case of manually creating a machine-readable representation of documents or audio, the error structure is similar to that of coding errors or interviewer effects in the total survey quality framework. Individual transcribers might introduce systematic errors, but the error structure is usually random rather than systematic when using multiple transcribers, if documents are allocated randomly. Computers, on the other hand, tend to make systematic errors. Although manual transcription is slow and requires extensive work when handling many documents, computers offer vast scaling opportunities but struggle to interpret the natural language or visual cues as humans can. For the situation of using computational methods, we divide source-to-(digital)-text errors into two components: source-to-digital errors and digital-to-text errors.
Whenever converting an analogue document into a machine-readable representation, one must depict the physical pages as images. Similarly, one must convert analogue audio, such as vinyl records, cassettes, and compact discs, analogously into digital audio representations. Source-to-digital errors consist of artifacts (i.e., any differences between the source text and that in the corresponding digital rendering) introduced in the processes of (1) generating a digital image of original analogue text or (2) generating an audio file from an original analogue recording. Examples of source-to-digital errors are dust caught between documents and scanners or creases, folds, or discolorations of source pages captured or enhanced in the digitized images (Conway 2011; Terras 2011). Source-to-digital errors differ from source errors because they occur during the corpus creation process. An incorrigible ink spill in the source materials is a source error, but an unintentional folding of a document during scanning is a source-to-digital error.
When using computers to transform analogue texts or audio into digital text, OCR or automatic speech recognition is typically used to move from the original format to a machine-readable text segment. The initial digital representation will be either a scanned image or a digital audio recording. Additional errors may occur in extracting the textual content. We call these digital-to-text errors. Conceptually, digital-to-text errors come in two types, image-to-text errors and audio-to-text errors.
Image-to-text errors capture how often the textual unit of interest differs between digital images and machine-readable texts. Image-to-text errors are problematic because they may create nonsensical or “faux content” (e.g., additional characters, potentially altered words, or the text passages’ meanings) (Hill and Hengchen 2019; van Strien et al. 2020). Converting images of texts to machine-readable text may systematically misidentify (and thus transform) some characters (or words), because of visual similarities, for example (e.g., between the letters c and e; Jarlbrink and Snickars 2017; Tanner, Muñoz, and Ros 2009). Image-to-text errors may also occur given misinterpretation of some textual content as nontextual content (e.g., categorizing newspaper headlines as images rather than texts because of their large font). Image-to-text errors are errors created by algorithms rather than distortions of the original pictures, distinguishing them from source errors.
Audio-to-text errors describe how often the textual unit of interest differs between the original audio and the machine-readable textual content. Audio-to-text errors, unlike image-to-text errors, may occur because of homophones (e.g., allowed vs. aloud), which one can infer only from context. The conceptual difference between image-to-text and audio-to-text errors is hence small but may introduce different error structures.
Text-to-documents errors
Textual documents consist of cohesive units of text. Deciding on the most appropriate text unit is not a straightforward task. Some researchers may see paragraphs as natural units (Algee-Hewitt, Heuser, and Moretti 2015), whereas other researchers may find news articles or sections thereof better units (DiMaggio, Nag, and Blei 2013). Similarly, we must define relevant segments within audio recordings to create cohesive text units (e.g., from audio show segments). For large data, automatic segmentation procedures find cohesive text or audio units, commonly splitting or combining parts of an image or audio recording into cohesive text segments (Shinde and Chougule 2012; Smith 2007; Zhan, Wang, and Gao 2006). We therefore refer to errors related to creating coherent text segments as text-to-documents errors. These errors occur when segmentation procedures split cohesive texts incorrectly, creating units of analysis different from those researchers would select. Errors in creating coherent text segments may occur through (1) incorrectly combining content from different documents into one cohesive segment or (2) splitting the content of one document into multiple incorrect segments. For example, one may (1) combine multiple news articles on one page into a single article or multiple political speeches into one speech or (2) split a news article spanning multiple pages into multiple segments, creating “faux documents.” The severity of the problems associated with the different possible text-to-documents errors hinges on the research question, on operationalization of the research question, and the methods chosen.
Documents-to-corpus errors
TRE’s third type of error source occurs while enriching textual data with further information, which we refer to as metadata (information about a text’s context, appearance, authors, or origins not part of the actual textual content). Documents-to-corpus errors roughly describe the accuracy of metadata in a corpus. Consider a corpus of speeches containing metadata representing the origin of the speech (Wang 2017) or a corpus of blog posts possibly holding labels of political leaning (Roberts, Stewart, and Tingley 2019). In these cases, the documents-to-corpus error represents how often the labels for origin or political leaning are incorrect.
Processing errors
Any data-processing procedures toward obtaining a final processed machine-readable version of the corpus may inadvertently introduce additional discrepancies between the original documents and the data. Processing errors are further discrepancies introduced by going from the initial machine-readable version and the final processed machine-readable version. Processing errors can, for example, be introduced when translating a corpus across different digital schema (Mesiti et al. 2006; Mitchell 2018).
RIEs
The errors introduced thus far have mostly been technical and can, at least in theory, be mitigated. In contrast, RIEs relate closely to the process of scientific inquiry, distinguishing RIE from TRE. RIE is therefore consequential in empirical research and may be substantial even in a small-scale study. RIE answers, on the basis of the corpus and the decisions made in corpus curation, the question, What is the discrepancy between the inference we aim to make and our measurement? These errors are not necessarily specific to dealing with text as data but occur in most empirical studies. However, there are some notable exceptions. We therefore only briefly describe the four types of RIEs for textual data: coverage errors, sampling errors, text curation errors, and specification errors.
Coverage errors are the discrepancies between the inference target population, as defined by the research question, and the texts in the corpus. Coverage errors can thereby lead to problems of representativeness (Fickers 2012; Mogalakwe 2009; Scott 2014) and relates closely to both the frame error and the nonresponse error in the total survey error framework (Andersen et al. 1979; Biemer and Lyberg 2003; Groves and Lyberg 2010; Lyberg 2012).
The sampling error equals the differences between the information available in the whole corpus and the sampled subset with respect to the target population and the research question. A notable exception in the case of textual data is that it is common to use keywords to subset (or sample) a large corpus. Usually, this subsampling is not done using probability sampling, and will hence introduce sampling bias (King, Lam, and Roberts 2017).
Text curation errors are errors introduced while curating the corpus to answer a specific research question. These type of curating efforts, such as removing rare word, small documents, stop words (Schofield et al. 2017), and so on, are very specific to textual data. The goal is mostly to improve inference but can in also have the opposite effect (Schofield and Mimno 2016). Text curation is closely connected to the linguistic properties and may hence differ between different languages.
Moving from abstract and theoretical concepts and questions to concrete operationalizations is central to studying social phenomena via textual data. Specification errors are the differences between how to measure relevant concepts and the ideal abstraction of them defined by the research question. Unlike in other data setting, the operationalization of textual data is often done at the analysis stage. Hence, unlike the operationalization error in the survey setting, multiple different operationalizations can often be done as part of an sensitivity analysis.
Bias and Variance
The total corpus error captures different error sources that affect the scientific conclusions drawn from texts. Analogous to the total (survey) error (Amaya et al. 2020; Andersen et al. 1979; Biemer and Lyberg 2003; Groves and Lyberg 2010; Lyberg 2012), we can further elaborate on how total corpus error affects the scientific results by separating the total error into bias and variance. Let

The expectation is with respect to the sampling distribution. All the errors presented will affect the total (mean squared) error of our estimator. Still, the effect on the scientific inference depends on whether the error will affect the bias or the variance. Bias relates closely to validity. On the other hand, variance relates closely to reliability and affects the extent to which results are reproducible and which conclusions one may draw from smaller corpora (Golafshani 2003).
In general, tasks performed by humans, such as manual annotation, tend toward both high variance and high bias for each individual. However, in the final material, we can reduce the impact of the bias associated with individual annotators by allocating multiple persons randomly to a single task, such as transcribing textual data (Artstein and Poesio 2008; Craggs and Wood 2005). Tasks performed by computers, such as automatic annotation, tend toward high bias and low variance. Adding more data may reduce variance but not bias, and bias remains a problem even as larger and larger data repositories become available to social science researchers. Table 1 summarizes the different components of the total corpus error.
Summary of the General Risk for Contributing to Bias or Variance by Error Component.

Bias is usually low if random sampling used.
Corpus Comparability
The second dimension of the total corpus quality framework is corpus comparability, the degree to which an extracted estimate is comparable with other estimates of the same concept. Many research questions require enriching or combining information from different types of data sources (Chen and Tomblin 2021; Konitzer et al. 2021) or comparing the findings for different corpora.
High corpus comparability guarantees that an estimator of a concept, such as gender representation or the salience of a political topic in newspapers is comparable across the entire corpus. This does not require an estimate to be the same for all subgroups (e.g., the salience of a football topic will likely be higher in a newspaper’s sports section, or different languages used in the same parliament). Instead, high corpus comparability means that the errors of a corpus are stable and uncorrelated with other metadata of interest. One may estimate corpus comparability by studying the total corpus error in different parts of the corpus relevant to the research question (e.g., different periods or political parties in parliament). This definition of high corpus comparability follows the common notion that having the same constant error throughout the whole material is preferable. For example, using different digitization technologies for separate parts of the corpus or in different sources (e.g., audio and documents) may result in low within-corpus comparability. For example, researchers interested in conducting cross-cultural comparisons may need to use corpora with texts in different languages. The difference in linguistic structure across language may substantially complicate comparisons because of differences in error structures. Such practices, not uncommon in practice, can result in varying biases and variances in the estimates for the distinct groups, making comparisons difficult and possibly precipitating spurious conclusions.
Corpus Reproducibility
Our framework considers corpus reproducibility as the third quality dimension of a corpus. Here we apply the term reproducibility to the corpus: two different researchers should be able to create the same corpus from the same observed material. Readers may be more accustomed to the idea of result reproducibility (i.e., the potential that one researcher could take the original data and the code used for analysis in some prior study and reproduce all the numerical findings) (Camerer et al. 2016; Liu and Salganik 2019; Open Science Collaboration 2015). However, the data themselves should also be reproducible (Downing 2004). If the methodologies used when the sources to a processed machine-readable corpus are deterministic, then reusing the same methodology would recreate the same corpus. However, if redepicting documents and converting them into processed machine-readable text require humanly annotated materials, corpus reproducibility may be more difficult.
At least in theory, one may evaluate corpus reproducibility by restarting the processes of corpus creation. That is, retracing the original documents to processed machine-readable data selected for a specific research question and studying how much of the processed machine-readable corpus remains consistent. We may thus assess corpus reproducibility by comparing the TRE and its elements for two corpora created by researchers who began with the same set of original material. The corpus is reproducible if all error components are roughly the same size. Furthermore, measurements of intercoder reliability (Bais et al. 2019; Belur et al. 2021; Campbell et al. 2013) may reflect how much randomness exists in the corpus creation procedures (e.g., when enriching the corpus with new metadata or using manual annotations). Low corpus reproducibility affects the variance of the estimates of interest; because of differences in data curation, repeated studies will likely yield different results.
A Case Study: The Total Quality Framework Applied
As a case study, we apply the total corpus quality framework to measure the salience of immigration discourse in Swedish news media from 1945 to 2019. We operationalize Swedish news media with Sweden’s four national newspapers: Aftonbladet, Dagens Nyheter, Expressen, and Svenska Dagbladet. This corpus includes more than 100,000 unique newspaper editions (see Figure 3 for examples).

Editorial pages in Aftonbladet: (a) 1945 and (b) 2019.
Like many research project, we are dependent on data digitized by a third party, in our case by the National Library of Sweden (NLS). The NLS has digitized its archive to store digital versions of fragile original materials, using both automatic segmentation and OCR.
To measure the salience of immigration in news discourse we want to identify the journalistic content of the newspaper. We hence want to enrich the corpus with metadata to indicate whether the textual content is editorial or commercial, body text or not, and to label section identifiers. Section identifiers are recurrent titles, logos, or images identifying similar section content over time. Enriching the corpus with such metadata enables us to filter the Swedish National Newspaper Corpus 1945–2019 and select specific parts of relevance to our research question.
Total Corpus Error
We can separate the task of evaluating the total corpus error into two main steps, measuring the TRE and assessing the RIE.
Step 1: Measuring TRE
We first create a “ground truth” against which to compare the processed machine-readable version of the corpus. We use human annotators to create a “gold standard,” which we can use to compare the information in the original and the machine-readable data.
Creating a gold standard is costly, so we evaluate the errors using a random sample of the full corpus. This strategy enables unbiased estimates of the total errors in a cost-effective way. We are interested in comparisons between different newspapers and periods, and therefore use a stratified random sampling procedure to ensure that these features are represented in the selected sample (see Cochran 1977; Lohr 2019). In our case study, a sample of 120 pages suffices to evaluate the size of four possible error sources (i.e., source-to-digital error, digital-to-text error, text-to-documents error, and processing error). We lack access to the source material (i.e., the physical copies of the newspapers), and rely therefore on images of the material. We rely on two human annotators to create a gold standard, for comparison on the information a human get when reading the material and the information retained when creating the corpus. The annotation for creating metadata labels took approximately three weeks of full-time work. We also let both annotators label parts of the same material, allowing us to calculate measures of intercoder reliability. In case of disagreement, a third, more senior annotator, decided the label.
To enrich the corpus with metadata regarding the type of content in our text blocks, we approach this as a machine learning problem, much like Barberá et al. (2021). We create a training and test set, containing roughly 50,000 and 10,00 texts respectively, from a random sample of 720 newspaper pages. We train and evaluate two separate classification tasks on our test set, one per variable of interest: (1) whether the textual content of a text block is editorial, (2) if a text block contains editorial body text, and (3) if a text block contains a section title. We choose these tasks because we are interested in Swedish immigration discourse and believe that editorial body texts in national news sections will best capture this.
Source-to-digital errors
In our case study, the annotators does not find any artifacts of the depiction of the newspaper pages in the sample. However, we have found some instances of source-to-digital error (see example in Figure 4) during further work with the material. For our purposes, the source error and the source-to-digital error in our corpus are practically negligible.

Example of a source-to-digital error. Page is folded, which warps the textual content, effectively making the K in NYKÖPING unreadable.
Digital-to-text errors
We investigate the image-to-text error using two different measurements: (1) Levenshtein distance and (2) word recognition. Levenshtein distance calculates the number of edits (deletions, insertions, or substitutions) needed to transform one string into the other. We use the Levenshtein distance to compare the digitized and annotated textual content from each sampled paragraph (Navarro 2001). This estimate captures character-level accuracy. Second, we study word recognition (i.e., how many of the words in the digitized texts exist in the annotated material, regardless of position). This captures word-level accuracy. Last, we compare the image-to-text error for both the raw material and the material after some preprocessing (i.e., removing all alphanumerical characters and excessive white spaces) to get more in-depth understanding of when image-to-text error occurs.
The average Levenshtein distance in this sample study is 0.23, which translates to 99.93 percent of all characters being, on average, correct. The word recognition is, on average, 99.06 percent. Hence 99 percent of all the words in the digitized sample also exist in the manually curated material (see Figures 5b and 5c).
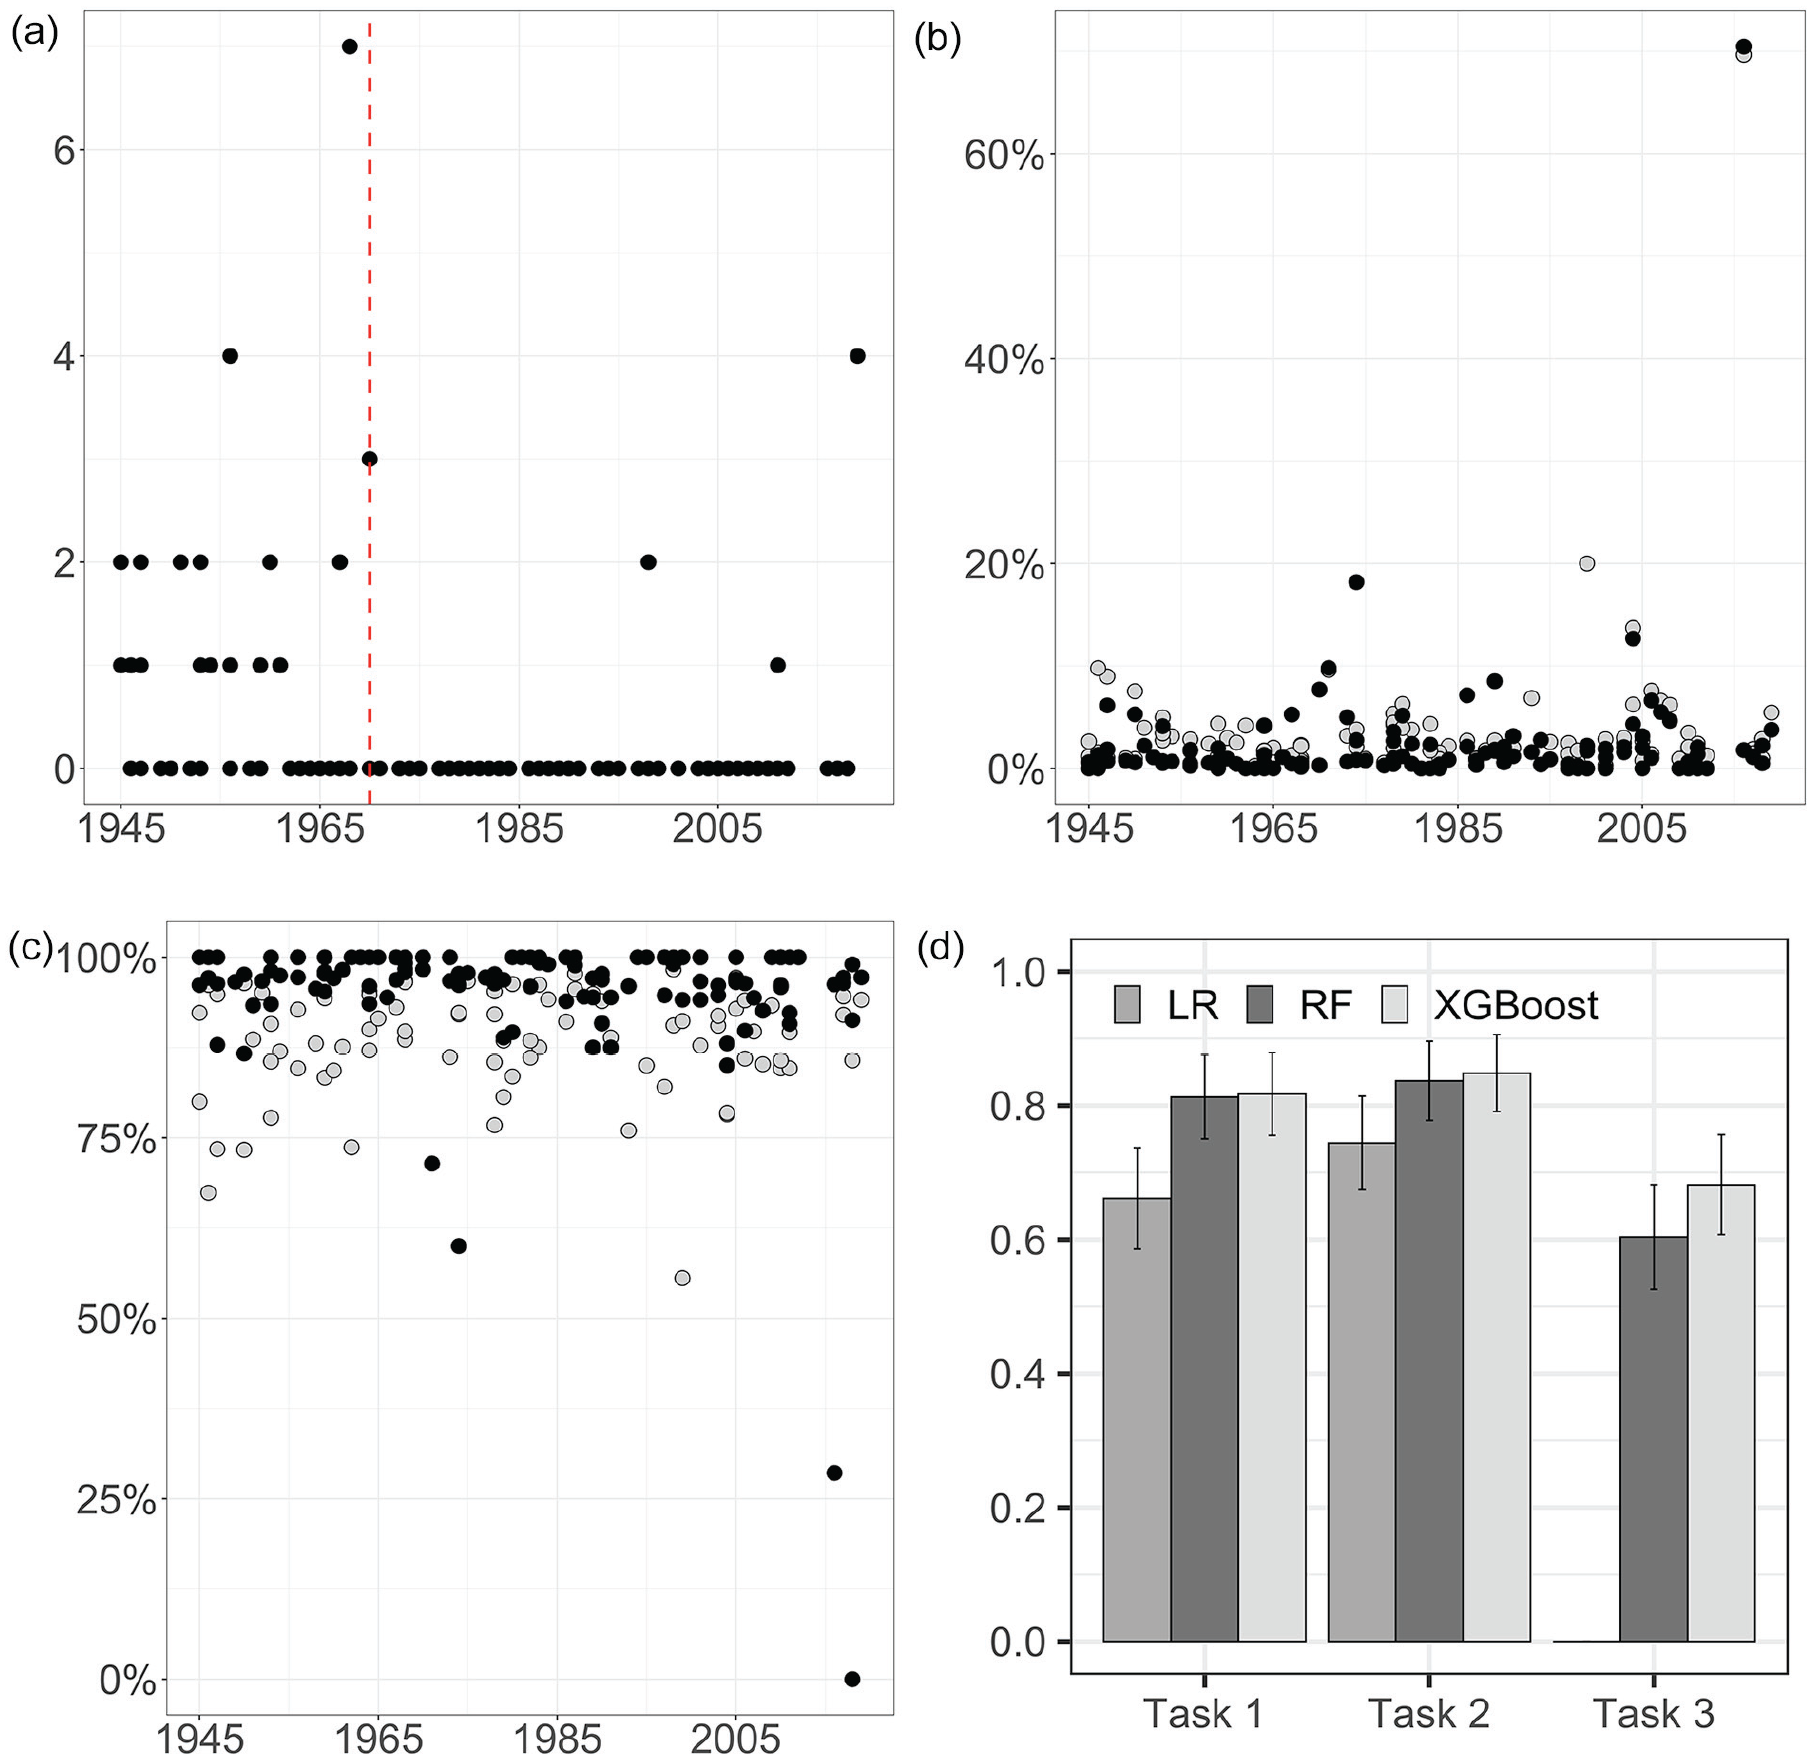
(a) Text-to-documents errors per year. The
Text-to-documents errors
We evaluate the quality of the segmentation using the number of times one text block consists of multiple articles, which indicates that the segmentation of the material has not respected the articles’ boundaries. Figure 5a shows how often textual content from different news articles combines into the same text block. Fewer than one in five (15.97 percent) of the studied pages contain any issues with segmentation quality. The notable error in 2019 occurs on a page with crossword puzzles, a feature notoriously difficult to segment but of less relevance for our purposes. Most text-to-documents errors exist in the early data material, a consequence of NLS using different segmentation techniques during different periods, reducing corpus comparability quality dimension. Our text-to-documents error estimate is relatively high, indicating that this corpus can benefit from further efforts to reduce text-to-documents errors.
Documents-to-corpus error
For our study, we choose to enrich the corpus with three different variables, representing different content types, by training three classification models to predict the content types (tasks 1–3) of previously unseen data. We compare the predictive performance of linear and nonlinear classifiers to allow nonlinear interactions between input variables. We use (1) logistic regression as a linear classifier and (2) random forest (Breiman 2001) and (3) extreme gradient boosting (XGB; Chen and Guestrin 2016) as nonlinear classifiers. We focus on using only visual information (e.g., the position of text blocks on the page and the number of words in the text block) as input features. We believe that not using the textual content as input features decreases the correlation between the predicted metadata labels and the documents-to-corpus error. We also believe that, even if including textual content as input features may reduce the variance of the documents-to-corpus error, it may also increase the bias. See the table in the Appendix for all input variables.
Figure 5d shows the F1 score (Sokolova and Lapalme 2009) for the models and the prediction tasks. The figure shows that the nonlinear classifiers outperform the linear classifier in all three tasks. The results also show how XGB and random forest perform equally well when predicting editorial content (task 1) and editorial body text (task 2), while the XGB classifier achieves the highest F1 score when classifying section titles (task 3). The highest F1 scores achieved are 0.817, 0.848, and 0.682 for the editorial content, editorial body text, and section titles, giving us also estimates of the magnitude of the documents-to-corpus error of 0.183, 0.152, and 0.318, respectively. On the basis of both the estimated documents-to-corpus error and the qualitative inspection, we decide not to use the metadata of section titles in the analysis.
Processing errors
To create a final, processed, machine-readable corpus, we want to transfer the machine-readable corpus from the original analyzed layout and text object (ALTO) format to a text (.txt) format. This transformation enables us to read the data using standard software for our analysis. We do not detect any discrepancies between the content of the ALTO files and that of the final .txt files and thus conclude that the processing error is small. However, we do identify some duplicates of newspaper editions in the material. We attribute this to a processing error by the NSL.
Step 2: Measuring the RIE
The difficulties in measuring the RIE stem from the fact that researchers typically have little or no way of knowing the perfect answer to their research questions (if we knew, we would not need to conduct our study in the first place). However, we discuss briefly how different RIEs may be evaluated in relation to our research question.
In our case, the target population is the national newspaper discourse. For our case study, we focus on studying the four national-focused newspapers with a large circulation today. Although we know that many prominent newspapers existed besides the four included in our study, we cannot access all newspapers printed during our study’s 75-year span. Hence, we have a potential source of coverage error.
To reduce the corpus to a more manageable size, we include only data from the first part of the newspapers. By focusing on this nonrandom subsample of pages, we introduce a sampling error. Here we might introduce both bias and variance into our conclusions.
We curate the raw texts by removing all uncommon words and stop words and by transforming important trigrams and bigrams into unigrams (e.g., “Olof Palme” becomes “olof_palme”). We also remove all nonalphanumeric characters and replace all numbers with a generic token signifying “numbers.” Finally, we remove all documents containing fewer than 15 tokens. Our curation efforts aim to reduce the vocabulary size, removing uncommon words—many because of image-to-text errors—that risk distorting measures of topic salience proportion. However, the size of the introduced text curation errors is difficult to quantify meaningfully. We can only state that these operations, especially removing short documents, may result in a text curation error.
We operationalize immigration salience using sets of keywords associated with immigration, essentially introducing specification errors. We use both a “strict” and a “broad” set of keywords as a sensitivity analysis. The strict version contains the Swedish words for refugee (flykting), immigration (invandring), and asylum seeker (asylsökande), while the broad keywords allow all inflections on those terms. We find a clear, and expected, difference in level of immigration salience. The level difference was most pronounced during the European “refugee crisis” of 2015 and 2016. This example shows the problems associated with high specification error.
Corpus Comparability
Figure 5a shows how the text-to-documents error is larger before 1970 than afterward. The changing techniques for segmentation used by the NLS decrease the text-to-documents error for the later period, but also decreases corpus comparability. This is one example of a trade-off between different error components, showing how fixing one type of error may reduce comparability. Figure 6 also shows that the documents-to-corpus error in task 1 and task 2 are (relatively) constant over time, while the error for task 3 fluctuates much more. Furthermore, it seems that the specification error is particularly problematic for 2015, considered by many a turning point in the Swedish media discourse (Emilsson 2020).

F1 score of extreme gradient boost classifier on hold-out data per decade and task.
From the combined results we can conclude that our corpus has issues with comparability, partly because of changes in the source material and partly to changes in digitization processes. We also note that some of our decisions in the data curation processes may have had negative effects on comparability. However, all newspapers show similar trends for most errors, and therefore comparison between newspapers is likely feasible.
Corpus Reproducibility
The NLS has administered the digitization of the Swedish National News Corpus 1945–2019 for many decades. We have neither access to the exact details of the original images nor the resources necessary to restart the digitization process anew in its entirety. Thus, it is practically difficult to reproduce this corpus from the original analogue material. The original images taken from the original newspaper pages are, however, available at an on-site NLS data lab open to researchers. Hence, any researcher with access to the on-site lab can freely run our code to reproduce our corpus.
We also study intercoder reliability for the task of enriching the corpus with additional metadata. High values in the measures of intercoder reliability indicate that the different coders extract the same information from the same page. In Table 2 we present three measures of intercoder reliability: agreement, Cohen’s κ, and F1 score (Artstein and Poesio 2008; Sokolova and Lapalme 2009). Agreement is simply a measure of how often the coders agree, while Cohen’s κ also incorporates how often the coders might agree just by chance.
Intercoder Reliability.

Table 2 shows that intercoder reliability is lowest for task 2. We manually explore where disagreement among the annotators occurs. The most disagreement stems from a full-page advertisement. One of the annotators has missed the small text indicating the text is indeed an advertisement and not journalistic editorial content. The manual examination of the disagreement indicates that most errors are avoidable, and thus the randomness in the data curation reducible. We believe that the availability of the code used to create the corpus, and the reasonably high intercoder reliability, make the reproducibility of the corpus relatively high.
Our results, summarized in Table 3, indicate that we need to work closely with the source material to avoid erroneous conclusions in cross-time studies.
Summary of the Quality (from Low to High) with Regard to Our Case Study Using Keyword Search to Measure the Salience of Immigration Discourse in Swedish News Media from 1945 to 2019.

Discussion
All empirical studies include uncertainty due to potential errors structures in data. These errors affect the validity and reliability of the research. The social sciences have gained rich experience using computational text analysis methods for large-scale corpora over recent decades. We suggest that it is now time to turn to a systematic analysis of the role of data quality in scientific inference from textual data. It is time to open the door into the messy data kitchen.
All types of data can be erroneous, but “what is important is to know the type and form in order to be able to gauge its effects” (Franzosi 2004:172). Creating a multifaceted textual corpus for diverse social inquiry is no quick and easy task. It typically requires time- and cost-intensive manual labor, particularly if it includes digitization procedures. Because of limited resources, researchers must consider which errors they wish to reduce and which ones they can afford to reduce. In this article we have introduced the total corpus quality framework to aid in the systematic analysis of these decisions. Breaking down total corpus quality into its components, researchers can identify where the smallest investments may produce the most significant impacts, yielding better scientific results from textual data.
Listing the different error structures may lead us to believe that the goal for researchers is to minimize all error sources. Two facts may make this difficult. First, in most situations, researchers work under resource constraints. Creating an error-free corpus is simply unaffordable, and so we must instead balance the costs of reducing different errors to minimize the total error given the resources at hand. For example, given unlimited resources, we could create an error-free processed machine-readable corpus. This is, clearly, only a researcher’s dream; in practice, researchers must make decisions to maximize total corpus quality given limited resources.
Second, there are trade-offs. We can improve total corpus quality in one aspect while reducing it in another. For example, reducing the TRE for a particular subgroup (e.g., all audio from podcasts at the top of the charts) will reduce the total error of the corpus but simultaneously reduce corpus comparability.
Hence, this framework does not solve all problems. Instead it helps systematically discuss the trade-offs that inevitably guide the curation of text data and the design of text-analytic studies. It is not necessary to produce a numerical estimate for all dimensions and components of the total corpus quality framework. Instead, we suggest viewing our framework as a tool for evaluating the strengths and limitations of a corpus given a specific research question. Moreover, researchers can use it to identify different areas to improve the quality of the corpus. Researchers can use the introduced error types and quality dimensions and their effects on bias and variance to evaluate and discuss the reliability and validity of scientific insights based on a specific corpus. We believe, like Amaya et al. (2020), that similar frameworks should be developed for other nontraditional data, such as images, in the future. Although we continue to face challenges in creating best practices and easy-to-use rules of thumb for how best to estimate and correct what weakens the “fitness for use” of textual data, we consider the introduced framework a first step in that direction.
Supplemental Material
sj-docx-1-srd-10.1177_23780231221135523 – Supplemental material for From Documents to Data: A Framework for Total Corpus Quality
Supplemental material, sj-docx-1-srd-10.1177_23780231221135523 for From Documents to Data: A Framework for Total Corpus Quality by Miriam Hurtado Bodell, Måns Magnusson and Sophie Mützel in Socius
Footnotes
Acknowledgements
We thank Karl Berglund, Maria Brandén, Lars Björk, Jacob Habernik, Simon Hengchen, Johan Jarlbrink, Marc Keuschnigg, Fredrik Norén, Etienne Ollion, Pelle Snickars, and Daniel Thorburn for their valuable comments on earlier drafts. We thank the NLS for granting access to their vast digitized newspaper archive. Finally, we dedicate this paper in memory of Lars Lyberg (1944–2021).
Funding
The author(s) disclosed receipt of the following financial support for the research, authorship, and/or publication of this article: Computations were enabled by resources provided by the Swedish National Infrastructure for Computing at Tetralith, partially funded by the Swedish Research Council through grant agreement 2018-05973. This research has been funded by the Swedish Research Council (2018-05170). Måns Magnusson was also partially funded by 2018-06063 and Sophie Mützel by the Swiss National Science Foundation (407540_167214).
Supplemental Material
Supplemental material for this article is available online.
Notes
Author Biographies
References
Supplementary Material
Please find the following supplemental material available below.
For Open Access articles published under a Creative Commons License, all supplemental material carries the same license as the article it is associated with.
For non-Open Access articles published, all supplemental material carries a non-exclusive license, and permission requests for re-use of supplemental material or any part of supplemental material shall be sent directly to the copyright owner as specified in the copyright notice associated with the article.