
Abstract
The authors use multiple logistic regression techniques to investigate whether individuals’ occupation, nativity, race, and ethnicity predict residential proximity to large-scale energy infrastructure in Providence, Rhode Island, in 1880 and 1930. Results indicate that in 1880, environmental risks associated with urban energy infrastructure fell most heavily on working-class immigrants; by 1930, those risks disproportionately affected the city’s small population of African American and Latinx residents. Across this 50-year span, environmental inequality racialized such that Providence’s gas lines effectively came to describe the city’s sharpening color line. The article concludes with a discussion of how a historical perspective can help clarify the dynamic relationship between environmental risk and urbanization in the (re)production of racial, ethnic, and economic inequality.
Accumulated evidence from numerous studies set in the contemporary (post-1970) period demonstrate that racial and ethnic disparities indelibly shape environmental inequality in American cities: urban minorities consistently experience disproportionate burdens of pollution and other environmental risks compared with urban whites (recent reviews include Banzhaf, Ma, and Timmins 2019; Muller, Sampson, and Winter 2018; Shao et al. 2022). Has it always been so?
In beginning to address the question, we examine the link between environmental risk and racial and ethnic inequality during an earlier period, using multiple logistic regression techniques to investigate whether individuals’ occupation, nativity, race, and ethnicity predict residential proximity to large-scale energy infrastructure in Providence, Rhode Island, in 1880 and 1930. Our goal is to advance understanding of the role environmental risk has played in shaping the social organization of urban neighborhoods during a span of U.S. history when American cities were undergoing intense industrial, demographic, economic, and socioenvironmental change. This period was very different from our own, lacking many of the social achievements—civil rights legislation, municipal zoning laws, hazardous waste regulation, pollution abatement technologies, or an environmental justice movement, to name a few—that provide a standard backdrop for contemporary quantitative studies of environmental inequality and associated theories. Where extant studies rely mainly on hazardous site data produced since the 1980s, with a few reaching back as far as the 1950s (Frickel and Elliott 2018; Marlow, Frickel, and Elliott 2020; Sicotte 2016), the late nineteenth and early twentieth centuries remain virtually untouched by quantitative environmental inequality scholars. Following environmental historians whose research has shown cities at the time were often rife with workplace and community injustices associated with industrialization and waste (Colten 2002; Cruikshank and Bouchier 2004; Taylor 2016), in the present study we use period-specific quantitative data to assess the changing relationship between environmental risk and social inequality.
Results reveal clear and consistent patterns: in 1880, environmental risks associated with urban energy infrastructure fell most heavily on working-class immigrants; by 1930, those same risks disproportionately affected the city’s small population of African American and Latinx residents. Across this 50-year span, environmental inequality racialized. Moreover, the transformation was extreme. At the beginning of our study period, few if any Black and Latinx residents lived in neighborhoods hosting large-scale energy infrastructure. By the end of our study period, minority residents overwhelmingly occupied those risk-burdened neighborhoods and streets. In short, the evidence suggests that the geography of environmental risk influenced where in the city racial and ethnic residential settlement patterns initially began to fix in place at the neighborhood scale, setting in place a long-term pattern of spatially unequal segregation.
In developing this argument, we aim to make three distinct contributions to the quantitative environmental inequality literature. First, the study is set in a period of U.S. history before large-scale segregation developed as a central feature of American cities, providing an important but understudied context for investigating processes of environmental inequality formation (Pellow 2000). Second, we use individual-level data to measure environmental inequality at historically appropriate scales of enumeration districts (EDs) and street segments: smaller geographical units that allow analysis of environmental inequality at finer scales of spatial organization. Third, we introduce new computational techniques for extracting energy infrastructure data from historic city maps and describe the unique set of environmental hazards associated with the production of “manufactured gas,” an important but little-studied energy source that was common during the study period and represented a major source of urban environmental risk (Tarr 2014).
Manufactured gas, coal gas, or “town gas” involved superheating coal in large steel retort ovens, then bathing the resulting gases in a lime-based solution to draw off impurities. The purified gas then was pumped into large cylindrical tanks or “gas holders” for eventual distribution through growing networks of underground pipes to residential, commercial, and municipal consumers in thousands of cities and towns across North America and Europe. In addition to delivering an estimated 15 trillion cubic feet of gas between 1890 and 1950 (Castaneda 1999), U.S. coal gasworks also generated upward of 11 billion gallons of toxic waste (Radian Corporation 1985). These residual “coal tars” contain hundreds of toxic compounds, including polycyclic aromatic hydrocarbons, phenols, volatile aromatics, inorganics such as ammonia and cyanide, and a long list of metals, including arsenic, cadmium, lead, and mercury (Thomas and Lester 1994). Slow to biodegrade in soils and water, these legacy wastes pose serious environmental health threats today; a fraction of these historical sites appear on contemporary U.S. Environmental Protection Agency Toxic Release Inventory and Superfund hazardous site lists (Hatheway 2012). However, in this study we are concerned with the acute risks manufactured gas infrastructure (MGI) posed for those living nearby during the industry’s heyday. Next, we consider the relevant theoretical contexts for our study.
Theoretical Context
Residential Segregation and Urbanization
Racial and ethnic residential segregation involves the physical separation of racial and ethnic groups within a set geographical area, such as a city, county, or neighborhood. For more than a century, sociologists have recognized the spatial organization of racial and ethnic difference as a defining feature of urban life and social inequality in the United States (Du Bois 1899). Although the scale and level have fluctuated over time, patterns of racial and ethnic residential segregation have proved to be a remarkably widespread, intense, enduring, and consequential type of spatial regime (Logan 2013). Scholars have traced its development in the twentieth century across three distinct historical stages (Cutler, Glaeser, and Vigdor 1999).
The first stage, from 1890 to 1940, roughly corresponds with our study period and was characterized by increasing racial segregation at the neighborhood level. In 1890, African American city dwellers lived in neighborhoods that were 27 percent Black on average; by 1940 their neighborhoods were 43 percent Black (Cutler et al. 1999:456). Important new research by Logan, Bellman et al. (2020) maps the consolidation of Black urban space during this period at finer spatial scales using georeferenced street and house address data. Their research shows that in 1900, urban neighborhoods across the country appear relatively integrated, but this was because segregation was organized from street to street. Black and white urban residents may have shared neighborhoods, but they tended to not live on the same streets or in the same buildings. This pattern changed over the next few decades as the industrial economy expanded, rural and Black urban migration continued, cities grew in size and density, and the post–Civil War racial formation institutionalized in southern and northern cities (Omi and Winant 1994). By 1930, most African American city dwellers lived in majority-Black census EDs (Logan, Bellman, and Minca 2020).
Racial and ethnic segregation “consolidated and expanded” during the second stage, from 1940 to 1970 (Cutler et al. 1999:456). Black migration combined with white flight from urban centers solidified neighborhood-level segregation as the dominant urban spatial logic that, in its most extreme form, confined many Black Americans to racially isolated neighborhoods where residents’ social, economic, and political marginalization was Apartheid-like in its intensity and inhumanity (Massey and Denton 1993). By 1970, on average, African Americans lived in neighborhoods that were 68 percent Black. Over the next two decades (Cutler et al.’s third stage) levels of urban segregation tapered off, even amid some evidence of modest declines in some cities (Logan 2013). As a new report from the University of California, Berkeley, shows, however, among the 113 U.S. cities today with populations of more than 200,000, only two—Colorado Springs, Colorado, and Port St. Lucie, Florida—are racially integrated (Menendian, Gambhir, and Gailes 2021; Othering & Belonging Institute 2022b). 1 Among 209 metropolitan areas with populations of more than 200,000, just 40 have become less segregated since 1990, while more than 80 percent (169) have grown more segregated (Menendian et al. 2021; Othering & Belonging Institute 2022a). Overall, racial and ethnic residential segregation remains high (Faber 2020; Krysan and Crowder 2017) and complex changes in income-based segregation have been shown to interact with racial and ethnic settlement patterns in ways that both complicate and reinforce enduring urban racial and ethnic inequality (Jargowsky 2018; Logan, Foster et al. 2020).
Inequality scholars have documented the “wide-ranging and complex political, socioeconomic, and discriminatory forces coupled with patterns of industrialization, disinvestment, and development” (Morello-Frosch and Lopez 2006:181) that have shaped urban segregation in recent decades. Numerous mechanisms produce and reinforce segregated and unequal urban geographies and operate at multiple levels. At the largest scale, residential geography is affected by federal involvement in housing credit (Logan 2016; Massey and Denton 1993), segregated public housing policy (Rothstein 2017), and “policy-driven investments in place” (Faber 2020:741). Within-city patterns are influenced by exclusionary zoning practices (Silver 1991; Trounstine 2018), development and redevelopment processes influenced by growth machines (Molotch 1976) and disaster recovery machines (Pais and Elliott 2008), and even architectural practices that build racial and ethnic exclusion into the physical design of buildings (Schindler 2015). At smaller scales, segregation is perpetuated through discriminatory behavior on the part of real estate agents through racist “steering” (Besbris and Faber 2017) and racially restrictive covenants (Gotham 2000), among others. At each level, policies and practices that perpetuate racial and ethnic segregation acquire inertia and momentum (Krysan and Crowder 2017).
These remarkably durable structures are also remarkably consequential for urban residents, shaping a wide range of social outcomes. For example, racial and ethnic segregation affects school quality (Owens and Candipan 2019) and thus children’s educational success (Card and Rothstein 2007; Reardon, Kalogrides, and Shores 2019). It has negative consequences for residents’ health (Ellen, Cutler, and Dickens 2000), unemployment duration and job accessibility (Dawkins, Shen, and Sanchez 2005), educational attainment and job earnings (Steil, De la Roca, and Ellen 2015), and intergenerational mobility (Chetty et al. 2014). As we describe next, racial and ethnic segregation is also an important factor shaping minority residents’ disparate burden of environmental risk.
Environmental Inequality
Environmental inequality “results from the unequal distribution of the risks and benefits that stem from interactions with our environment” (Ganzleben and Kazmierczak 2020:2). Since the late 1980s, quantitative research conducted in the United States has demonstrated consistent relationships between low-income, indigenous, immigrant, and minority communities and disproportionate environmental risks and health impacts associated with industrial production, waste disposal, and hazardous facility siting (Banzhaf et al. 2019; Mohai and Saha 2015a; Shao et al. 2022). For example, marginalized communities experience higher exposure to air pollution (Houston, Krudysz, and Winer 2008; Lopez 2002; Rubio, Grineski, and Collins 2021), industrial hazards (Crowder and Downey 2010), and toxic waste facilities (Boer et al. 1997; Mohai and Saha 2006). Inequalities in exposure to environmental hazards in turn magnify inequalities in various social and health outcomes, from asthma (Grineski 2007), psychological stress (Gee and Payne-Sturges 2004), and cognitive function (Muller et al. 2018) to school attendance (Berman et al. 2018) and long-term economic well-being (Isen, Rossin-Slater, and Walker 2017), and compound structural vulnerability as well (Liévanos 2019).
In much of this work, scholars conceptualize environmental inequality as a spatial relationship, whereby disproportionate risk is a function of the proximity of people to environmental hazards in lived space (Arora and Cason 1999; Downey 2006; Manduca and Sampson 2019). Sociodemographic information from the U.S. census is used to represent people using polygonal population aggregates such as counties (e.g., Jorgenson et al. 2016), ZIP codes (e.g., United Church of Christ Commission for Racial Justice 1987), or census tracts (Mohai and Saha 2015b), as data on households and individuals are not available after 1950. 2 Researchers rely on geolocated point data, usually from government databases, to provide geographical, organizational and toxicological information on environmental hazards. Hazardous industrial sites, toxic releases, waste disposal sites, underground storage tanks, and brownfields were largely unregulated prior to the 1970s (Andrews 1999) and most state and federal environmental agencies did not begin collecting hazardous site data until the 1980s.
The limited historical availability of government data has meant that extant research relies heavily on data from the 1980s or later, leaving the larger body of knowledge generated from quantitative studies historically truncated. Some studies identify changing temporal patterns prior to the 1980s, but they are the exceptions. These include a few studies marshalling government data from the 1970s and 1960s (e.g., Mohai and Saha 2015b), others using state manufacturing directories that push time frames back to the 1950s (e.g., Frickel and Elliott 2018; Sicotte 2016), and a set of studies using historical maps of London, Ontario, Montreal, Quebec, and Michigan’s Upper Peninsula from the late nineteenth century onward (Hayek et al. 2010; Trepal and Lafreniere 2019; Trepal, Lafreniere, and Gilliland 2020).
Even so, it remains the case that most of what we know from statistical analyses of environmental inequality covers a historical period following the high-water mark of racial and ethnic segregation in American cities in the 1970s (Cutler et al. 1999). This was also a time when increasing public awareness of the risks of urban industrial hazards fueled political contention around toxics and hazardous facility siting across the country (Szasz 1994), suggesting to some that environmental inequality is in part a product of the late 20th century (Saha and Mohai 2005). Although qualitative historical analyses (e.g., Colten 2005; Taylor 2009) indirectly challenge this latter suggestion, the broader point is that among the hundreds of such studies published to date virtually all are set within already segregated urban geographies. An open question is whether there is evidence of environmental inequality in the first half of the twentieth century and, if so, how its scale and patterning compares with subsequent decades.
Addressing this question will require studies of the relationship between people and environmental risk during a period of U.S. history when segregated urban geographies had yet to develop into the large-scale racialized spatial orders that had become central features of many American cities by the 1970s. Such studies will also need to identify types of environmental risk that are temporally appropriate to the historical period in question. In the following section we summarize the history of the manufactured gas industry, one of the more dangerous, visible, and prevalent sources of late nineteenth and early twentieth century urban pollution and our study’s indicator of environmental risk.
Historical Context
The Manufactured Gas Industry
The manufactured gas industry emerged first in Britain, rooted in late eighteenth-century advances in organic chemistry, industrial engineering, and business management (Tomory 2012). Large stocks of bituminous coal aided the industry’s expansion, and by 1850, “760 towns in Britain and Ireland contained at least one gasworks” (Thorsheim 2006:136). A Rhode Islander, David Melville, built the first gas lighting systems in the United States around 1813. Melville installed his gas systems, modified from the British design, in a Providence cotton mill and a Narragansett Bay lighthouse. Other systems developed by a Philadelphian artist turned entrepreneur named Rembrandt Peale were installed in a museum (America’s first, at the time located in Independence Hall), a theater, and his family residence (Castaneda 1999). Such smaller systems grew common throughout the nineteenth century.
Larger gasworks, designed to generate and distribute gas for general use, developed first in cities along the eastern seaboard, starting with the Gas Light Company of Baltimore (established in 1816) and spreading across the country over the next few decades (Castaneda 1999). U.S. census records document the expansion, with the number of listed municipal gasworks rising steadily from 30 in 1850 to 390 in 1869, 742 in 1890, and 1,296 by 1909 (cited in Tarr 2014:110). The largest of these municipal gasworks were truly enormous. Spanning multiple city blocks, municipal gasworks were usually located near ports or rail depots to better economize access to bituminous coal imported from England or hauled by rail from coalfields in Virginia, western Pennsylvania, and elsewhere. As early as 1850, for example, the gasworks in New Orleans consumed 20 tons of coal per day, “fed into retorts by about fifty enslaved mechanics and laborers working in shifts around the clock,” and generated about 200,000 cubic feet of gas daily (Zallen 2019:121). As technology improved and demand increased, production capacities of gasworks grew exponentially. In London in the early twentieth century, the South Metropolitan Gas Company’s East Greenwich plant transformed 2,200 tons of coal into about 23 million cubic feet of gas, piped daily to London homes, businesses, mills, and public buildings (Thorsheim 2006:142–43). The largest American gasworks were built with similar capacities (Hatheway 2012).
The physical architecture of these plants was otherworldly, a smoky, stinking jumble of scrubber towers, long banks of retorts and furnaces, condensation tanks, pipes, pits, wells, and heaping piles of coal, coke, and lime. Most characteristic of all were the gas storage tanks, or “gasometers,” large cylindrical structures measuring up to hundreds of feet in diameter and often reaching several stories high (Hatheway 2012). Visible for miles when not occluded by smoke, the gasometers became iconic features of late nineteenth-century and early twentieth-century urban industrial landscapes (see Figure 1). Less visible were miles of buried gas lines, metered buildings, district gasometers for remote distribution, and the small armies of skilled and unskilled labor that formed the broader human, technological and organizational infrastructure of manufactured gas production, distribution, and use. Larger cities might host several dozen production and distribution sites, and by 1900 even smaller, remote cities would have had at least one manufactured gas plant (Hatheway 2012).
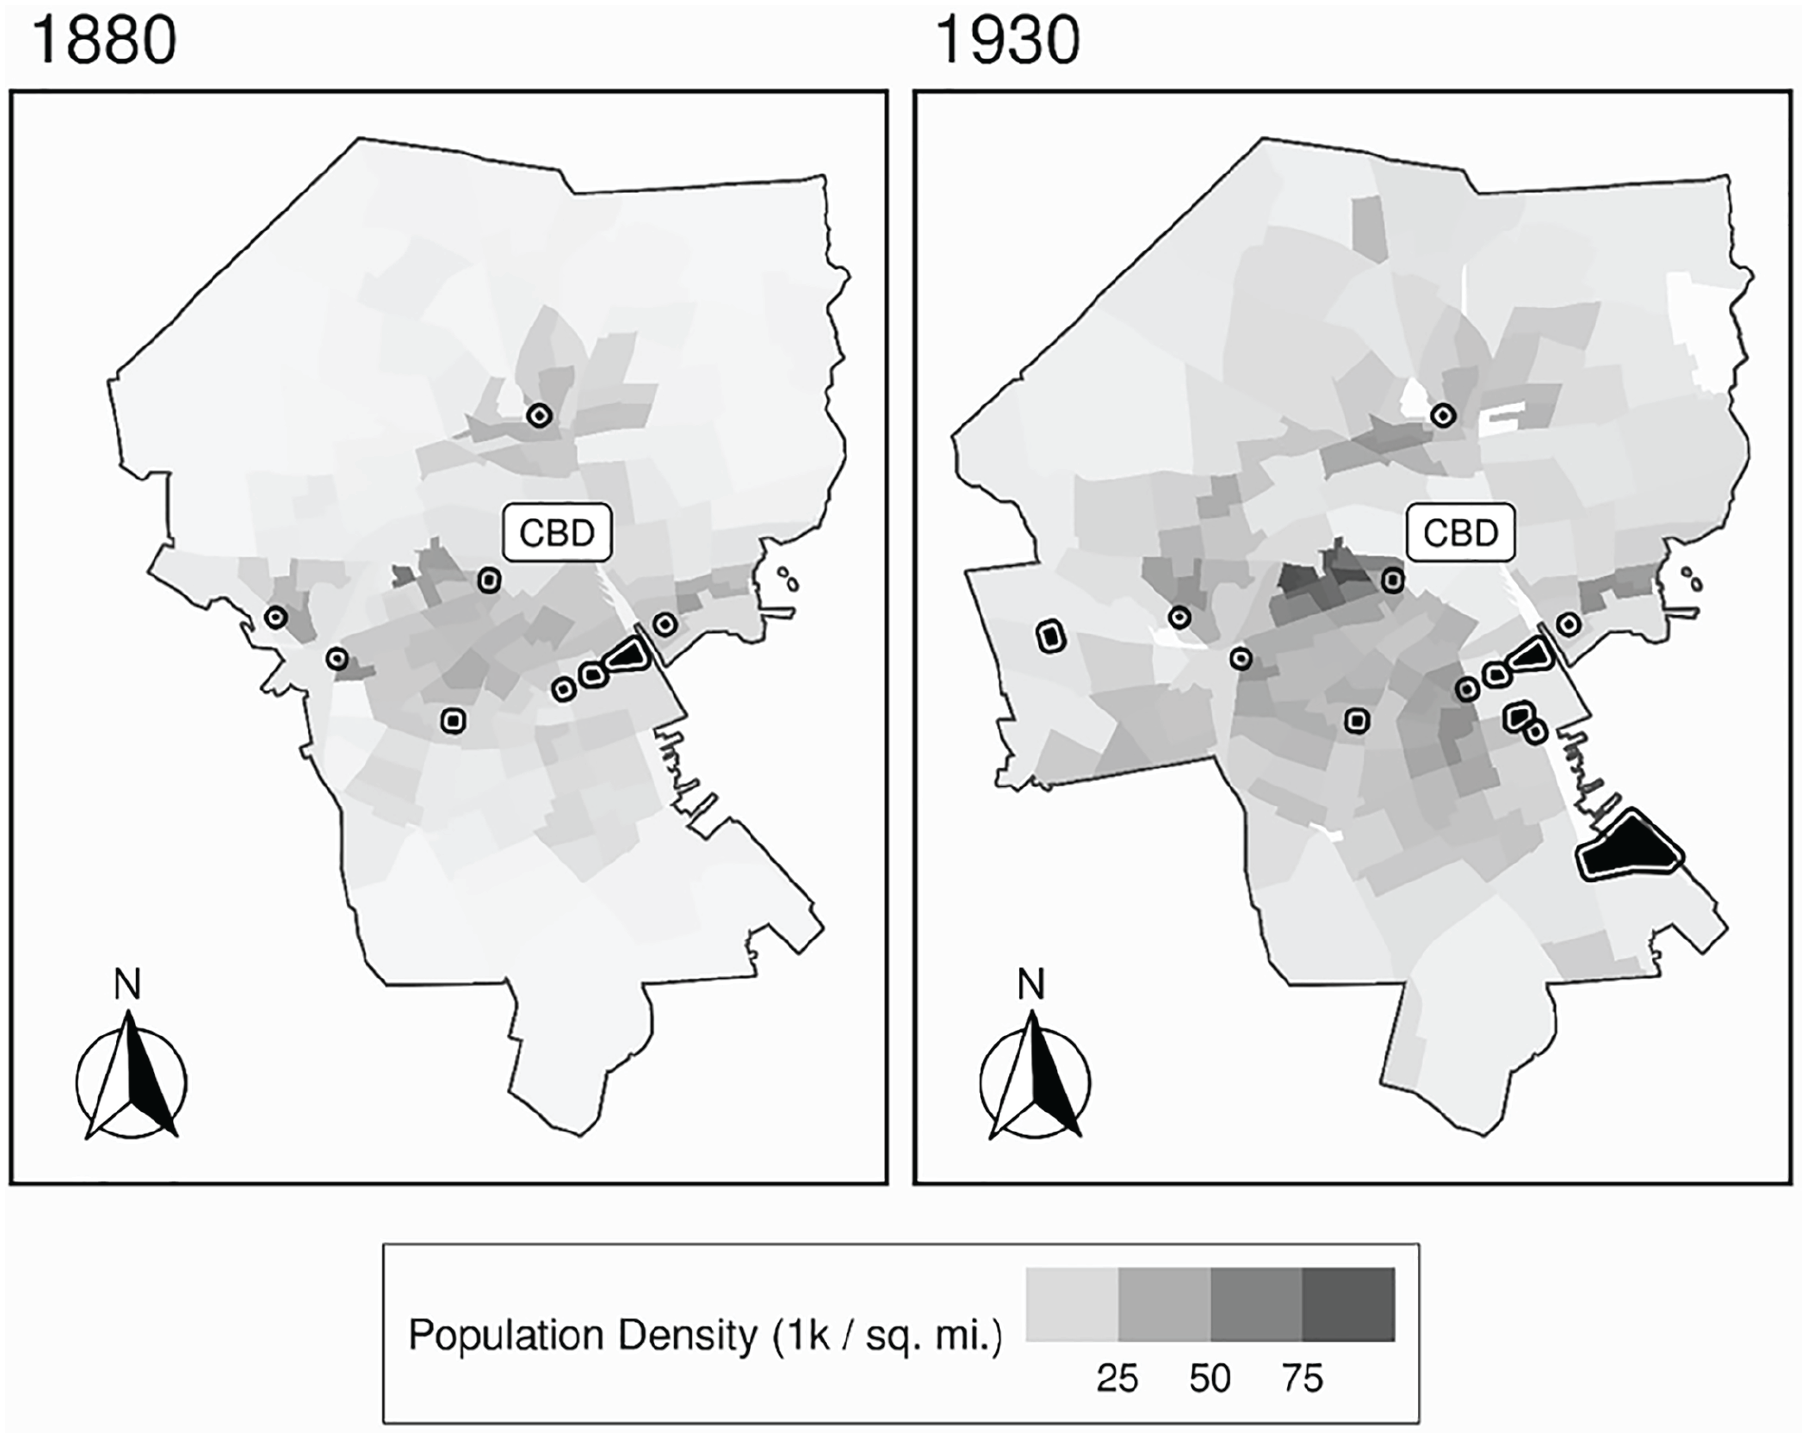
Changing political boundaries, population density, and energy infrastructure in Providence, Rhode Island (1880 and 1930).
Promoted by the editors of Scientific American as “an agent of democracy, equality, and freedom” (Zallen 2019:98), the plants and associated infrastructure attracted a diverse group of opponents as well, including workers, neighbors, businesses, and property owners. Smoke, noise, and stench were common complaints, as were wilted vegetation and poisoned ground and surface waters that fouled wells, clogged sewers, and decimated local fisheries (Tarr 2014; Thorsheim 2006). In 1833, a citizen’s petition to the Philadelphia City Council warned against the new gasworks being planned for that city, noting, The waters of the Delaware and the Schuylkill [rivers], now considered the most pure and salubrious in the world . . . must soon, we fear, experience the deterioration which has reduced the Thames to the present impure and unhealthy state, for no reservoir will be able to contain the immense fetid drains from such an establishment. . . . Salmon, smelts and other fish formerly caught in the Thames have nearly all disappeared. (Quoted in Castaneda 1999:27)
Other common complaints involved illness, injury, suffocation, and death from explosions, fires, gas leaks, and toxic exposures. Lung cancer, melanoma, respiratory problems, skin and eye ailments, headaches, nausea, and “choleric pains” were prominently reported health effects (Thorsheim 2006:144–45). Other injuries were economic: a brewer whose well water was fouled by gasworks pollution, an oyster company whose shellfish beds suffered a similar fate, a theater owner whose establishment burned (Tarr 2014; Thorsheim 2006). Property owners worried about declining real estate values. As noted by one London newspaper in 1864, “Wherever a gas-factory—and there are many such—is situated within the metropolis, there is established a centre whence radiates a whole neighbourhood of squalor, poverty, and disease” (Thorsheim 2006:140–41).
Despite wide-ranging public concerns, government regulation of the manufactured gas industry was limited. In the early decades, efforts at regulation rarely extended beyond local contracts that set gas prices and established service areas for a given period of time. Other than these basic operating agreements, but nineteenth century gas companies were “essentially unregulated” (Castaneda 1999:53). By 1909, 29 states had established state gas commissions, which worked to regulate gas quality, price, and service provision. Environmental and health concerns related to pollution and waste disposal were adjudicated locally, mainly through the courts and municipal government. However, as Tarr (2014) noted, penalties handed down by judges were often too small to change industry behavior, and government waste disposal rules were seldom enforced. Through the end of World War I, “industry seemed to take little systematic notice of the pollution caused by its waste-disposal methods in spite of nuisance suits and state and municipal legislation” (Tarr 2014:127). By then, the manufactured gas industry was on the edge of decline, soon to be swept aside in a wave of consolidations and mergers led by oil, natural gas, and pipeline companies that had sprung from Texas oilfields two decades earlier. By 1950, manufactured gas was gone, many of the iconic gasometers torn down, and the industry’s “toxic legacy” (Tarr 2014) gradually lost beneath the ever changing landscapes of American cities, including Providence.
Urbanization and Energy Development in Providence, Rhode Island
The decades during which Providence’s manufactured gas industry grew and declined marks a period of significant economic, demographic, and spatial change. Even before 1880, the city’s rising prominence as an industrial leader in regional markets for cotton and woolen textiles, jewelry and silverware, and industrial machinery made it Rhode Island’s industrial and commercial capital and, beyond the state, the “metropolitan center of southern New England” (Coleman 1963:160). Manufactured gas was part of this development, with two gas utilities, Citizen’s Gas Light Company and Providence Gas Company, vying for customers and city contracts, their gasworks located near the docks on opposite sides of the Providence River. From 1850 to 1885, an industrial plant, the Atlantic-Delaine gasworks, provided gas lighting for the Atlantic Mills textile mill located west of downtown. Six other distribution substations describe the extant MGI in the 1880s. The network of gasholders and pipes fanned out north and west of downtown, mainly hugging lower lying commercial and residential areas developed along the Providence, Moshassuck, and Woonasquatucket rivers (see Figure 1).
Economic development drove demographic growth. By 1880, Providence had cemented its status as a predominantly white city with a large immigrant population concentrated in factory labor and a much smaller population of Black Americans who, throughout much of the nineteenth century, worked menial jobs as dockworkers or day laborers because they were excluded from factory work (Cottrol 1982). By 1930, the city’s population had more than doubled. As the city grew throughout this period, it remained predominantly white and U.S. born, with the proportion of foreign-born, Latinx, and African American residents remaining unchanged or decreasing slightly (see Table 1, in “Analysis and Results”). Even so, minority and immigrant populations increased in real terms. The number of immigrants more than doubled between 1880 and 1930, from more than 27,000 to nearly 66,000; the number of African Americans increased by 60 percent, from 3,422 to 5,486; and the Latinx population, which remained tiny throughout the study period, still grew exponentially from 202 people to 574. Laborers also saw a 5 percent proportional decline relative to the total workforce as labor markets adjusted to the economic crisis, but laborers also grew in real numbers, from 30,000 to 60,000.
Population Statistics, Providence, Rhode Island, 1880 and 1930.

Note: ED = enumeration district.
To accommodate the growing city’s new demands for space, city boundaries expanded to the north, west, and south. Neighborhood development and the consonant increase in urban density was uneven, however. By 1930 most of the city’s expanded borders had filled in, with city residents concentrated in working class neighborhoods located in north, central and south Providence. Yet even as urban boundaries expanded, population density also more than doubled, from just over 6,000 people per square mile in 1880 to nearly 14,000 in 1930. As Figure 1 shows, these more densely populated neighborhoods mirror much of the city’s extant MGI, now connected to the Providence Gas Company’s large gasworks complex in south Providence near the mouth of the Providence River.
As the city’s population grew, geographical boundaries expanded and urban density increased, did minorities, immigrants, and laborers bear disproportionate environmental risks associated with living near MGI? This question frames our statistical analysis, which we develop in the next two sections.
Data, Measures, and Analytical Strategy
The analysis that follows combines historical spatial data on MGI with individual-level population data from the 1880 and 1930 U.S. censuses. We extracted MGI site data from digitized Sanborn Fire Insurance Company maps for Providence, Rhode Island, held by the U.S Library of Congress. Between 1867 and the late 1960s, Sanborn produced uniform, highly detailed, building-level maps for more than 12,000 cities and towns in the United States and Canada. Many cities were mapped at multiple points in time, making these maps particularly valuable for historical urban research (Patton, Lobben, and Pape 2020), including detailed site histories (Bookspan, Gravel, and Corley 2007), industrial archaeology (Kolodziej et al. 2004; Wright 1983), and urban- and region-scale historical geographical analysis (Kodama 2013; Rosen 2015; Sauder 1980). Available maps within the study period feature a range of decades—1889, 1899, 1905, 1920, and 1956—and provide reasonably close coverage of the industry’s most intense period of development and decline.
Sanborn map series can run for many hundreds or even thousands of pages for a single city and can present significant data collection challenges. A challenge for this study is that MGI sites appear and disappear as irregular features of the built environment over long spans of time. For this reason, visual inspection and manual coding of individual map pages is time and labor intensive and thus prone to coder error at an urban scale, inhibiting larger regional or multicity comparative studies. To overcome this problem, we developed a novel computational pipeline on the basis of an ensemble of feature extraction and machine learning tools. As described in Tollefson, Frickel, and Restrepo (2021), the publicly available pipeline (available at https://github.com/TollefsonJ/Detect_MGP) identifies circular features of Sanborn maps that correspond to so-called gas holders: the large cylindrical tanks used to store manufactured gas at central production sites and to maintain gas line pressure at district substations (see Figure 2). Using this tool, we generated a cumulative list of relevant sites from the map corpus. We then conducted additional historical research to confirm that the MGI sites were present as landscape features during the two study years, identifying 9 in 1880 and 13 in 1930.

Providence Gas Company gasworks with circular gas holders.
To measure residents’ proximity to historically extant MGI in 1880 and 1930, we use individual-level population data linked to EDs and street segments (Logan et al. 2011) through georeferenced point data based on household address. As used by the U.S. Census Bureau prior to 1960, urban EDs include no more than 4,000 inhabitants and thus tend to be much smaller than contemporary census tracts. For comparison, today Providence consists of 39 census tracts despite little change in the geographical boundaries of the city, a level of spatial detail dwarfed by the 133 and 154 EDs used in 1880 and 1930, respectively. The boundaries of EDs were “clearly described by civil divisions, rivers, roads, public surveys or other easily distinguished lines” (Perlmann 1979:280). Smaller still are street segments, which we operationalize as continuous streets contained within a single ED, following Logan, Bellman et al. (2020). Street segments in our study begin and end at ED borders and count all individuals living on both sides of the street. 3
Combining the two types of historical data to develop proximity measures required four additional steps. Starting with the data for 1930, we began by intersecting MGI site polygons with ED maps to identify the host district for each MGI site for that year. Next, because 1930 population data are currently unavailable as georeferenced files, we followed the method outlined by Logan, Bellman et al. (2020) to aggregate individuals within individual street segments. For the third step, we selected streets directly proximate to MGI sites by manually coding Providence map pages from the 1920–1921 map series, the temporally closest Sanborn map to the 1930 population data, and linked those streets with the host EDs identified in step one. Finally, we identified affected residents from individual census records using two measures of spatial proximity: individuals living in an ED containing at least one MGI site (a variant of the “unit-hazard coincidence” method; Mohai and Saha 2006) and individuals living on street segments that intersect MGI blocks. We used similar procedures to develop proximity measures for 1880, again using street names from the temporally closest (1889) Sanborn map. One important difference is that we assigned 1880 georeferenced household address point data to 1930 EDs, standardizing EDs to 1930 boundaries. This allows direct comparison of city residents’ proximity to MGI sites at ED and street segment levels over time. Next, we present results from multiple logistic regression analyses predicting residential proximity to extant MGI in 1880 and 1930 at different spatial scales: EDs and street segments. This analytical strategy allows us to investigate changes in the geography of environmental risk and stratification of Providence neighborhoods. 4
Analysis and Results
We conducted multiple logistic regression analyses to determine whether individuals’ occupation, nativity, race, and ethnicity predicts proximity to manufactured gas production and storage facilities and whether this relationship changed between 1880 and 1930. Because individual and household income data are not available in the 1880 census, we use occupational data as a proxy for class structure. Using the Integrated Public Use Microdata Series variable OCC1950, we constructed binary variables for individuals holding labor, service, and professional occupations, with those outside the labor force as our reference category (Ruggles et al. 2021). 5 We constructed binary variables for immigrant status (foreign born vs. U.S. born), race (African American vs. non–African American), and ethnicity (Hispanic vs. non-Hispanic). 6 We also include control variables for gender (male or not), marital status (married or not), and housing type (group quarters or not). As much as possible, we constructed age categories to be socially meaningful, based in part on an 1883 Rhode Island law defining compulsory education for children aged 7 to 15 years and assuming that people’s primary employment and reproductive years followed from ages 16 to 35 years, our reference category. As noted, we assess proximity using a unit-hazard method whereby individuals are considered proximate to MGI when they reside within the same ED boundaries or live on the same street segment. 7 Descriptive statistics are presented in Table 1.
Because census records for 1930 lack household point locations or a georeferenced street network, we are unable to test and control for spatial autocorrelation at the individual level. We address this data limitation in two ways. First, to ensure that our results are robust with respect to spatial autocorrelation at the ED level, we conducted a series of multilevel spatial regression models using a queen-based, ED-level weight matrix, using the CARBayes R library (Lee 2013). These models were structured to predict the relative likelihood that a randomly selected individual, living in the same ED or on the same street segment as an MGI site in 1880 or in 1930, would be Black rather than white. Results, available on request, support our argument that environmental risk structured early twentieth-century racial and ethnic disparities. As an additional robustness check, below we present results of a second (aspatial) logistic regression that restricts analysis to residents of MGI EDs, some of whom shared a street with MGI while others did not. This model analyzes the stratification of street-level risk while controlling for unobserved differences between MGI and non-MGI EDs.
Table 2 presents the results of our first, citywide, analysis as odds ratios organized by aggregation unit and year. In 1880, Providence laborers were 11 percent more likely than those outside the labor force to live in MGI EDs. Workers in the services and professions were about 30 percent and 25 percent, respectively, less likely to do so. These odds are replicated at the street segment level for laborers and service workers, though no significant difference is observed for professionals. By 1930, the class-based structure of environmental inequality had strengthened and tightened. Laborers disproportionately lived on MGI streets, while higher status workers were about half as likely to do so. Foreign-born residents and families with young children are more likely to occupy MGI EDs and street segments in both years. These results make intuitive sense given that most working-age immigrant men and women in New England were employed in factory production during the study period (Ruggles et al. 2021).
Odds Ratios Predicting Residential Proximity to Manufactured Gas Infrastructure Sites, Providence, Rhode Island, 1880 and 1930.

p < 0.01. **p < 0.001.
Our findings show social class to be a stable and probably fundamental feature of environmental inequality formation in late nineteenth-century and early twentieth-century Providence. Families of laborers, including disproportionate numbers of children, likely faced disproportionate long-term exposure to the risks of MGI during the industry’s heyday. Thus, occupational class differences, almost certainly reinforced by nativity statuses, organized environmental risk exposure from neighborhood to neighborhood, much as we find today. Class and nativity differences also structured environmental risk from street to street, a finer scale spatial pattern of environmental inequality than contemporary studies have documented.
Results for residents’ race and ethnicity suggest a different story about the changing structure of environmental inequality during this period of history, one in which durable class-based inequality is accompanied by an emergent racialization and spatial intensification. In 1880, African Americans living in Providence were 18 percent less likely than other racial groups to reside in an MGI ED. This is almost certainly because Black workers were excluded from local industrial employment (Cottrol 1982). Fifty years later, as African Americans migrating north to escape the structural racism of the Jim Crow South and in search of economic opportunity in factory employment across the northern United States (Derenoncourt 2022), these odds reversed direction in dramatic ways. By 1930, African Americans were 61 percent more likely than other racial groups to occupy MGI neighborhoods. The city’s Latinx population, although still very small, was also concentrated near the same hazards, with 43 percent higher odds of living in such high-risk neighborhoods relative to non-Latinx residents (p = .011).
For both groups this odds reversal, already quite pronounced, intensified at the street level. In 1880, African Americans were 73 percent less likely than other racial groups to live on an MGI street. In 1930, those same odds were not only reversed but had skyrocketed to more than twice the odds for non-Black residents; for Latinx residents, the odds were nearly 3 times those for non-Latinx residents. In short, by 1930, nonwhite residents of Providence had become exponentially more likely to share a street with MGI facilities than were whites. This was true even though both groups constituted small and stable or shrinking proportions of the city’s growing total population (refer to Table 1). In no small way, it seems, by 1930, Providence’s color line had become coterminous with the gas lines that described the city’s fossil energy infrastructure. The same plants, pipelines, and substations that delivered manufactured gas to city businesses and fancier homes also delivered contaminated air, soil and water along with the continual risk for accidental explosions and fire to the disproportionately affected communities of color living next door or down the road.
As noted, we are unable to control for spatial autocorrelation because we lack georeferenced house address data for 1930. However, we can partially compensate for this limitation by restricting analysis to street segments contained within MGI EDs and then comparing people living on MGI streets with their neighbors living on different nearby streets. Narrowing our analytic focus in this way reduces the degree to which unobserved spatial variation would be likely to matter. Our assumption here is that MGI EDs would likely share certain spatial features (e.g., a river boundary and a larger than average industrial footprint) while streets within those same boundaries would also be more alike than not, for example featuring similar types of housing. We believe that these assumptions are both reasonable and historically justifiable. Table 3 summarizes results and highlights the stark spatial intensification of environmental racial and ethnic inequality.
Odds Ratios Predicting Street-Level Residential Proximity to MGI Sites within MGI Enumeration Districts, Providence, Rhode Island, 1880 and 1930.

p < .01. **p < .001.
The effects of occupation and nativity are unstable over time. In 1880, being foreign born predicts 24 percent greater odds of sharing a street with MGI, compared with native-born residents, whereas employment in the service industries predicts a 30 percent lesser odds compared with nonworkers. In 1930, neither effect is significant, but laborers face about 16 percent greater odds than nonworkers of living on an MGI street. The effects of race and ethnicity are both stronger and more consistent. African Americans who live in MGI neighborhoods in 1880 are 76 percent less likely to live on MGI streets but by 1930 are nearly twice as likely as non-Black residents to do so. Latinx residents in 1930 face much higher odds still, more than 2.5 times greater than non-Latinx residents. This set of findings reinforces and sharpens our earlier claim that as the spatial structure of environmental inequality racialized over time, environmental risk and environmental racism came to follow similar spatial paths, concentrating on the very same street segments. By 1930, even within risky neighborhoods, the growing city’s small population of Black and Latinx residents lived disproportionately on the city’s riskiest streets.
Conclusion
This study offers a rare historical glimpse into how class, nativity, race and ethnicity structured Providence residents’ exposure to environmental risk and how those environmental disparities changed over time. Between 1880 and 1930 foundational class-based forms of environmental inequality gave way to more racially and ethnically structured patterns of residential settlement. The transition was historically consequential. By 1930, the spatial relationship connecting minority households to environmental risk was set in place, tracing a geography of environmental risk that persists in Providence to this day, on a larger scale (Marlow et al. 2020).
As a case study of a smaller northern city, we cannot generalize to larger cities or cities outside of New England, where political history, immigration patterns, labor and race relations, and industrial development differed in important ways. Indeed, future historical research will be necessary to identify the local processes shaping the transformation we find in the quantitative data. Even so, we believe the study demonstrates the distinct empirical, methodological, and theoretical advantages of pursuing a richer, comparative-historical understanding of environmental inequality formation (Pellow 2000) as a longer term historical, political, and spatial process of socioenvironmental change.
Empirically, our findings further contextualize research linking environmental inequality to rising public awareness of the dangers of pollution and of national political responses provoked by those concerns in the 1960s and 1970s (Saha and Mohai 2005). By pushing the time frame of our understanding back by a century, the present study suggests that spatial forms of environmental inequality are not entirely an invention of the late twentieth century but are rooted in much earlier and ongoing socioenvironmental processes of urbanization. Racial and ethnic segregation in Providence began to scale up in the early twentieth century, and it remains a deeply segregated city today, with the fifth highest levels of income inequality among large U.S. cities (Berube and Holmes 2016). Indeed, many of the neighborhoods that played host to MGI 100 years ago are among those most affected by the subsequent intensification of racial and ethnic settlement and the disparate siting of environmentally risky industries (Marlow et al. 2020; Murphy 2016). More basically, our findings suggest that discriminatory facility siting—an outcome variable of choice among early-generation environmental inequality studies (e.g., United Church of Christ Commission on Racial Justice 1987)—is more appropriately understood as a longer term process of legacy waste accumulation in the context of ongoing urbanization. In these ways, building out the empirical record of environmental racial and ethnic inequality with quantitative analyses illustrates how historical data and research can cast contemporary theories and debates in the new light generated by longer-range perspectives (on this general point, see Angelo 2021).
Methodologically, the study demonstrates the value of researchers’ growing capacity to harness newly georeferenced historical population data (Logan et al. 2011) and new computational approaches for recovering detailed spatial information locked away in historical maps, organizational directories, and other primary source material (Bell et al. 2020; Berenbaum et al. 2019; Tollefson et al. 2021; Trepal et al. 2020). With such tools now becoming available, researchers can peer further into the past and train their focus more efficiently and more effectively at smaller scale units of analysis. We have argued that fine-grained analysis of EDs and street segments is appropriate for earlier historical periods when cities were smaller, worker housing stock differed, zoning regulations for industry were nonexistent, and residential segregation was organized at the street level (Logan and Bellman 2016; Massey and Denton 1993).
At these scales, environmental risk comes into clear focus as a key organizing feature of racial and ethnic settlement patterns, a central finding of this study with substantive theoretical implications. As MGI infrastructure developed and extended, racial and ethnic settlement patterns begin to map onto these same spatially uneven networks, suggesting that early twentieth century racial formation was in part a socioenvironmental process, played out through the temporal reorganization of urban space. Rather than an outcome of a prefigured racial order, the geography of environmental risk emerges as an important feature of the conjoint historical processes driving racial and ethnic disparities and neighborhood segregation. In this way, we hope this study might contribute to emerging “critical environmental justice studies” frameworks that embrace multiscalar approaches (e.g., Pellow 2018), as well as the longer term project of embedding the study of historical environmental risk within the discipline’s core concerns relating to urbanization and the (re)production of racial, ethnic, and economic inequality.
Supplemental Material
sj-docx-1-srd-10.1177_23780231221127541 – Supplemental material for When Environmental Inequality Racialized: Historical Evidence from Providence, Rhode Island
Supplemental material, sj-docx-1-srd-10.1177_23780231221127541 for When Environmental Inequality Racialized: Historical Evidence from Providence, Rhode Island by Scott Frickel and Jonathan Tollefson in Socius
Footnotes
Funding
The author(s) disclosed receipt of the following financial support for the research, authorship, and/or publication of this article: This work was supported by the Superfund Research Program of the NIEHS, grants P42ES013660 and 3P42ES013660-14S1.
Supplemental Material
Supplemental material for this article is available online.
Notes
Author Biographies
References
Supplementary Material
Please find the following supplemental material available below.
For Open Access articles published under a Creative Commons License, all supplemental material carries the same license as the article it is associated with.
For non-Open Access articles published, all supplemental material carries a non-exclusive license, and permission requests for re-use of supplemental material or any part of supplemental material shall be sent directly to the copyright owner as specified in the copyright notice associated with the article.