
Abstract
In this article, the authors develop a taxonomy of the micro-mechanisms by which well-studied macro-level structural changes and institutional contexts distribute income and assess this taxonomy empirically. The authors’ taxonomy explicates five distinct micro-mechanisms that operate inside and outside of the labor market to either increase (premiums) or decrease (penalties) income shares. Their analysis of total household income among over 1 million households across 14 countries and 39 years yields four contributions. First, the findings provide “middle-range” evidence regarding the specific micro-mechanisms of each macro-process. Second, premiums are more common micro-mechanisms than penalties, consistent with the phenomenon of “upper-tail polarization” observed in the literature. Third, workplace authority is the most important micro-mechanism operating in the labor market, but the top-income premium is the most important micro-mechanism overall. Finally, the relative importance of the top-income premium is greater for structural change than institutional context, which portends demands for new forms of redistribution.
Scholarly interest in income inequality coincided with the widely observed rising (but varied) inequality trend that began toward the end of the twentieth century (Alderson and Nielsen 2002; Gustafsson and Johansson 1999; McCall and Percheski 2010; Neckerman and Torche 2007). Two key explanations for this trend include structural changes occurring in the macro-economy and the erosion of egalitarian institutions (Alderson and Nielsen 2002; Gustafsson and Johansson 1999; McCall and Percheski 2010; Western, Bloome, and Percheski 2008). The globalization of production, technological change (TC), and financialization are the three most frequently cited sources of structural change (Alderson and Nielsen 2002; Gustafsson and Johansson 1999; Mahutga, Roberts, and Kwon 2017). The strength of organized labor, coordinated wage-setting institutions, and the welfare state are three key institutional determinants of household income inequality that are frequently studied by the power-resource school and others in the social sciences (Alderson and Nielsen 2002; Gustafsson and Johansson 1999; McCall and Percheski 2010).
The literature theorizes multiple micro-mechanisms by which these macro-contexts might affect inequality. Some involve impacts on the returns to differentially skilled workers, including both the “immiseration” of the low skilled and the “take off” of the high skilled (e.g., Alderson and Nielsen 2002; Autor, Levy, and Murnane 2003; Katz and Autor 1999; Mahutga et al. 2017; Wallerstein 1999; Wood 1994). Others focus instead on workplace authority or the returns to particular sectors (e.g., the finance, insurance, and real estate [FIRE] sector) (Mahutga et al. 2017; Lin and Tomaskovic-Devey 2013; Tomaskovic-Devey and Lin 2011). Still others focus upon mechanisms operating outside the labor market among households at the very top of the income distribution (Kenworthy 2017; Roine, Vlachos, and Waldenstrom 2009; Volscho and Kelly 2012). However, no one has examined empirically the precise degree to which these macro-level structural changes and institutions affect the income distribution through these theorized micro-mechanisms or assessed the relative importance of them.
We address these gaps in the field in two distinct ways. First, we develop a taxonomy of five distinct micro-mechanisms through which three types of structural change and institutional context are thought to impact household incomes; we refer to these micro-mechanisms as income penalties and premiums (cf. Brady, Finnigan, and Huebgen 2017). Income penalties include particular labor market characteristics of household earners (low skills) that reduce income on average. Conversely, income premiums include labor market characteristics of household earners (high skills, workplace authority, FIRE-sector occupations) that increase income on average. We also consider mechanisms operating uniquely among top-income households that derive a significant share of their total income from capital income (e.g., Kenworthy 2017; Kuhn, Schularick, and Steins 2018; McCall and Percheski 2010; Rosenberg 2013). Structural change and institutional context affect the distribution of income by exacerbating or ameliorating these penalties and premiums.
Second, we examine these claims empirically by analyzing the income of over 1 million households across 14 countries and 39 years from the Luxembourg Income Study (LIS) Cross-National Data Center. Analyzing household income is important because households are the units at which economic behavior is fundamentally determined and because household composition determines “how individual earnings and other incomes are pooled (or not pooled)” in the realized economy (McCall and Percheski 2010:330). Moreover, income penalties and premiums attributable to labor market and other economic forces should correlate with those attributable to household composition, but most previous research examines these two drivers of distributional outcomes independently (Alderson, Beckfield, and Nielsen 2005; McCall and Percheski 2010; Neckerman and Torche 2007). Our empirical framework allows us to examine the impact of structural change and institutional context on the former net of the latter.
The Micro-mechanisms of Structural Change and Institutional Context: A Taxonomy
The social science literature is clear that structural change and institutional context matter for income inequality. Beginning in the 1990s, social scientists became interested in two distinct kinds of structural changes: the globalization of production and TC (Alderson and Nielsen 2002; Autor et al. 2003; Katz and Autor 1999; Mahutga et al. 2017). More recently, a third type of structural change has captured the attention of social scientists: financialization (Lin and Tomaskovic-Devey 2013; Roberts and Kwon 2017). Social scientists also pay a great deal of attention to the distributional effects of egalitarian institutions associated with the literature on power-resources, including the relative strength of organized labor, the degree of corporatism/wage-setting, and the generosity of the welfare state (Alderson and Nielsen 2001; Bradley et al. 2003; Huber and Stephens 2001; Korpi 1985; Lee 2005; Lee, Kim, and Shim 2011).
In much of this literature, macro-processes are theorized to increase/decrease inequality through their effects on micro-level factors related to skill, occupation, employment sector and income position. However, little research attempts to empirically assess the degree to which the distributional consequences of macro-processes can be attributed to micro-level characteristics. On one hand, many studies regress aggregate indices of inequality on aggregate measures of macro-processes without observing the theorized micro-mechanisms directly (Alderson and Nielsen 2001; Lee et al. 2011; Lin and Tomaskovic-Devey 2013; Mahutga et al. 2017; Roberts and Kwon 2017). Another tradition instead examines temporal dynamics in specific micro-processes (e.g., the premium to a college degree or occupational characteristics) without connecting the two levels of analysis explicitly (e.g., technology; Autor et al. 2003; Katz and Autor 1999). For these reasons, there remains a large degree of uncertainty about which micro-mechanisms link these macro-factors to inequality, as well as their relative importance.
We consider five distinct kinds of micro-mechanisms by which the literature has suggested structural change and institutional context should affect overall income inequality. We refer to these micro-mechanisms as income penalties and premiums: low-skill penalties and high-skill, managerial, FIRE-sector, and top-income premiums. The country-year-wise bivariate correlation between these penalties and premiums and the Gini coefficient for household income are displayed in Figure 1. These associations are consistent with the literature on the distributional effects of structural change and institutional context that evokes these penalties and premiums: smaller penalties are associated with lower inequality, whereas larger premiums are associated with higher inequality. However, it remains to be seen if the frequently studied types of macro-context are related to these penalties and premiums in theoretically consistent ways.

Bivariate association between unconditional penalties and premiums and income inequality (Gini coefficient).
Before a more detailed elaboration of mechanisms, we summarize the general logic of these arguments with the hypotheses that follow from them in Table 1. The first four columns summarize two types of labor market mechanisms. First, by influencing the penalty to low skills, the premium to high skills, and/or the premium to specific sectors (e.g., FIRE), structural change and institutional context affect variance in the returns to labor market participation within the working classes. Second, by influencing the relative bargaining power of labor and management, structural change and institutional context affect the degree of inequality between management and labor. The fifth column lists premiums that are unique to top-income households. As we describe and demonstrate empirically below, this uniqueness stems from the higher ratio of capital to total income among top-income households.
Hypothesized Mechanisms of Structural Change and Institutional Context.

Note: A plus sign indicates a positive effect, a minus sign indicates a negative effect, and “NA” indicates no theorized effect. Positive effects on premiums and negative effects on penalties increase these premiums and penalties. Positive effects on penalties and negative effects on premiums reduce these penalties and premiums. FIRE = finance, insurance, and real estate.
Table 1 shows that globalization of production and skill-biased TC are thought to exacerbate the penalty to low skills and the premiums to high skills, workplace authority, and top incomes. Financialization is thought to affect the premiums to FIRE-sector employment, workplace authority, and top incomes. The three egalitarian institutions are thought to affect the penalty to low skills and the premiums to high skills, managerial authority, and top incomes. In what follows, we catalogue how structural change and institutional context are theorized to drive these five distinct kinds of income penalties and premiums, giving somewhat greater attention to how structural change and institutional context affect the top-income premium (Table 1, column 5) because this literature is newer.
High-Skill Premiums and Low-Skill Penalties
According to classic (i.e., Heckscher-Ohlin) trade theory, production globalization should affect the demand (and thus price) for labor segments differentially, depending on their relative supply in a focal country (Alderson and Nielsen 2002; Wood 1994). In developed countries, the rise of imported manufactured goods from the South reduces the demand for low-skilled labor and increases the demand for high-skilled labor. Holding the relative supply of low- and high-skilled labor fixed, this reduces the relative wage of low-skilled labor and increases the relative wage of high-skilled labor. Thus, we expect the globalization of production to increase the premium to high skills and the penalty to low skills (Table 1, columns 1 and 2).
Whether formulated in its earlier (e.g., Katz and Autor 1999) or more recent variants (e.g., Autor et al. 2003; see also Mahutga, Curran, and Roberts 2018), the core distributional mechanism of TC is that it is skill (or routine) biased. TC allows the automation of lower skill (or higher routine) tasks, such as simple assembly or secretarial activities (see Autor et al. 2003; Katz and Autor 1999). TC should reduce the demand for low-skilled workers by automating low-skill occupations and tasks. Holding the supply of low-skilled workers fixed, this would increase the ratio of low-skill job seekers to low-skill jobs and thereby increase the income penalty of low skills. Simultaneously, TC increases the relative demand for highly skilled labor. Holding the supply of high-skilled workers fixed, a growing share of high-skill jobs would reduce competition for high-skill occupations and thereby increase the wage premium to high-skilled workers. Moreover, TC is thought to assist higher skilled labor and thus increase its marginal productivity via better technology, which further boosts their relative labor income. Thus, we expect that TC increases the premium to high skills and the penalty to low skills (Table 1, columns 1 and 2).
Most egalitarian institutions are thought to reduce income inequality between low- and high-skilled workers. Unions promote a strong egalitarian ethos among organized workers and raise wages for both unionized and nonunionized workers (e.g., Alderson and Nielsen 2002; Western and Rosenfeld 2011). Countries with strong labor movements tend to have strong left parties in government and thus stronger tendencies toward redistribution (e.g., Huber and Stephens 2001; Moller, Alderson, and Nielsen 2009; Western 1997). Wage coordination, or the extramarket sociopolitical processes whereby wage rates are negotiated by labor, is also thought to limit skill penalties and premiums within the working class (Alderson and Nielsen 2002; Bradley et al. 2003; Pontusson, Rueda, and Way 2002; Traxler 1999; Wallerstein 1999). The primary mechanism is that it “decouples” changes in the variance of labor demand across skill gradients from changes in realized wages. That is, wages that are set through institutional negotiations cannot respond instantaneously to changes in demand for particular segments of labor. Moreover, some research suggests that wage coordination improves the position of low-skilled workers, in particular (Wallerstein 1999). Thus, we expect unionization and wage coordination to reduce the premium to high skills and the penalty to low skills (Table 1, columns 1 and 2).
Welfare states should also matter for the skill dynamics outlined above (Bradley et al. 2003; Kenworthy and Pontusson 2005). Strong welfare states should boost the disposable incomes of households with low-skilled earners. Eligibility requirements underlying transfer payments are progressive (to varying degrees); they target the posttax and transfer incomes of low-skilled (and thus low-wage) workers. Conversely, high-skilled workers do not experience many of the economic risks that those with low skills experience do and receive fewer transfer payments (particularly means-tested transfers and unemployment insurance). Thus, we expect welfare states to reduce the premium to high skills and the penalty to low skills (Table 1, columns 1 and 2).
Managerial Premiums
Through offshoring, the production globalization expands the size of the labor market, which reduces the bargaining power of labor vis-à-vis management (Freeman 2007; Mahutga et al. 2017). It is also thought to increase the demand for talented managers capable of identifying capable suppliers and managing the far-flung contracting relations in the global South (Dencker 2009; Streeck 1987). TC’s impact on managerial premiums is less clear. On one hand, it is theorized to increase both the range of responsibilities of (and thus demand for) managers, as well as the technical skills required to carry these responsibilities out (Acemoglu 2002; Autor et al. 2003). On the other, it might also automate a range of functions previously carried out by management, leading to a shrinking size of the managerial class but higher premium for the residual group. On balance, we expect the globalization of production and TC to increase the managerial premium (Table 1, column 3).
Financialization refers to the growing share of economic output from finance-related activity. Some of this stems from the growth of the financial (and related) sector (e.g., Krippner 2012). Financialization is theorized to increase the bargaining power of management among nonfinancial firms that develop finance-related divisions (Lin and Tomaskovic-Devey 2013). Financialization decouples surplus and production and enhances the perceived relative status of finance vis-à-vis production. In tandem, these boost the bargaining power of management “in compensation-setting and surplus distribution processes” (Lin and Tomaskovic-Devey 2013:1294). Thus, we expect the financialization to work increase the managerial premium (Table 1, column 3).
Egalitarian institutions are theorized to reduce managerial premiums. Unions erode managerial prerogatives (to varying degrees) directly in contract language, which increases labor’s bargaining power (Stepan-Norris and Zeitlin 2002). Thus, collectively bargained contracts secure a greater relative share of output for workers vis-à-vis management. Strong wage-coordinating institutions shift the locus of control over remuneration from firms to labor and foster collective identity among differentiated workers. This represents an institutional source of bargaining power that weakens the power of management to set remuneration schedules in their favor (Wallerstein 1999). Finally, welfare states should reduce the managerial premiums through the same mechanisms as it reduces premiums to skill (e.g., redistribution away from managers). Thus, we expect all three of the egalitarian institutions studied here to reduce the managerial premium (Table 1, column 3).
FIRE-Sector Premiums
Scholars link financialization to the end of the postwar golden age of rapid growth circa the 1970s, to deregulation that increased the scope of finance-related activities along with consumer debt, and to a parallel cultural shift in corporate governance that prioritized short-term stock valuations over longer term corporate strategy (see Fligstein and Shin 2007; Krippner 2012; Tomaskovic-Devey and Lin 2011). Combined, these processes increase the rate of return to finance and related industries (insurance and real estate) relative to others (Lin and Tomaskovic-Devey 2013) and thereby increase the income of FIRE-sector employees relative to those in other sectors. Thus, we expect financialization to increase the FIRE-sector premium (Table 1, column 4).
Top-Income Premiums
To the extent that top-income households include workers with high skills, managerial positions, or FIRE-sector occupations, the labor market mechanisms discussed earlier extend rather readily. However, many note that a significant share of income among top-income households comes from business and investment income rather than labor income (Kenworthy 2017; Kuhn et al. 2018; McCall and Percheski 2010; Rosenberg 2013). Indeed, our LIS data suggests that the capital share (interest and dividends plus rent plus capital gains) of total income among households in the top 1 percent of their respective national income distributions is about 201 percent (95 percent confidence interval = 117 percent to 322 percent) greater than that of households in the bottom 99 percent, on average. As such, some of the distributional mechanisms affecting top incomes are unique. Most generally, we argue that structural change increases top-income premiums by (1) facilitating a disproportionate increase in business and investment income and (2) nonmarket channels that decrease the regulatory and fiscal burden of top incomes vis-à-vis the 99 percent (e.g., Piketty and Saez 2013). Conversely, we argue that egalitarian institutions affect the incomes of top incomes by (1) facilitating the capture of a greater share of output by the 99 percent and (2) redistribution. In what follows, we explicate these four abstractions in the context of the three types of structural change and egalitarian institutions discussed above.
Globalization of Production
Historically, the globalization of production replaces (higher wage) labor in the global North with (lower wage) labor in the global South (Kollmeyer 2009; Mahutga et al. 2017). Holding consumer prices fixed, greater profitability for offshoring firms is a rather mechanical consequence. Owners of capital in top-income households are in a key position to capture this increased profitability of offshoring firms through rising share prices, either in the form of stock option packages for executives or through larger investment portfolios. More recent theory also suggests that the globalization of production reduces the marginal tax rate of top-income households and increases the marginal tax rate of the middle classes (Egger, Nigal, and Strecker 2019; Piketty and Saez 2013). Here, corporations and the superrich are both sensitive to high marginal tax rates and have the mobility to avoid them. Consequently, governments rely on less mobile tax bases, including sales taxes and income taxes among relatively immobile workers outside of top-income households. One recent estimate suggests that the top 1 percent of income earners in the average [Organisation for Economic Co-operation and Development] country faced a globalization-induced reduction in their relative labor income tax burden of 0.59–1.45 percentage points, whereas the tax burden increased by 0.03–0.05 percentage points for the median earner. (Egger et al. 2019:355)
Thus, we expect the globalization of production to increase the top-income premium (Table 1, column 5).
Technological Change
Skill-biased TC and automation, in particular, substitutes human labor for machine labor. It also increases the productivity of the remaining labor. Both outcomes reduce the overall costs of production and thereby increase profitability among firms that engage in TC. Their greater relative share of capital income allows top-income households to capture a larger share of this increased profitability than the rest. Moreover, recent literature suggests that TC alters the way that some markets function, particularly those in sectors with intensive technological innovation. Building on Joseph Schumpeter’s creative destruction, these scholars argue that high-tech sectors are more concentrated and produce more economic rent than others. The existence of large firms in these sectors leads to more pay for top executives, while the competitive pressure to innovate in these sectors further increases executive compensation sector wide as firms compete for “talented” executives (McCall and Percheski 2010). Shareholders of the “winner take all” firms in these sectors (e.g., Apple, Microsoft, Facebook) also reap a disproportionate share of the rewards relative to average workers (see Frank and Cook 1996; Guellec and Paunov 2017). Thus, we expect TC to increase the top-income premium (Table 1, column 5).
Financialization
The link from financialization to a growing share of income among top income earners has already been well described in the sociological literature. On one hand, investments in finance-related activities come at the expense of investments in production (Krippner 2005; Lin and Tomaskovic-Devey 2013; Tomaskovic-Devey and Lin 2011). This, combined with the higher profitability of finance-related activities, rewards executives and shareholders. The extramarket story has also been told. Lin and Tomaskovic-Devey (2013) suggested that the ascendance of finance increased the rhetorical power that shareholders and executives bring to bear in their claims on firm-level resources. That is, apart from the market forces associated with disinvestment in production and hyperinvestment in finance, financialization gave shareholders and executives, as the chief architects of financialization, a greater ability to extract economic rents from financializing firms. Thus, we expect financialization to increase the top-income premium (Table 1, column 5).
Unions and Wage Coordination
Just as with the globalization of production, TC and financialization boost (in theory) the bargaining power (and thus incomes) of top executives and shareholders at the expense of workers, and unions and wage coordination should, in theory, have the opposite effect (Huber, Huo, and Stephens 2019; Volscho and Kelly 2012). The most obvious channel is the greater control of workers over the remuneration process, which increases their share of income vis-à-vis shareholders and executives in top-income households. Similarly, others have argued that unions operate as both an “implicit regulation” and “organizational constraint” that limits executive compensation either by explicit or implicit pressure campaigns, or by undermining the need for close managerial supervision (Huber et al. 2019). But other research suggests that high rates of unionization also boost the incomes of nonunion members (Western and Rosenfeld 2011). That is, by securing greater control of the remuneration process among unionized firms, unions also increase the labor share of revenue among nonunionized firms. Wage coordination is a clear example of how this works, where the wage increases of nonrepresented workers get pegged to those of represented workers laboring under bargained contracts. Moreover, unions in wage-coordinating countries with centralized bargaining also possess more organizational capacity to engage in coordinated implicit regulation. Huber et al. (2019) identify an annual report by the Swedish Trade Union Confederation as a clear example of this, which publishes the “incomes of the CEOs of the 50 largest Swedish firms” (p. 235). Thus, unions and wage coordination should reduce the top-income premium. Thus, we expect the both unions and wage coordination to reduce the top-income premium (Table 1, column 5).
Welfare States
Welfare states should reduce the top-income premium through both market and nonmarket channels. The most straightforward nonmarket channel is the redistributive one outlined above. Although in theory many welfare benefits (e.g., unemployment and pensions) are proportional to what beneficiaries pay over their lifetimes, the probability of receiving other benefits is lower among top-income households. Such households experience smaller relative economic shocks (e.g., Pfeffer, Danziger, and Schoeni 2014) and can better protect themselves from the shocks they do experience (e.g., Link and Phelan 1995). Thus, 99 percent households in countries with generous welfare states receive a greater share of cash and noncash transfers and should therefore have larger relative posttax and transfer incomes than those in countries with less generous welfare states. This channel is outside of the market because welfare state programs are the outcome of complex political processes with long histories (e.g., Hicks and Swank 1992; Huber and Stephens 2001). Welfare states should also increase the labor share of income (e.g., Morgan and Kelly 2013; Volscho and Kelly 2012). In a simplified bargaining game, unemployed workers can either accept a given employment package or remain unemployed. However, the income penalty to unemployment is smaller in countries with generous welfare states, which mitigates perceptions of economic insecurity (Anderson and Pontusson 2007; Mughan 2007). Thus, labor market participants have more bargaining power vis-à-vis their employers and shareholders. Because of the significant share of capital income among top-income households, we expect the welfare state to reduce the top-income premium (Table 1, column 5).
Empirical Framework
The theoretical task of quantifying the effects of structural change and institutional context on income inequality is difficult. Disposable (e.g., post-tax and transfer) income is a fundamentally household-level resource (Gottschalk and Smeeding 1997). Economically, larger families enjoy greater economies of scale (i.e., lower per capita reproduction costs) than smaller families. Sociologically, employment and spending decisions are made through a dense overlay of social expectations and obligations arising from the family (Gerstel and Clawson 2014; McCall and Percheski 2010).
For example, the rise of single-headed households and female labor force participation create income gaps between single- and dual-earner families (Burtless 1999; Daly and Valletta 2006; Jantti 1997; Lu, Morissette, and Schirle 2011; Peichl, Schaefer, and Scheicher 2010). Female single-headed households may experience additional penalties associated with gender sorting and discrimination in the labor market (Cohen and Huffman 2003; Ridgeway 2011). Mothers may experience additional penalties because of slower human capital accumulation over the life course (Becker 1985; Kahn, Garcia-Manglano, and Bianchi 2014) and forms of explicit and implicit bias unique to mothers (Budig and England 2001). Because household composition is a distinct concept from the kinds of labor and capital market processes discussed above, most previous research considered these factors in isolation by examining either the determinants of (or inequality in) earnings, wages, and salaries or household income. As three influential authors recognize, it is already a difficult task to estimate the relative importance of factors affecting the distribution of earnings . . . it is even harder to assess the relative impact on overall inequality of mechanisms that may affect—largely independently—the distribution of earnings, on the one hand, and the distributions of income of households or families, on the other. (Alderson et al. 2005:410)
Critically, income penalties and premiums to household composition may be driven in part by the penalties and premiums discussed above. For example, penalties to single-earner, single-female, and single-mother households should be correlated with penalties attributable to low skills because divorce is more prevalent, and marriage is less prevalent among individuals with lower socioeconomic status (Lundberg, Pollak, and Stearns 2016). Similarly, positive assortative mating concentrates individuals with high socioeconomic status in dual-earning households (Cancian and Reed 1999; Schwartz 2010), which makes it difficult to disentangle income premiums attributable to dual-earner households from those attributable to processes discussed above. Thus, we advance an empirical strategy that incorporates both household composition and these penalties and premiums in a single framework.
In this framework, households are the unit of analysis, and disposable household income is the dependent variable. Following the voluminous literature using studies of earnings to examine the mechanisms of income inequality (see, e.g., the literature using the “Mincer equation” to study education and earnings inequality; Grossbard 2006), we begin by regressing household income on covariates capturing the composition of the household and the penalties and premiums described above, which give us baseline penalties and premiums that are unconditional to macro-context. The resulting coefficients have a mechanical association to aggregate measures of income inequality if the underlying penalty or premium matters for inequality.
To see why this is the case, we can write income inequality as the sum of a “between” and “within” group component (Western et al. 2008):

where π is the proportion of the population of group j in time t, r is the deviation of the average income of group j from the grand mean, and σ is the standard deviation of income among individuals in group j. We rewrite the income portion of the between-group component as a function of r using the generalized expression underlying all measures of inequality (Firebaugh 2003):

where
We then interact these baseline penalties and premiums with the process of structural change and type of process theorized to affect them (see Table 1). Significant interactions occur if and only if the focal macro-factor exacerbates/ameliorates a given penalty or premium. If a given baseline ratio is positive (premium) and the interaction term with a macro-process is also positive, then the macro-process increases inequality by increasing the income share of an already advantaged income group (and vice versa). Conversely, if a given baseline ratio is negative (penalty) and the interaction term with a macro-process is positive, then the macro-process decreases inequality by increasing the income share of an already disadvantaged income group (and vice versa). That is, our analysis speaks explicitly to both r and σ, in so far as our interaction terms capture inequality within penalty and premium groups across levels of structural change and types of institutional context.
Data/Methods
Sample
Our data come from the LIS Cross-National Data Center in Luxembourg, which is the most comprehensive source of cross-nationally representative and harmonized micro-data in the world. Our sample consists of the entire population of LIS country-years for which occupational and macro-level data are available. In fact, our sample is larger than that reported directly by the LIS because we include additional country-years for which country-specific occupational schemes were recently converted into International Standard Classification of Occupations 88 (LIS 2018). In total, we analyze 1,084,009 to 1,003,078 households in 74 to 81 country-years among 13 or 14 countries from 1974 to 2013. 2 A list of countries and years appears in Table 2.
Countries and Years Included.
Household Income
Our dependent variable is disposable household income, which is the posttax and transfer income from all sources contributed by all income-earning members of the household. We normalize for household size by dividing household income by the square root of household size (e.g., Brady et al. 2017). Household income will also vary across countries and over time because of differences in market exchange rates, prices, and inflation. To account for this, we converted all household incomes into 2011 international dollars. We also logged these incomes for skew.
Household-Level Variables
Skill, Workplace Authority, and FIRE-Sector Earners
We coded households according to the occupation and skill of household head and partner earners. We identified head and partner earners that were high skill, low skill, managers, and FIRE-sector workers. Following the extensive literatures measuring high skills with educational credentials (Katz and Autor 1999; Wood 1994) and low skills with occupational characteristics (Autor et al. 2003; Goos, Manning, and Salomons 2014), we measure the former with college education and the latter (as well as managerial status) with standardized and harmonized occupational classifications available in the LIS. FIRE-sector occupations are coded with standardized and harmonized industrial classifications available in the LIS. The detailed LIS variables, coding procedures, and excluded categories appear in Table 3.
Independent Variables.
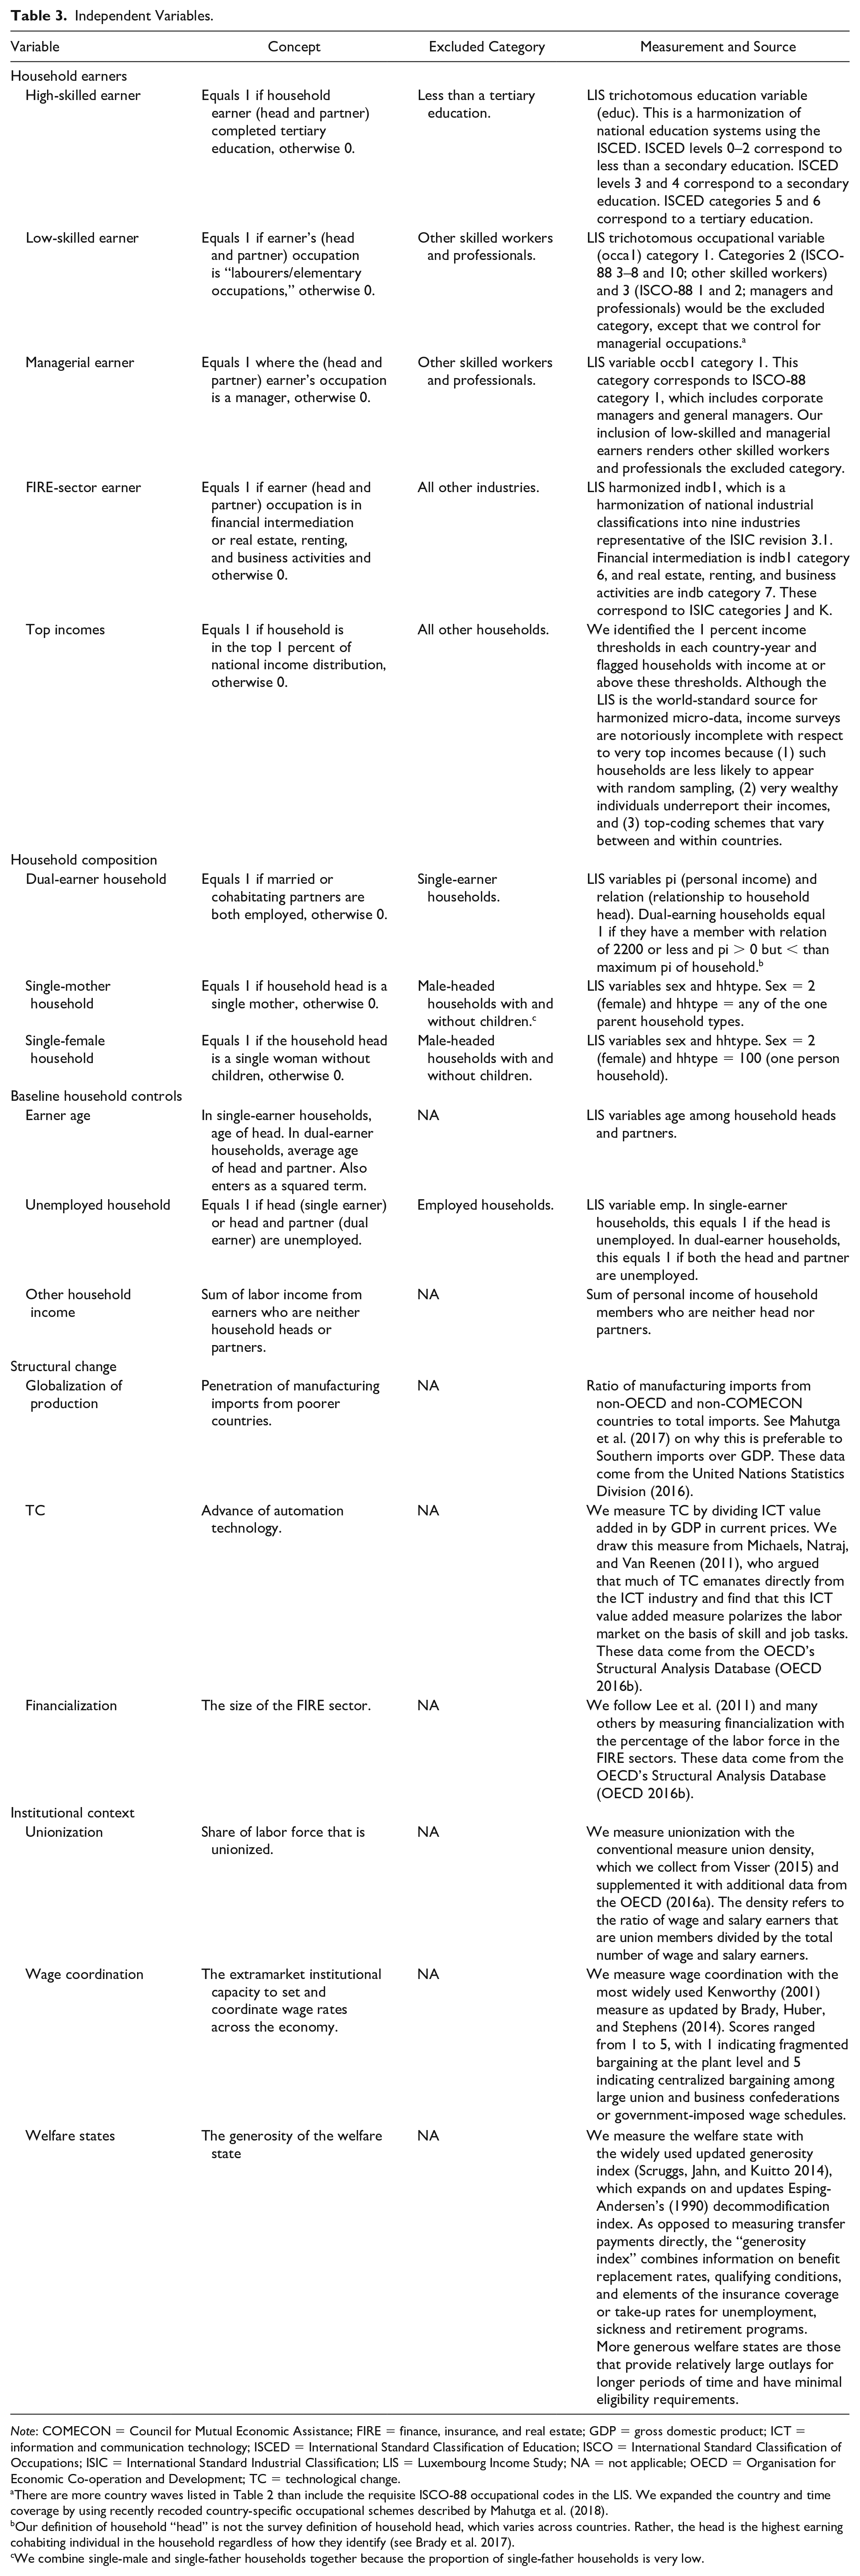
Note: COMECON = Council for Mutual Economic Assistance; FIRE = finance, insurance, and real estate; GDP = gross domestic product; ICT = information and communication technology; ISCED = International Standard Classification of Education; ISCO = International Standard Classification of Occupations; ISIC = International Standard Industrial Classification; LIS = Luxembourg Income Study; NA = not applicable; OECD = Organisation for Economic Co-operation and Development; TC = technological change.
There are more country waves listed in Table 2 than include the requisite ISCO-88 occupational codes in the LIS. We expanded the country and time coverage by using recently recoded country-specific occupational schemes described by Mahutga et al. (2018).
Our definition of household “head” is not the survey definition of household head, which varies across countries. Rather, the head is the highest earning cohabiting individual in the household regardless of how they identify (see Brady et al. 2017).
We combine single-male and single-father households together because the proportion of single-father households is very low.
Top Incomes
We define top-income households as those with posttax and transfer income at or above the top 1 percent of the national-year income distribution as reported by the LIS. This 1 percent threshold is almost certainly lower than the actual 1 percent threshold for a variety of reasons, which makes our estimates somewhat conservative. See Table 3 for a more detailed discussion.
Household Composition
Consistent with our explication of the distributional effects of household composition, we created three categories of households. Dual-earner households have earning heads and partners. Single-female households are headed by women without children. Single-mother households are headed by women with children. The detailed LIS variables, effective excluded categories, and coding procedures used appear in Table 3.
Baseline Household Controls
Household income will also vary systematically by the age of household earners and according to random shocks not captured by our household composition and labor market covariates. Thus, we measure household earner age and include a squared term because incomes generally increase from young to middle age and then decrease again as household earners enter retirement. We also measure unemployed households as those in which neither the head nor partner are employed. This variable captures unobservable processes not captured by the education, skill, or occupational status of household members. Finally, there are a multitude of various household compositions untheorized here. Some households may contain earning children, other relatives, or multiple families. Such household formations are beyond of the scope of the present article, and we control for them with other household income (OHI), which is equal to the personal incomes of household members that are neither head earners nor their partners. The detailed LIS variables and coding procedures used appear in Table 3.
Structural Change and Institutional Context
With one exception, we measure structural change and institutional context in the same way that the literature measures these so that our results are as comparable with this literature as possible. Where possible, we also consider alternative operationalizations of structural change observed in the literature. Additional details and discussion of these variables can be found in Table 3. The exception is the globalization of production, which we measure with the ratio of Southern manufacturing imports to total imports (rather than gross domestic product [GDP]) following Mahutga et al. (2017), who show that the latter is a biased measure of southern import penetration because southern imports systematically boost GDP. 3 We measure TC with the ratio of value added in information and communication technology to GDP (Michaels et al. 2014). To our knowledge, Michaels et al. (2014) are the only scholars who attempt to systematically measure TC directly (rather than via its purported effects) in a cross-nationally and temporally comparable way. Following the bulk of the cross-national sociological literature on financialization, we measure financialization with the employment share of the FIRE sector (Lee et al. 2011; Mahutga et al. 2017). We also assess the degree to which our results are robust to another common measure in cross-national research, the ratio of value added from the FIRE sector to GDP (Roberts and Kwon 2017).
Following the power resource tradition, we measure union density with the percentage of the labor force that is unionized (OECD 2016a; Visser 2015). Second, we employ the most widely used measure of wage coordination with Kenworthy’s (2001) coordination index (Brady et al. 2014). Finally, we measure the welfare state with the updated version of the frequently used industry standard generosity index (Scruggs et al. 2014).
Regression Models
Our full empirical models are depicted in equation 3:

In equation 3, i indexes households, j indexes countries and t indexes time. Y is household income. x is an n-by-k matrix of household compositional covariates that vary across households, countries, and time. γ is an n-by-k matrix of the penalties and premiums discussed above that vary across households, countries, and time. βγ1
ijt
and βγ1
2jt
are the head, partner, or household penalties and premiums, respectively. δ is a j-by-t matrix of socioeconomic processes and institutional configurations that vary across countries and time. βγ1
ijt
δ
ijt
and βγ2
ijt
δ
jt
are the moderating effects of macro-context on these penalties and premiums.
Given the hypotheses depicted in Table 1, our key null hypothesis tests relate to βγ1 ijt δ ijt and βγ2 ijt δ jt . We estimate the cross-level interactions between macro-context and micro-penalties and micro-premiums separately for two reasons. The first and primary reason is substantive: Our goal is not to adjudicate the degree to which any one process of structural change or type of egalitarian institutions is more important than another. Rather, our goal is to evaluate the efficacy of the micro-mechanisms discussed above by comparing them across processes of structural change and types of egalitarian institutions. A micro-mechanism that is involved in many macro-processes or has large effects in a few processes is more important than one involved in few and/or with small effects. Second, with 74 to 81 country-years, we lack sufficient degrees of freedom (df) at the country-year level to estimate simultaneously cross-level interactions between all six macro-contextual factors and the household-level penalties and premiums they are theorized to affect. 4
Results
Table 4 reports our baseline penalties and premiums. Coefficients on dummy-coded covariates represent the conditional mean difference in logged household income between households in the focal and excluded categories (see Table 3 for excluded categories). These are thus easy to interpret as percentage differences. For example, unemployed households experience a (model 1) income penalty of about 28.2 percent vis-à-vis employed households, on average. 5 The covariates on household age and its square capture the logged percentage increase in household income per unit increase in each covariate. Thus, household incomes increase by 4.47 percent per year in age, on average, and decrease 0.2 percent per unit increase in age squared. The apex of this parabola—the age at which incomes begin to decline with age—is roughly 64. Finally, the covariate on (logged) OHI is an elasticity; its coefficient reflects the percentage change in household income per one percent increase in OHI. On average, household incomes increase by 0.7 percent for every 1 percent increase in OHI.
Regression of HH Income on HH Composition and Labor-Market Processes.

Note: Unstandardized coefficients are presented, with heteroskedastic and serial correlation–consistent standard errors in parentheses. Unknown education, period, and country fixed effects are not shown. HH = household.
p < .001 (one-tailed tests).
The top three rows of model 1 report the income penalties for single-female and single-mother households, as well as the premium to dual-earner households. The inclusion of all three renders households with single male heads (with and without children) the excluded category. On average, single-mother households experience a roughly 25.2 percent income penalty relative to single male–headed households. Dual-earner households experience an income premium of about 29.1 percent relative to single male–headed households. Single female–headed households without children do not experience a significant income penalty vis-à-vis single male–headed households, perhaps reflecting the positive association between socio-economic status, delayed marriage and childbirth and labor force participation among women (also see Correll, Benard, and Paik 2007).
Model 2 includes the entire set of covariates capturing the labor market status of household earners. Consistent with our claim that the income penalties and premiums to household composition are correlated with those from the labor market status of household earners, the estimated penalties and premiums to the former change considerably when controlling for the latter. The income penalty to households with single mother heads drops to 20.2 percent, while the dual-earner premium drops to 18.3 percent. Thus, as much as 20 percent of the single-mother penalty and 37 percent of the dual income premium estimated in model 1 can be attributed to the labor market status of single mothers and dual household earners, respectively. These penalties and premiums change little when we control for top-income households in model 3; the dual-earning premium increases by 1 percentage point.
Figure 2 depicts the baseline income premiums and penalties from models 2 and 3 in percentage terms. According to model 2, households headed by high-education workers enjoy an income premium of about 34 percent relative to those headed by medium and low-education earners. Households headed by low-skilled workers experience an income penalty of about 21 percent relative to those headed by medium- and high-skilled workers. Households headed by managers experience an income premium of about 19 percent relative to those headed by nonmanagers, and those headed by FIRE-sector workers experience an income premium of about 14 percent relative to those headed by workers in other sectors. The income penalty for households with low-skilled earning partners is about 13 percent relative to medium- and high-skilled earning partners. The income premiums to households with earning partners who are highly educated, managers, and FIRE-sector workers are 18 percent, 16 percent, and 13 percent, respectively.

Unconditional household income penalties and premiums to household composition, skill, workplace authority, and the 1 percent.
Consistent with our argument that mechanisms operating outside the labor market play an important role in boosting the share of income among top-income households, most of the labor market covariates change little when the top-income premium is controlled. However, there are five premiums that change by two percentage points or more. The premiums to high education and workplace authority decrease by 3 and 2 percentage points for heads and partners, respectively. The premium to FIRE-sector heads decreases by 2 percentage points. These changes are consistent with literature on top-income households, which suggests that they tend to include earners with high education, managerial, and FIRE-sector occupations (e.g., Kenworthy 2017; Kuhn et al. 2018; McCall and Percheski 2010; Rosenberg 2013). Nevertheless, these changes are rather small. Thus, although some of the income captured by top-income households is attributable to their status in the labor market, a significant share must also reflect their disproportionate share of nonwage and nonsalary income (also see our capital income share analysis discussed on page 5). That is, the top-income covariate captures a multiplicity of mechanisms outside the labor market that benefit top-income households.
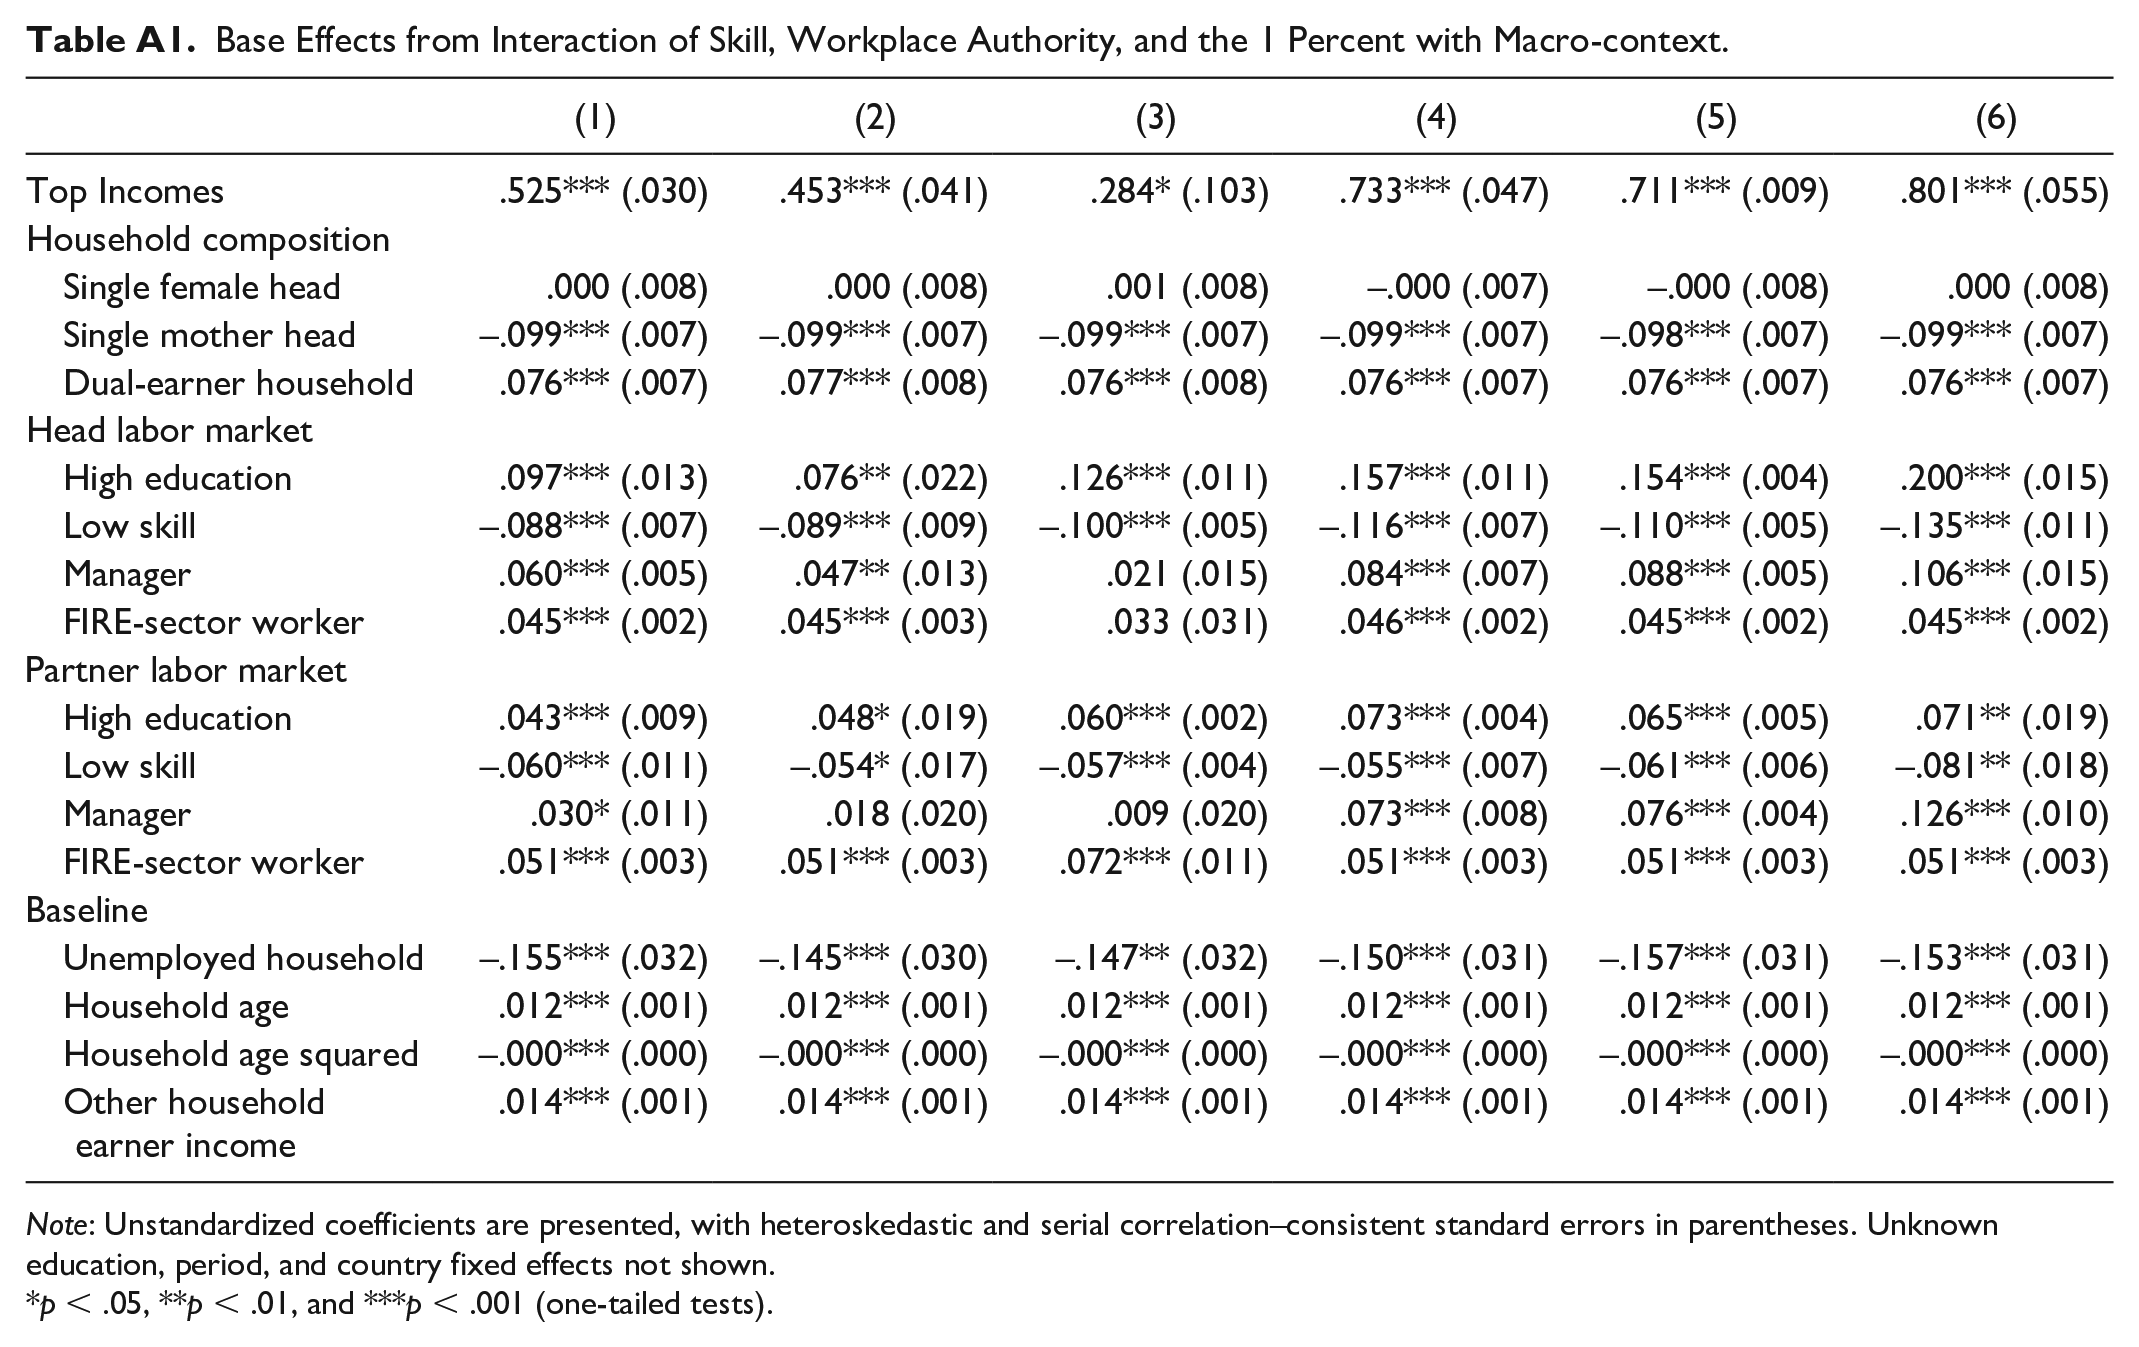
The penalties and premiums in the bottom pane of Figure 2 represent our baseline. In Table 5, we examine how structural change and institutional context change these premiums. To proceed, we report interaction terms between the type of structural change or institutional context and the penalties and premiums they are theorized to influence in the literature described above and summarized in Table 1. These interaction terms represent the slope of the focal macro-contextual factor on the focal micro-level penalty or premium. The base effects appear in Table A1 in the Appendix.
Regression of HH Income on HH Composition, Skill, Workplace Authority, the 1 Percent, and Interactions with Macro-context.

Note: Unstandardized coefficients are presented, with heteroskedastic and serial correlation–consistent standard errors in parentheses. Unknown education, period, and country fixed effects not shown. Base effects appear in Table A1. Manager partner × technological change, t = 1.99; 1 percent × union density, t = –1.77; manager head × wage coordination, t = –2.03; manager head × wage coordination, t = –1.85. HH = household; MACRO = macro-context.
p < .05, **p < .01, and ***p < .001 (one-tailed tests); †p < .10 (two-tailed tests).
In the labor market, the globalization of production boosts the income premium to households with high-education and managerial heads and partners, and exacerbates the income penalty to those with low-skilled heads (model 1). TC increases the income premium to households with highly educated and managerial head earners, as well as managerial partner earnings (model 2). Surprisingly, much of the distributional effect of financialization owes to the greater bargaining power it transmits to managers rather than boosts to FIRE-sector worker incomes, per se. Financialization increases the income premium to households with managerial heads and partners but has no significant effect on the premium to households with FIRE-sector workers (model 3). With respect to top incomes, all three processes of structural change increase the top-income premium and thus the share of income among top-income households (second row of models 1–3).
In the labor market, union density reduces the income premium to high education (heads and partners) and managerial status (partner), as well as the income penalty to low skills (heads) (model 4). Wage coordination reduces the income premium to households with highly educated heads and managerial heads and partners (model 5). Welfare state generosity reduces the premium to households with highly educated and managerial heads and partners, as well as the penalty to those with low-skilled heads (model 6). Finally, egalitarian institutions significantly reduce the top-income premium and thereby the share of income among top-income households (second row of Models 4–6).
Relative Importance of Micro-mechanisms
The relative importance of these micro-mechanisms is difficult to discern from the interaction terms alone, in part because the macro-processes vary widely in their distribution. Thus, Figures 3 and 4 report, respectively, the maximum impact 6 of macro-context on the five penalties and premiums under examination (in percentage terms) and the share of the theorized micro-mechanisms that are significantly different from zero. Focusing on the absolute values of these maximum effects in the labor market in Figure 3, the change in high-education premium sums to 108 percent and varies from 27.6 percent (TC) to 6.9 percent (globalization of production) across the macro-level factors. The change in the low-skill penalty sums to 27 percent and varies from 14.5 percent (unionization) to 5.8 percent (globalization of production) across macro-factors. The change in the managerial premium sums to 130.7 percent and varies from 17.2 percent (TC) to 5.8 (welfare state) percent across macro-factors. Turning to the top-income premium, we see change in this mechanism sums to 491.9 percent and varies from 167 percent (TC) to 25 percent (welfare state) across macro-factors. Thus, these comparisons suggest that the managerial premium is the most important micro-mechanism in the labor market, but the top-income premium is the most important micro-mechanism overall.

Maximum impact of structural change and institutional context on penalties and premiums.

Percent of micro-mechanisms significant across structural change and institutional context.
Turning to Figure 4, we arrive at the same conclusion. Structural change (75 percent) and institutional context (66.7 percent) together moderate 70 percent of the possible high-education premiums. They moderate 25 percent (structural change) and 33.3 percent (institutional context) of the low-skill penalties, or 30 percent overall. Conversely, 91.7 percent of the managerial premiums are moderated by structural change (100 percent) and institutional context (83.3 percent). Similarly, 100 percent of the top-income premiums are moderated by processes of structural change and institutional context.
What can these results tell us about the relative importance of labor market mechanisms versus those among top incomes that are independent of the labor market? To answer this question, Figure 5 compares the sum of the maximum impact of labor market penalties and premiums to that for the top-income premium for each process of structural change and institutional context. First, the disequalizing effect of structural change on labor market penalties and premiums is smaller than its disequalizing effect on top incomes. Second, conversely, the equalizing effect of egalitarian institutions on top-income premiums is smaller than their equalizing effects in the labor market.

The relative importance of labor market penalties and premiums and top-income premiums.
Sensitivity Analyses
To assess the sensitivity of our results to alternative empirical choices and explanations, we conduct a series of additional analyses. First, some interesting work reveals that the FIRE-sector premium is larger at the higher end of the income distribution (see Lin 2015). Thus, we explored if the FIRE-sector premium and/or the impact of Financialization on the FIRE-sector premium varied between the bottom and top 10 percent if the distribution. We did observe a larger FIRE-sector premium in the top 10 percent among household heads but not household partners. However, the interaction between the FIRE-sector premium and financialization did not vary between the two groups. We also replicated our regression analysis after replacing our measure of financialization (the employment share in FIRE) with a common alternative in cross-national research: the ratio of value added in the FIRE sector to GDP. These results were substantively identical: financialization moderates only managerial premiums (head and partner) in the labor market, and these effects were much smaller than its effect on the top-income premium. Thus, we conclude that the relationship between financialization and the FIRE-sector premium is well captured by the results reported above.
We also checked sample composition effects. Although our analysis includes every LIS observation for which data are available, the panels are nevertheless unbalanced. Thus, we tested the null hypothesis on all our interaction terms with a nonparametric jackknife procedure. These results did provide a small amount of evidence against our reported finding that FIRE sector salaries are not an important mechanism by which financialization affects inequality because the FIRE sector partner × financialization interaction was significantly different from zero. However, the magnitude of this interaction was very small and much smaller than the interaction with managerial and (particularly) top-income premiums. Moreover, the interaction between FIRE sector partner and financialization and was not significant in a jackknife analysis of the regressions that replaced the employment share of FIRE with the alternative measure of FIRE discussed previously.
In Figure 3, we calculate the maximum impact to standardize the comparison of changes in income penalties and premiums across macro-factors with different distributions. However, this approach to standardization may be susceptible to outliers. Thus, we also consider a different comparison. Here, we calculate the change in the penalty/premium across 1 standard deviation above and below the mean of the focal macro-factor. These yield substantively identical conclusions.
Finally, our use of one-tailed hypothesis tests was driven both by substantive and data concerns. Substantively, all our key hypotheses are clearly directional. The data concerns relate to the severely limited degrees of freedom discussed earlier. Nevertheless, some of our cross-level interactions would only achieve “significance” at the .10 level if we used nondirectional (or jackknife) hypothesis tests (see Table 5). Excluding these would change our substantive conclusion in the following sense: Premiums would still be more important than penalties, but high-skill premiums would be slightly more important mechanisms for institutional context than managerial premiums. Nevertheless, managerial premiums remain the most important labor market mechanism overall.
Conclusion
How do structural change and institutional context affect income inequality in rich democracies? Our analysis focuses upon the micro-mechanisms theorized in macro-level research. These micro-mechanisms feature extensively in the inequality literature, yet past research does not assess these mechanisms empirically. In particular, we examine three processes of structural change—economic globalization, TC, and financialization—and three types of egalitarian institutions—unionization, wage coordination, and welfare states—that dominate the macro-comparative sociological literature. Our results suggest that these processes either exacerbate or ameliorate the penalties and premiums to skill and workplace authority in the labor market, as well as the top-income premium. Our analysis yields four broad contributions.
First, our analysis sheds new empirical light on the micro-mechanisms by which each processes of structural change and type of egalitarian institution affect income inequality. The impacts of TC work through both skill and workplace authority in the labor market and through top incomes outside the labor market (cf. Leicht 2008). Financialization’s effects are limited to income premiums but in ways that are somewhat surprising. Financialization increases managerial premiums rather than FIRE-sector premiums, per se. Most of its impact can be attributed to the rising premium of top incomes. Although the absence of moderating effects for FIRE-sector premiums is surprising, these results are broadly consistent with sociological accounts linking financialization to the rising bargaining power of management (Lin and Tomaskovic-Devey 2013; Tomaskovic-Devey and Lin 2011) and top end incomes (Lin 2015) and may also point to heterogeneity within the FIRE sector. Globalization’s effect is diffused among several channels inside and outside the labor market. It exacerbates low-skill penalties (heads) and premiums to high skills and management (heads and partners). These effects are entirely consistent with more recent work on the distributional effects of globalization (e.g., Alderson and Nielsen 2002; Mahutga et al. 2017). However, our analysis is the first to demonstrate a positive effect of the globalization of production on top incomes (cf. Egger et al. 2019; Piketty and Saez 2013).
Among the egalitarian institutions examined, unions reduce the low-skill penalty (heads), as well as the income premiums to high skills (heads and partners), management (heads), and top-income premiums. Wage coordination and welfare state generosity reduce the income premiums to high skills (heads) and management (heads and partners), as well as the top-income premium. However, welfare states also provide a modest boost to households headed by low-skilled earners (e.g., Mahutga et al. 2017).
Second, consistent with the greater distributional weight of “upper-tail” inequality observed elsewhere (Alderson et al. 2005), we observe that income premiums are much more important micro-mechanisms than income penalties. Summing the absolute value of all changes in penalties and premiums, respectively, in Figure 3, changes to premiums are just over 27 times larger than changes to penalties. Thus, although arguments linking rising inequality to the immiseration of the working class are not without evidence, these micro-mechanisms appear much less important than income premiums. That said, there is of course a floor effect to income penalties (income typically does not extend below zero) that is not true of income premiums, and a similar percent decline among the very poor has a larger effect on consumption vis-à-vis the rich. 7 Moreover, poor households could be disproportionately harmed by structural change if it increases the probability of deep economic crises because such crises can be particularly harmful for the poor.
Third, some of the micro-mechanisms proposed in the literature are clearly more important than others. In the labor market, workplace authority is the most important micro-mechanism (e.g., Wodtke 2016), followed closely by the high-skill premium. However, our analysis highlights the saliency of micro-mechanisms unique to top incomes (e.g., Kenworthy 2017). All the processes of structural change and egalitarian institutions moderate the top income share, and these moderations are larger than any single labor market process. This is a particularly noteworthy observation because top-income premiums are largely independent from penalties and premiums in the labor market (see Figure 2), and the effects we observe in this premium attributable to structural change and institutional context are net of their effects on all the micro-mechanisms observed in the labor market.
Fourth, our analysis of the micro-mechanisms by which structural change and institutional affect penalties and premiums is relevant for policy discussions about the phenomena of rising income inequality. One implication follows from the disproportionately countervailing effects of structural change and institutional context in the labor market and among top incomes. The foregoing analysis suggests that the top-income premium is the most important mechanism for structural change, whereas labor market penalties and premiums are more important mechanisms for institutional context. To further investigate this possibility, Figure 6 displays six scatterplots. Column 1 shows the bivariate association between LIS Gini coefficients and composite scores for structural change (top row) and institutional context (bottom row). These composite scores are formed by first z score standardizing each measure of structural change/institutional context and then summing the z scores. All variables are country demeaned. Columns 2 and 3 display bivariate associations between “residual Gini coefficients” constructed with the residuals from regressions of Gini coefficients on labor market premiums (column 2) and top-income premiums (column 3). Comparing across columns, these results suggest that labor market premiums explain only 3.4 percent of the association between Gini coefficient and structural change, whereas top-income premiums explain 31.9 percent. Conversely, 42.5 percent of the association between institutional context and Gini coefficient is explained by labor market premiums, compared with only 9.1 percent for top-income premiums. 8 Moreover, when considering the top 25 percent of top-income premiums we observe, the list of countries includes those with both relatively inegalitarian institutional contexts (e.g., the United States after 2000, Austria in 2013) as well as those with relatively egalitarian contexts (e.g., Finland after 2000, Germany after 2004, Belgium in 2000, Greece after 2000).

Micro-mechanisms of macro-effects.
If it is true that processes affecting top incomes are the bulk of the story of contemporary inequality trends (Alderson et al. 2005; Kenworthy 2017; Piketty 2013), the disproportionate focus on three key postwar egalitarian institutions on the labor market may undermine their redistributional efficacy. Although our article provides an important first step toward unpacking the micro-mechanisms of macro-contextual drivers of inequality, additional research is needed. Indeed, the disproportionate role of the top-income premium in the distributional mechanisms of structural change and institutional context should animate examinations of the mechanistic role it plays in additional macro-level processes.
The foregoing analysis is important for its scope: we link six well-studied types of structural change and institutional context to five types of micro-mechanisms. However, we have also omitted additional possible mechanisms. For example, Crouch (2009), Leicht and Fitzgerald (2006), and others argue that “easy credit” and subsequent debt could be key mechanisms linking financialization to inequality. Similarly, cross-country differences in the size of the service sector, the adoption of the shareholder theory of value, the spread of educational attainment, and so on, are likely macro-mechanisms through which structural change and/or institutional context affect inequality. Indeed, Figure 6 suggests that a significant share of the association between inequality and structural change or institutional context remains unexplained by micro-level factors. Similarly, additional types of structural change (e.g., deindustrialization) and institutional contexts (e.g., top tax rates or tax progressivity, government partisanship, works councils) could also be decomposed to better understand how their distributional effects operate (Huber et al. 2019).
We offer one final interpretive caveat. As is implied in our discussion of our empirical framework (see equations 1 and 2), the relative importance of these micro-mechanisms for the distributional effects of macro-context overall depends on the changing income shares accruing to households that occupy the penalties and premiums analyzed above and on the share of the population represented by these penalties and premiums. Our results can speak forcefully to the former but not to the movement of the population into and out of these penalties and premiums. Fully explicating the relative importance of these penalties and premiums would thus require an analysis of how households respond to the changing economic incentives that structural change and institutional context create.
Footnotes
Appendix A
Base Effects from Interaction of Skill, Workplace Authority, and the 1 Percent with Macro-context.
| (1) | (2) | (3) | (4) | (5) | (6) | |
|---|---|---|---|---|---|---|
| Top Incomes | .525*** (.030) | .453*** (.041) | .284* (.103) | .733*** (.047) | .711*** (.009) | .801*** (.055) |
| Household composition | ||||||
| Single female head | .000 (.008) | .000 (.008) | .001 (.008) | –.000 (.007) | –.000 (.008) | .000 (.008) |
| Single mother head | –.099*** (.007) | –.099*** (.007) | –.099*** (.007) | –.099*** (.007) | –.098*** (.007) | –.099*** (.007) |
| Dual-earner household | .076*** (.007) | .077*** (.008) | .076*** (.008) | .076*** (.007) | .076*** (.007) | .076*** (.007) |
| Head labor market | ||||||
| High education | .097*** (.013) | .076** (.022) | .126*** (.011) | .157*** (.011) | .154*** (.004) | .200*** (.015) |
| Low skill | –.088*** (.007) | –.089*** (.009) | –.100*** (.005) | –.116*** (.007) | –.110*** (.005) | –.135*** (.011) |
| Manager | .060*** (.005) | .047** (.013) | .021 (.015) | .084*** (.007) | .088*** (.005) | .106*** (.015) |
| FIRE-sector worker | .045*** (.002) | .045*** (.003) | .033 (.031) | .046*** (.002) | .045*** (.002) | .045*** (.002) |
| Partner labor market | ||||||
| High education | .043*** (.009) | .048* (.019) | .060*** (.002) | .073*** (.004) | .065*** (.005) | .071** (.019) |
| Low skill | –.060*** (.011) | –.054* (.017) | –.057*** (.004) | –.055*** (.007) | –.061*** (.006) | –.081** (.018) |
| Manager | .030* (.011) | .018 (.020) | .009 (.020) | .073*** (.008) | .076*** (.004) | .126*** (.010) |
| FIRE-sector worker | .051*** (.003) | .051*** (.003) | .072*** (.011) | .051*** (.003) | .051*** (.003) | .051*** (.003) |
| Baseline | ||||||
| Unemployed household | –.155*** (.032) | –.145*** (.030) | –.147** (.032) | –.150*** (.031) | –.157*** (.031) | –.153*** (.031) |
| Household age | .012*** (.001) | .012*** (.001) | .012*** (.001) | .012*** (.001) | .012*** (.001) | .012*** (.001) |
| Household age squared | –.000*** (.000) | –.000*** (.000) | –.000*** (.000) | –.000*** (.000) | –.000*** (.000) | –.000*** (.000) |
| Other household earner income | .014*** (.001) | .014*** (.001) | .014*** (.001) | .014*** (.001) | .014*** (.001) | .014*** (.001) |
Note: Unstandardized coefficients are presented, with heteroskedastic and serial correlation–consistent standard errors in parentheses. Unknown education, period, and country fixed effects not shown.
p < .05, **p < .01, and ***p < .001 (one-tailed tests).
Acknowledgements
We thank David Brady, Steven Brint, Kevan Harris, Joel Herrera, Scott Savage, Carolyn M. Sloane, participants of the Sociology Seminar Series at the University of California, Los Angeles, and the University of Tennessee, the Mellon Seminar for Advancing Intercultural Studies and the Political Economy Working Paper Group at the University of California, Riverside, and attendees of the annual meetings of the American Sociological Association (2017) and International Studies Association (2018).
Funding
The author(s) disclosed receipt of the following financial support for the research, authorship, and/or publication of this article: This research was funded by the National Science Foundation (grant 1528703).
1
For example, the (log) income premium enjoyed by households with college educated earners is equal to the conditional income ratio log(
2
TC is missing for Switzerland (2010, 2013), Ireland (2010), Luxembourg (2013), the United Kingdom (2010, 2013), and the United States (2013), yielding 74 country-years. FIRE-sector employment is missing for Switzerland (2013), the United Kingdom (2013), and the United States (2013), yielding 78 country-years. Welfare state generosity is missing for Luxembourg (all years), yielding 75 country-years.
3
4
Our large number of level 1 observations (households) does not affect our degrees of freedom at level 2 (country-years) (West, Welch, and Galecki 2006). Our fixed country and time effects eat up 32 df, leaving 42 to 49 to work with. As can be seen in Table 1, each macro-contextual factor is hypothesized to interact with three to four penalties and premiums. Because we consider the labor market characteristics of head earners and their employed partners, this would reduce our degrees of freedom just above or just below zero (40 cross-level interactions and six country-level covariates). Combining these together in a single model would also require us to estimate a large number of “tacit” interactions up to and including a six-way interaction between the six macro-factors (![]() ). Not only would this push our df far below zero, it would also produce coefficients that were almost impossible to interpret.
). Not only would this push our df far below zero, it would also produce coefficients that were almost impossible to interpret.
5
Using the base 10 logarithm, these percentages are equal to (10b – 1) × 100, where b is the reported coefficient.
6
The maximum impact is given by the exponentiated difference between the coefficient on the focal penalty or premium at the maximum and minimum observed level of structural change and institutional context.
7
We thank an anonymous reviewer for pointing this out.
8
These percentages are given by (observed – residual)/observed × 100.