
Abstract
Aggregate figures unequivocally depict an increase in anti-Asian sentiment in the United States and other Western countries since the start of the COVID-19 pandemic, but there is limited understanding of the contexts under which Asians encounter discrimination. The authors examine how coethnic concentration shapes Asians’ experiences of discrimination across U.S. counties during COVID-19 and also assess whether county-level context (e.g., COVID-19 infection rates, unemployment rates) could help explain this relationship. The authors analyze the Understanding Coronavirus in America tracking survey, a nationally representative panel of American households, along with county-level contextual data. The authors find an n-shaped relationship between coethnic concentration and Asians’ perceived discrimination. This relationship is explained largely by county-level COVID-19 infection rates. Together, the context of medium Asian concentration and high COVID-19 cases created a particularly hostile environment for Asians during COVID-19.
Since the start of the coronavirus disease 2019 (COVID-19) pandemic in early 2020, there has been wide reporting of growing anti-Asian attacks across the United States and other Western countries (Tessler, Choi, and Kao 2020). From 2019 to 2020, anti-Asian hate crimes increased by 150 percent in major U.S. cities (Center for the Study of Hate and Extremism 2021). Since March 2020, Stop AAPI Hate has lodged more than 3,700 self-reports of anti-Asian incidents, with California, New York, and large cities reporting the highest number of incidents (Jeung et al. 2021). Reported incidents are not limited to big cities but are also common in small towns nationwide, which has only deepened the sense of fear among the Asian population (Jeung et al. 2021). Although reports of hate incidents capture only a fraction of the violence and harassment that Asians in the United States have endured, these aggregate figures unequivocally depict an increase in the overall scale of anti-Asian sentiment. Nonetheless, aggregate figures alone are limited for understanding the contexts under which Asians encounter discrimination. For instance, hate incidents are likely underreported (Zhang, Zhang, and Benton 2022) and not captured per capita, which may lead to a misleading portrayal that anti-Asian sentiment is concentrated in cities or states with large Asian populations. To understand where Asians experience greater discrimination, in this study we examine the contextual factors associated with perceived discrimination among Asians in the United States since the start of COVID-19. We explore whether and how perceived discrimination differs by local context, specifically by Asian concentration across United States counties.
We focus on Asians for several reasons. First, relative to Blacks and Hispanics, Asians have been understudied in the literature on coethnic concentration and perceived discrimination (Camacho, Allen, and Quinn 2019; Hunt et al. 2007). Second, when Asians have been a focus, the findings are mixed. For instance, Walton (2012) found that discrimination was lower in Asian neighborhoods, but Morey et al. (2020) found that it varied by nativity and length of residence. Third, since the onset of COVID-19, Asians have experienced heightened levels of discrimination and worsened mental health (Liu et al. 2020; Wu, Qian, and Wilkes 2021). Taken together, exploring how contextual factors shape anti-Asian racism not only enriches existing literature on coethnic concentration and perceived discrimination but is also crucial for aiding postpandemic recovery among Asian communities and broader racial relations in the United States.
U.S. Counties and Anti-Asian Sentiment during COVID-19
A common approach to assessing coethnic concentration is to measure coethnic populations in residential areas such as neighborhoods and metropolitan areas (Bygren and Szulkin 2010; Conger, Schwartz, and Stiefel 2011; Lee 2016). The assumption is that frequent encounters or interactions among coethnics or people of different racial/ethnic backgrounds are a primary mechanism shaping prejudice or discrimination (Pettigrew 1998). We follow a similar logic. To capture this context, we focus on whether the percentage of Asians, COVID-19 infection rate, and unemployment rate in U.S. counties affect perceived discrimination among Asians.
U.S. counties have been fundamental in shaping COVID-19 responses and individuals’ overall experiences during the pandemic. To illustrate, counties have been primarily responsible for implementing (or not) stay-at-home orders, mask mandates, and other public health measures, and regulating economic activities and essential workplaces (e.g., business and school closures). However, counties vary widely in the timing and content of public health orders and regulations (Lyu and Wehby 2020). For instance, in March 2020, Los Angeles County in California promulgated nine public health orders, whereas Orange County, a neighboring county, implemented only four (Goldhaber-Fiebert et al. 2021). Additionally, there is widespread county-level variation in the severity of COVID-19 infections and economic fallout (Aaronson and Alba 2020; Paul, Englert, and Varga 2021).
County-level differences in COVID-19 severity and pandemic policy responses, in turn, have implications for county-level differences in anti-Asian sentiment. Emergency declarations not only shape individual behaviors under COVID-19 (Weill et al. 2020) but may also influence individuals’ attitudes and prejudices, especially if individuals perceive that unwanted restrictions and their associated economic fallout stem from the responsibility of a racial/ethnic group. In light of the “Chinese virus” rhetoric surrounding the pandemic (Darling-Hammond et al. 2020), people living in counties with a high number of COVID-19 cases or high unemployment may inaccurately blame China, individuals of Chinese descent, or Asian Americans in general. This suggests that Asians living in U.S. counties with higher levels of COVID-19 infections and unemployment may experience greater hostility and discrimination.
The main goal of this study is to examine how coethnic concentration shapes Asians’ experiences of discrimination across U.S. counties during COVID-19. We also assess whether county-level context (e.g., COVID-19 infection rates and unemployment rates) could help explain this relationship (see Figure 1 as a conceptual diagram of this study). Although the relationship between coethnic concentration and perceived discrimination is not new (Morey et al. 2020), we explore how the relationship is sensitive to contextual factors, such as widespread public health crises and sudden changes in unemployment.

Conceptual diagram.
Asian Americans and Residential Patterns
Anti-Asian discrimination has a long history in the United States, although the stereotypes and perceptions of Asian Americans have changed drastically over time. During the nineteenth century, the perception of Asian Americans as unassimilable foreigners was explicitly linked to stereotypes about disease, poor health, threats to safety and health, and untrustworthiness (Lee 2007). In the twenty-first century, prior to the pandemic, Asian Americans were often viewed problematically as a “model minority” because of their relatively high levels of socioeconomic success (Lee and Zhou 2015). The hyperselectivity of many Asian immigrant groups and the overall socioeconomic mobility of Asian Americans contribute to the perception of Asians as exceptionally competent, yet cold and calculating (Lee 2021; Lee and Fiske 2006). Despite Asian Americans’ successful integration into mainstream institutions in the contemporary era, they continue to be marginalized (Kibria 2000). For instance, Asians are often portrayed as unassimilable foreigners because of their physical and cultural differences from White Americans or individuals of European descent (Eichelberger 2007; Lee 2007; Lee and Kye 2016). The pandemic quickly reignited old tropes of Asians as foreign agents who carry disease (Tessler et al. 2020). Since the pandemic, there has been a sharp increase in the perception of Asians as more foreign and less American (Darling-Hammond et al. 2020). Although COVID-19 increased hostility toward Asian Americans, there were rising levels, albeit small, of anti-Asian hate crimes before the pandemic, suggesting some tensions that preceded the pandemic (Zhang et al. 2022).
Asians represent the fastest growing racial group in the United States (Budiman and Ruiz 2021a). In 2000, Asians represented less than 4 percent of the total population compared with approximately 6 percent in 2019. In part, the growth of the Asian population is driven by continuous migration from Asian countries with foreign-born persons comprising approximately 60 percent of the Asian population (Budiman and Ruiz 2021b). Although a large proportion of new Asian immigrants settle in immigrant gateways, such as California, New York, and Texas, there is also movement to other states that are emerging immigrant-receiving states, such as Georgia and Arizona (Portes and Rumbaut 2014).
On the whole, Asians in the United States show higher levels of socioeconomic status than the overall U.S. population, although there is wide variation across Asian subgroups (Budiman and Ruiz 2021b). Relative to the U.S. population, Asians show higher median household incomes ($85,000 vs. $61,800), lower poverty rates (10 percent vs. 13 percent), and a higher proportion of college education or more (54 percent vs. 33 percent). Given the link between socioeconomic status and residential mobility (Charles 2008; Massey and Denton 1985), Asians have been able to move in to more racially mixed residential areas that are comparable with middle-class White areas (Charles 2003; Lee and Kye 2016). In 2010, half of Asians lived in global residential areas where all four racial groups (Whites, Blacks, Hispanics, and Asians) were well represented (Logan and Zhang 2011). Although Asians show moderate levels of segregation from Whites, they still exhibit lower levels of residential segregation than both Hispanics and Blacks (Logan 2013; Logan and Zhang 2011). Nonetheless, Asian population growth, especially resulting from immigration, increases the likelihood that Asians will live with other coethnics (Iceland, Weinberg, and Hughes 2014). This is particularly the case for some of the largest Asian groups, such as Chinese, Koreans, and Indians (Iceland et al. 2014).
Coethnic concentration in residential areas may reflect large shares of first- or second-generation Asians with limited human capital and English proficiency (Logan 2013). Additionally, many Asian immigrant groups, especially Chinese, prefer to move directly into residential areas with more coethnics (Li 1998; Wen, Lauderdale, and Kandula 2009; Zhou 2009). Suburban coethnic residential areas, specifically, have flourished over the past quarter century and remain a viable alternative to majority White residences (Hall 2013; Lee and Kye 2016). In turn, if coethnic residential areas are preferred by some immigrant groups, this preference may inform immigrants’ decision making about which counties or metropolitan areas to reside.
We acknowledge that Asians are a diverse group with origins in more than 40 countries as well as different linguistic backgrounds, migration reasons, premigration human capital, and political affiliation (Morey et al. 2020; Tran et al. 2018). Among the Asian population in 2019, Chinese represent the largest group, constituting about 23 percent of the Asian population, followed by Asian Indians (20 percent) and Filipinos (18 percent) (Budiman and Ruiz 2021b). Despite the heterogeneity and diversity within the larger Asian panethnicity, Asians report a shared experience of racial bias and discrimination (Gee and Ponce 2010).
Coethnic Concentration and Perceived Discrimination
The relationship between coethnic concentration and discrimination is widely debated, specifically the direction, shape, and mechanisms linking the two. We review three distinct perspectives offering different hypothesized relationships between coethnic concentration and perceived discrimination: ethnic enclave perspective, group conflict perspective, and contested boundaries perspective. Using the three theoretical perspectives, we derive hypotheses about the direction and shape of the relationship between Asian concentration and perceived discrimination during COVID-19.
Ethnic Enclave Perspective
The ethnic enclave perspective posits a linear, negative relationship between coethnic concentration and discrimination. According to this perspective, living with coethnics provides a protective effect and thus, is associated with lower levels of discrimination (Camacho et al. 2019; Hunt et al. 2007). This perspective focuses on concentrations of individuals who share the same national origin or racial and ethnic background (Lim et al. 2017; Pong and Hao 2007). Coethnic concentration is often measured using the percentage or number of coethnics residing in a geographical area, such as census tracts or metropolitan areas (Bygren and Szulkin 2010; Conger et al. 2011; Lee 2016). Upon arrival, new immigrants typically live in areas with many coethnics, which were traditionally considered initial settlements that serve immigrants’ immediate needs (Logan, Zhang, and Alba 2002; Massey and Denton 1985). Areas with large coethnic concentrations provide immigrants with linguistic and cultural familiarity, as well as opportunities for accruing social and economic capital (Zhou 2009). Additionally, coethnic concentration may help shield immigrants from discrimination in the primary labor market as a result of the host population’s prejudice or immigrants’ poor language skills (Boyd 1996; Wilson 2003). Thus, from the ethnic enclave perspective, residential areas with higher levels of coethnic concentration are supportive environments that can lower stress and discrimination experienced by minority residents, especially immigrants (Gee 2002; Morey et al. 2020; Mossakowski and Zhang 2014).
Nonetheless, it is unclear how widely the ethnic enclave perspective applies to various racial/ethnic groups and contexts. The ethnic enclave perspective initially focused on immigrants and shows the greatest support among immigrants but receives mixed evidence among nonimmigrants (Gee 2002; Morey et al. 2020; Vega et al. 2011). Additionally, it is unclear whether the effect of coethnic concentration is sensitive to social or economic conditions. For instance, during widespread economic hardship, such as recessions, social and institutional trust may change and individuals may rely more heavily on coethnic networks (Ervasti, Kouvo, and Venetoklis 2019; Zhu, Liu, and Painter 2013). We assess whether coethnic concentration protects Asians against discrimination during times of crises. In short, the ethnic enclave perspective posits that in areas with greater coethnic concentration, Asians will report lower perceived discrimination.
Group Conflict Perspective
The group conflict perspective posits a linear, positive relationship between minority concentration and discrimination because greater minority concentration creates conflict and competition (real or perceived) across groups (Abascal and Baldassarri 2015; Blalock 1957; Blumer 1958; Legewie and Schaeffer 2016). Conflict may arise from competition over scarce resources, economic interests, and access to nonmaterial issues, such as political representation or way of life (Bobo and Hutchings 1996; Legewie and Schaeffer 2016). Additionally, the size of the outgroup is an important mechanism shaping the ingroup’s sense of threat (Blalock 1957).
When the group conflict perspective is applied to residential contexts, the findings indicate that Whites feel a greater sense of threat and become more racially hostile with increasing minority concentrations (Quillian 1996; Rosenstein 2008; Taylor 1998; Taylor and Mateyka 2011). For instance, Whites show lower levels of trust and are more likely to relocate with increasing shares of minorities in their neighborhoods or surrounding areas (Crowder and South 2008; Hou and Wu 2009). Additionally, increasing Black residential concentration is associated with Whites’ greater racial prejudice and opposition to affirmative action policies (Quillian 1996; Taylor 1998; Taylor and Mateyka 2011). In addition to minority group size, economic and political conditions shape racial attitudes (Oliver and Mendelberg 2000). In particular, racial animosity or conflict is heightened during economic stress or macroeconomic contraction (Olzak 1992). Thus, from the group conflict perspective, hostile racial attitudes are motivated by threat, increasing minority population size, and deteriorating economic conditions (Bobo and Zubrinsky 1996; Rosenstein 2008).
Much of the attention, though, focuses on Whites’ prejudicial attitudes or behaviors toward Blacks or toward minorities more generally (Crowder and South 2008; Hou and Wu 2009). Yet the relationship between minority residential concentration and threat differs depending on the minority group, given that Whites express different racial attitudes for each minority group (Blalock 1957; Taylor 1998). For instance, Link and Oldendick (1996) found that Whites showed greatest hostility toward Blacks, followed by Latinos and Asians. Additionally, Taylor (1998) found that greater concentrations of Asians and Latinos in the metropolitan area had no effect on Whites’ race-related attitudes. Nevertheless, the perception of Asians as a threat may be heightened during the COVID-19 pandemic when the economy has suffered and racial attitudes toward Asians have been particularly negative (Dhanani and Franz 2020), a possibility we explore in the current study. In short, from the group conflict perspective, Asians living in areas with higher coethnic concentration will report higher levels of discrimination.
Contested Boundaries Perspective
Third, the contested boundaries perspective posits an n-shaped or curvilinear relationship between coethnic concentration and perceived discrimination. From this perspective, discrimination is greatest in areas where there is a moderate coethnic concentration (Legewie and Schaeffer 2016). Although a range of residential areas exist, the contested boundaries perspective highlights three types with particular significance: areas with low coethnic concentration, moderate coethnic concentration, and high coethnic concentration. Whereas boundaries between groups are clearly demarcated in areas with low and high coethnic concentrations, boundaries are blurred or even contested in areas with a moderate minority concentration, leading to greater conflict between groups (Desmond and Valdez 2012; Grimshaw 1960; Legewie and Schaeffer 2016). There is reduced social cohesion among residents in these areas because of increased conflict and fighting over boundaries. Where there is ambiguity about group rank, the perceived threat from outgroup members may increase (Legewie 2018).
One instance of this is predominantly White residential areas with moderate minority populations (Crowder 2000; Legewie and Schaeffer 2016). In contrast to residential areas that have small or large minority populations, residential areas with moderate minority populations may instead increase Whites’ perceived threat. One reason why a small or large minority area versus a moderate minority area may have different effects on perceived discrimination is because of “tipping points” or Whites’ thresholds toward minority neighbors (Schelling 1971). Whereas most Whites tolerate small concentrations of minority neighbors, minority concentrations beyond the tipping threshold may increase Whites’ perceived threat (Clark 1991). Therefore, from this perspective, Asians living in areas with moderate coethnic concentrations will report higher levels of discrimination than those living in areas with low or high coethnic concentrations.
Methods
Data
Our study relies on data from four sources. The main source is the Understanding Coronavirus in America tracking survey, conducted by the University of Southern California’s Center for Economic and Social Research. Respondents of the survey are members of the Understanding America Study (UAS), which is a nationally representative Internet panel of American households including approximately 8,500 U.S. adults 18 years and older. The 1st wave was fielded from March 20 to April 1, 2020, and subsequent longitudinal waves were repeated every two weeks. At the time of this study, the 29th wave, conducted from June 9 to July 21, 2021, was the most recent data. Questionnaires, codebooks, and a majority of the data are publicly available through the UAS Web site (https://uasdata.usc.edu/index.php).
Although the Understanding Coronavirus in America tracking survey is publicly available, we analyze a nonpublic version that links survey respondents with the characteristics of their counties of residence (e.g., percentage of Asians, COVID-19 case rate, unemployment rate). Currently, nonpublic UAS data are accessible per approval and include blinded location indicators when linking county-level data with the survey data from respondents. In other words, even in nonpublic UAS data, actual location codes (e.g., ZIP codes and county codes) are not made available to researchers. Although it would be ideal to have detailed and time-varying contextual information about the counties where respondents live, we do not have this information in our nonpublic version of UAS data. Despite this limitation, the UAS provides the most comprehensive data for examining Asians’ geographic concentration and perceived discrimination during COVID-19.
This study focuses on how Asians perceive discrimination during the COVID-19 pandemic. We restrict our sample to respondents who identify as Asian, including single-race and mixed-race individuals. We exclude data from waves 7 and 9 because perceived discrimination was not surveyed. After listwise deleting observations with missing values for the variables used, we obtain a total of 10,766 person-wave observations across 27 waves. A total of 569 Asians participated, but the exact number of Asians varied from wave to wave.
We attach five county-level indicators from external sources to survey respondents in the UAS. We include county-level percentage of Asians, social inequality (Gini coefficient), and median household income. These three indicators were obtained from the Geography of Social Capital in America Project of the U.S. Congress Joint Economic Committee (2018) and captured before the pandemic, from 2012 to 2018, which are currently the most up-to-date data available for these indicators. We also include cumulative COVID-19 cases per 1,000 population for each county, as of July 25, 2021, obtained from Johns Hopkins University’s COVID-19 Data Repository (Dong, Du, and Gardner 2020). Our last county-level indicator is 2020 unemployment rates from the Bureau of Labor Statistics (2021).
Measures
Our dependent variable is perceived discrimination, which we derive from four questions in the Understanding Coronavirus in America tracking survey. Respondents were asked whether, during the past two weeks, they were treated with less courtesy and respect, received poorer service, were threatened or harassed, and were the subject of other people’s fear (Williams et al. 1997). All four questions were answered on a 3-point scale (0 = no, 1 = unsure, 2 = yes). We combine the four items to create a scale ranging from 0 to 8, with higher scores indicating higher levels of perceived discrimination (Wu et al. 2021). We examine perceived discrimination by Asians because it captures everyday forms of discrimination and affects individual well-being, stress, and mental health (Small and Pager 2020; Wu et al. 2021).
Our main predictor is coethnic (Asian) concentration at the county level, as measured by the percentage of Asians in each county. The percentage ranges from 0.1 percent to 41.9 percent. We notice that counties in California and Hawaii have the highest levels of Asian concentration, with many containing more than 30 percent of Asians (see Figure A1 in Appendix A). In addition, the majority of Asian respondents (75 percent) resided in counties within the state of California. Therefore, in our regression models, we include two dummy variables indicating whether respondents resided in Hawaii or California relative to other states. In supplementary analysis, we experimented with including dummy variables for all states of residence but it did not improve the model fit (p value of the likelihood ratio test = .61). We therefore opted for the more parsimonious models with indicators for Hawaii and California only.
We consider two key county-level variables that may shape intergroup conflicts and anti-Asian racism and therefore help explain the relationship between coethnic concentration in the county and Asians’ perceived discrimination. One is the 2020 unemployment rate by county and the other is the severity of the COVID-19 pandemic situation measured by confirmed cases of COVID-19 per 1,000 population as of July 25, 2021. We use county-level cumulative COVID-19 cases, and Figure A2 in Appendix A shows that they are highly correlated with the corresponding COVID-19 case numbers from the previous year (i.e., cumulative cases as of July 25, 2020).
We also include a series of sociodemographic controls: gender, age, education, household income, marital status, job change, and immigration status. Gender is measured through a dummy variable, with 1 indicating women and 0 indicating men. Age is measured as a continuous variable in years. Education level ranges from 2 (up to fourth grade) to 16 (doctoral degree) in our sample. Household income level ranges from 1 (<$5,000) to 16 (≥$150,000). Marital status contains three categories: married (reference category), never married, and previously married (including separated, divorced, or widowed). Job change is a dichotomous measure of whether the respondent has experienced job change since the pandemic started or not (reference category). Immigration status distinguishes between foreign-born and U.S.-born respondents (reference category). We also include two continuous county-level controls: Gini coefficient and median household income. Table 1 reports the descriptive statistics for our variables.
Descriptive Statistics for Key Variables In Analysis.

Note: We report percentages for dichotomous variables. COVID-19 = coronavirus disease 2019.
Analytic Strategy
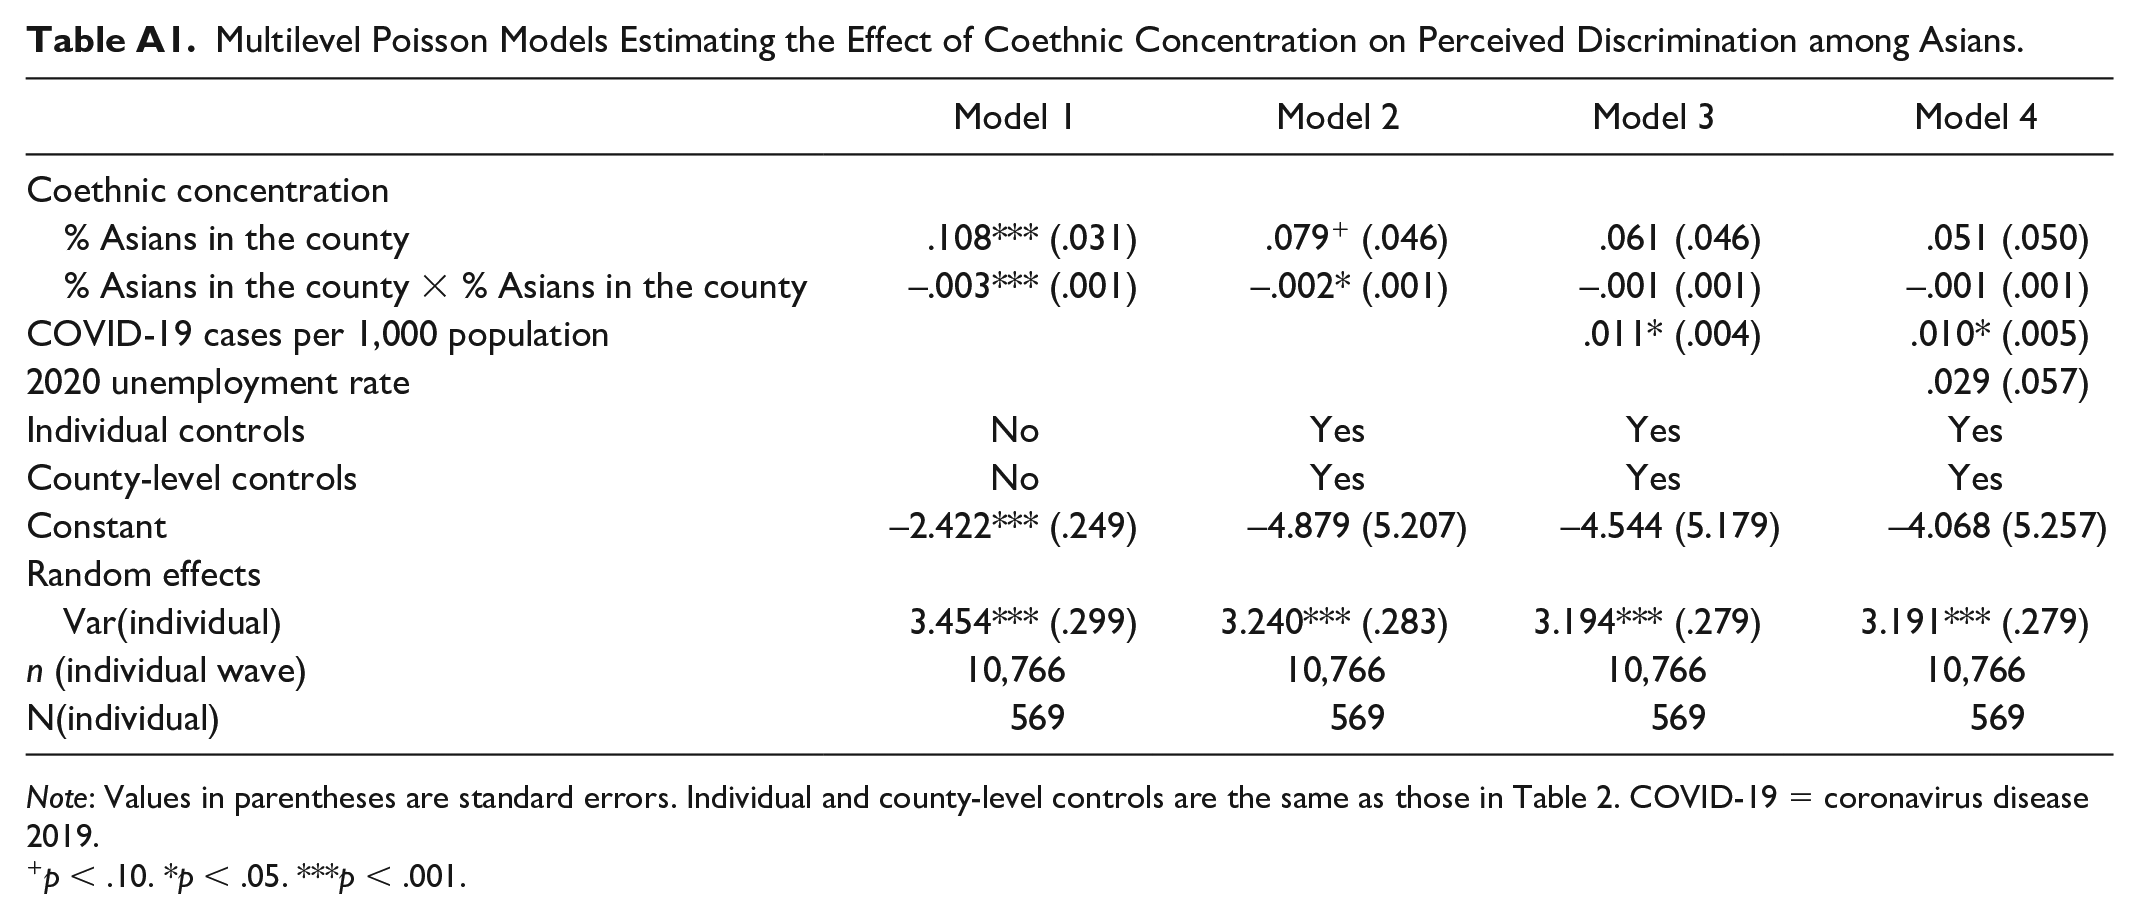
Our analysis involves three steps. First, we descriptively examine the association between the percentage of Asians in the county and perceived discrimination among Asians. This analysis provides a general picture about how Asians’ perceived discrimination is correlated with coethnic concentration. Second, we use multilevel negative binomial models to estimate the contextual effects of coethnic concentration on perceived discrimination among Asians. Multilevel modeling is used given the data structure (individual-wave observations nested within individuals). We treat the composite scale of perceived discrimination as a count variable. Because the dependent variable is over-dispersed (variance [2.39] > mean [0.61]), we use the negative binomial specification for statistical estimations to account for overdispersion (Long 1997). Figure 2 presents the observed proportions along with the Poisson and negative binomial probabilities for perceived discrimination. Indeed, we find that the negative binomial probability curve fits the data better than the Poisson probability curve. As robustness checks, supplementary analysis shows that our results are substantively the same if we use multilevel Poisson models (see Table A1 in Appendix A).

Comparing the fit of negative binomial versus Poisson models.
Finally, in our regression models, we add county-level COVID-19 cases per 1,000 population and unemployment rates to investigate whether they help explain the relationship between coethnic concentration and perceived discrimination among Asians.
Results
To begin, we consider the descriptive association between coethnic concentration of Asians and their perceived discrimination. Figure 3 shows the scatterplot between the percentage of Asians and perceived discrimination among Asians at the state level (Figure 3A) and county level (Figure 3B). Overall, we see a curvilinear association between coethnic concentration and perceived discrimination among Asians. As the level of coethnic concentration increases, it produces varying impacts on Asians’ perceived discrimination. Initially, Asian concentration appears positively associated with perceived discrimination. However, there is a turning point as the level of Asian concentration reaches about 15 percent to 20 percent. The increase in Asian concentration beyond 20 percent is associated with lower perceived discrimination among Asians. This curvilinear pattern exists across Figures 3A and 3B. Figure 3A shows a more positive association at the state level, possibly because all the U.S. states in the graph have lower than 15 percent of Asians. In Figure 3B, the county-level pattern represents a fuller picture of the association between Asian concentration and perceived discrimination, with Asian concentration showing a wide range. Our regression analysis focuses on estimating the relationship between county-level coethnic concentration and perceived discrimination among Asians.

Scatterplot between coethnic concentration and perceived discrimination among Asians.
Next, in Table 2, we use multilevel negative binomial models to understand how county-level coethnic concentration is related to Asians’ perceived discrimination. Note that the significant dispersion parameter ln(α) across all four models (p < .001) lends support to the use of negative binomial models over Poisson regression models. 1 To capture the curvilinear association, all models include coethnic concentration (percentage Asians) and its squared term. Model 1 includes only our major predictors and shows that both the percentage of Asians and its squared term are significant (p < .001). According to model 1, Asians’ perceived discrimination among Asians initially increases as the percentage of Asians in the county increases from 0 percent to 18.7 percent (0.112/[0.003 × 2]); as the percentage of Asians continues to increase, perceived discrimination among Asians starts to decrease. In model 2, we add individual and county-level controls, and the n-shaped relationship between the percentage of Asians and perceived discrimination among Asians remains because the squared term of the percentage of Asians is still significant (p < .05).
Multilevel Negative Binomial Models Estimating the Effect of Coethnic Concentration on Perceived Discrimination among Asians.

Note: Values in parentheses are standard errors. To be more precise, the coefficient for “% Asians in the county × % Asians in the county” is –0.00306 in model 1 (p = .000), –0.00241 in model 2 (p = .036), –0.00174 in model 3 (p = .138), and –0.00155 in model 4 (p = .212). COVID-19 = coronavirus disease 2019.
p < .10. *p < .05. ***p < .001.
In models 3 and 4, we consider whether county-level COVID-19 infection rates and unemployment rates help explain the significant curvilinear association between Asian concentration and perceived discrimination among Asians. In model 3, we include COVID-19 cases per 1,000 population, which shows two findings. First, COVID-19 infection rates at the county level have a significant and positive impact on Asians’ perceived discrimination (b = 0.011, p < .05). This suggests that higher rates of COVID-19 cases are associated with higher levels of anti-Asian prejudice. Second, when county-level COVID-19 cases per 1,000 population are included in model 3, the coefficients for the percentage of Asians and its squared term are no longer significant. This finding suggests that the county-level severity of the COVID-19 infection helps explain the association between coethnic concentration and Asians’ perceived discrimination. Therefore, the higher levels of perceived discrimination observed in counties with moderate levels of Asian concentration are driven largely by COVID-19 infection rates (see Figure A3 in Appendix A). Finally, in model 4, we add county-level unemployment rates in 2020 to assess whether the economic situation during COVID-19 helps explain the relationship between the percentage of Asians and perceived discrimination. We find no significant effect of county-level unemployment rates on perceived discrimination among Asians (b = 0.028, p > .05). Likewise, controlling for unemployment rates does not change the significance of the coefficients for the percentage of Asians or its squared term.
To facilitate the interpretation of the results in nonlinear models (such as negative binomial models in our case), we follow Mize, Doan, and Long’s (2019) advice to present the predicted values of perceived discrimination in Figure 4 by Asian concentration. Figures 4A to 4D are created, respectively, on the basis of models 1 through 4 in Table 2. Figure 4A is the baseline model without any covariates and shows that as the percentage of Asians in the county increases from 0 percent to about 18 percent, Asians’ perceived discrimination increases nearly threefold, from 0.48 to 1.32. However, as the percentage of Asians in the county increases from 18 percent to about 40 percent, Asians’ perceived discrimination decreases from 1.32 to 0.31. Clearly, the relationship between the percentage of Asians and perceived discrimination is curvilinear or n shaped.

Predicted values of Asians’ perceived discrimination by the percentage of Asians in the county.
Figure 4B shows that after including individual controls, county-level Gini coefficient, and median household income, the n-shaped curvilinear relationship between the percentage of Asians and perceived discrimination remains evident. In Figure 4C, after we include COVID-19 cases per 1,000 population, the dotted line becomes flatter, indicating that COVID-19 infection rates help explain the relationship between the percentage of Asians at the county level and perceived discrimination. Last, in Figure 4D, we further control for county-level unemployment rates in 2020, and the predicted values of perceived discrimination by county-level Asian concentration remain very similar to those in Figure 4C.
Taken together, the results from Figure 4 suggest that the n-shaped association between coethnic concentration and perceived discrimination among Asians is in part explained by the severity of the COVID-19 infection rate in the county whereas county-level unemployment rates explain little (if any) of the association.
Discussion and Conclusion
There are two major findings of our study. First, we find that across U.S. counties, there is an n-shaped association between coethnic concentration and perceived discrimination among Asians since the start of the COVID-19 pandemic. Asians perceive the lowest level of discrimination when coethnic concentration in their county is low or high. In contrast, Asians perceive the highest discrimination in counties with a medium concentration of Asians (about 18 percent). The major contribution of our study is to show that the relationship between coethnic concentration and perceived discrimination during COVID-19 does not work in a linear fashion but rather exhibits a curvilinear pattern.
Our findings show evidence of the contested boundaries hypothesis that areas with a medium level of Asian concentration are associated with greater perceived discrimination. Our results are consistent with Crowder (2000) and Legewie and Schaeffer (2016), who also found nonlinear effects of minority residential concentration. Although it is beyond the scope of this study to test the causal mechanisms underlying this relationship, our findings are consistent with Schelling (1971) on tipping points. Whites may perceive greater threat in counties with moderate Asian concentrations, which in turn could heighten discrimination toward Asians. Perceptions, whether real or distorted, have consequences for attitudes toward immigrants and minorities (Alba, Rumbaut, and Marotz 2005). As Abascal (2020) found, when Whites experience a threat to their group status, they are more likely to harden their boundaries and redefine White membership to be more exclusive.
Additionally, it is possible that the COVID-19 crisis may have made racial boundaries even more contested and this could be exacerbated in these counties. During the pandemic, Asian Americans as a whole, regardless of nativity, were racialized and perceived as foreigners (Tessler et al. 2020). Many non-Asians in the United States viewed the virus as foreign and Asians as agents spreading the virus (Ellerbeck 2020). Counties with moderate Asian concentrations may be perceived by non-Asians as areas with large foreign-born Asian populations, which may have heightened the visibility of Asians in these counties and increased their experiences of racialization, conflict, and perceived discrimination (Goto, Gee, and Takeuchi 2002; Morey et al. 2020; Viruell-Fuentes et al. 2013). Our findings suggest that everyday forms of discrimination were the most salient among Asians living in counties with moderate coethnic concentration.
Future research may assess whether areas with moderate Asian concentrations have also experienced rapid increases in their minority populations prior to COVID-19. It is possible that such demographic changes have led to greater levels of perceived threat or lower trust among Whites, which may in turn lead to greater prejudice toward non-Whites, including Asians. Although we observe individuals over a 16-month period, our data do not provide information on changes in residential patterns over long periods of time. In our sample, we find that respondents residing in counties with a medium level of Asians are mainly from California, Illinois, New York, New Jersey, Oregon, Texas, Washington, and Virginia. The 2020 census revealed that in the past decade, numerous counties within these states have experienced White population loss and minority population increases, which lends support to the argument that changing minority populations over time could be driving this effect (Frey 2020). More comprehensive and detailed data on county-level racial and ethnic composition could help confirm this.
Our findings also show that once the percentage of Asians reaches beyond the medium level, further increases in coethnic concentration are associated with decreases in perceived discrimination. This finding is partially consistent with the ethnic enclave hypothesis. Whereas the ethnic enclave hypothesis posits a linear, negative relationship between coethnic concentration and discrimination, our findings extend this by showing a threshold effect and that the coethnic community is protective only after coethnic concentration is moderately high. Furthermore, our results show that large concentrations of coethnics may offer a protective factor against discrimination even during periods of intense racial conflict and economic recessions. Although the effects of ethnic enclave hypothesis have focused primarily on how living with coethnics can provide solutions to discrimination in the primary labor market (Boyd 1996; Wilson 2003), our findings show that during periods of heightened racial unrest, living with a high percentage of coethnics continues to provide a protective effect against perceived discrimination.
Future research may examine the mechanisms that contribute to the protective effect of the coethnic community. For example, it is possible that in counties with high levels of coethnic concentration, Asians have fewer encounters or interactions with people from other racial and ethnic groups, or alternatively, the large presence of Asians may change the dominant racial discourses and how Asians are treated in local areas. In addition, future research may extend our work by considering other racial and ethnic groups during times of crisis. It remains an open question of whether the coethnic community may still act as a refuge against discrimination for groups that did not face the same scrutiny or public visibility. We also note that in our sample, counties with high Asian concentrations are mainly located in California and Hawaii. If data become available, future research should examine coethnic concentration and Asians’ perceived discrimination in more disaggregated geographic areas that may contain greater variations in Asian concentration (e.g., by ZIP code or census tract).
Second, we find that the severity of the COVID-19 pandemic situation helps explain the relationship between coethnic concentration and perceived discrimination among Asians. This finding does not show strong support for the group conflict perspective which posits heightened prejudice or conflict arising from greater perceived competition during economic stress (Oliver and Mendelberg 2000; Olzak 1992). Rather, our results show evidence that racial tensions during COVID-19 were exacerbated for Asians living in U.S. counties with high COVID-19 infection rates. One potential reason why COVID-19 infection rates help explain the relationship between Asian concentration and perceived discrimination is related to the public perception of the Chinese government’s role in COVID-19 originating out of Wuhan. In June 2020, nearly half of Americans believed that China should be held accountable for its role in the pandemic (Silver, Devlin, and Huang 2020). Chinese are the largest Asian group in the United States, and Chinese ethnicity tends to be conflated with the Asian panethnic group and vice versa (Lee 2021). Thus, anti-China and anti-Chinese sentiment may be projected more broadly to anti-Asian sentiment during a public health crisis that first appeared in China.
This research is not without limitations. Our study faces well-known methodological challenges in estimating the effects of residential coethnic concentration. Selection bias is an issue as it is possible that Asians who perceive greater levels of discrimination are forced into particular residential areas (Iceland and Wilkes 2006). Thus, perceived discrimination may reflect selection into certain counties rather than a result of the coethnic concentration in the county. Related, it is also possible that Whites or non-Asians living in areas with high levels of Asians are selective of individuals who are more tolerant of non-White residential areas (Bobo and Zubrinsky 1996). Another limitation is that it is unclear how generalizable our findings are to a context outside of the pandemic. For instance, prior to COVID-19, Asians may have experienced some protection from a model minority stereotype and low levels of harassment (Ramakrishnan et al. 2017), though there is evidence of minor increases in anti-Asian discrimination before the pandemic (Zhang et al. 2022). Research with comparable data from both before and during the pandemic would better identify the role of the COVID-19 pandemic in shaping anti-Asian discrimination and its linkages to county-level contextual factors.
Overall, this study shows that the context of medium Asian concentration together with high COVID-19 infection rates created a particularly hostile environment for Asians during the pandemic. To better understand the future of racial relations in postpandemic America, more research is needed to assess contextual factors and perceived discrimination among Asians in the evolving social, economic, and political landscapes.
Research Data
sj-docx-1-srd-10.1177_23780231221124580 – Research Data for Coethnic Concentration and Asians’ Perceived Discrimination across U.S. Counties during COVID-19
Research Data, sj-docx-1-srd-10.1177_23780231221124580 for Coethnic Concentration and Asians’ Perceived Discrimination across U.S. Counties during COVID-19 by Rennie Lee, Yue Qian and Cary Wu in Socius
Footnotes
Appendix A
Table A1.
Multilevel Poisson Models Estimating the Effect of Coethnic Concentration on Perceived Discrimination among Asians.
| Model 1 | Model 2 | Model 3 | Model 4 | |
|---|---|---|---|---|
| Coethnic concentration | ||||
| % Asians in the county | .108*** (.031) | .079 + (.046) | .061 (.046) | .051 (.050) |
| % Asians in the county × % Asians in the county | –.003*** (.001) | –.002* (.001) | –.001 (.001) | –.001 (.001) |
| COVID-19 cases per 1,000 population | .011* (.004) | .010* (.005) | ||
| 2020 unemployment rate | .029 (.057) | |||
| Individual controls | No | Yes | Yes | Yes |
| County-level controls | No | Yes | Yes | Yes |
| Constant | –2.422*** (.249) | –4.879 (5.207) | –4.544 (5.179) | –4.068 (5.257) |
| Random effects | ||||
| Var(individual) | 3.454*** (.299) | 3.240*** (.283) | 3.194*** (.279) | 3.191*** (.279) |
| n (individual wave) | 10,766 | 10,766 | 10,766 | 10,766 |
| N(individual) | 569 | 569 | 569 | 569 |
Note: Values in parentheses are standard errors. Individual and county-level controls are the same as those in Table 2. COVID-19 = coronavirus disease 2019.
p < .10. *p < .05. ***p < .001.
Funding
The authors disclosed receipt of the following financial support for the research, authorship, and/or publication of this article:Rennie Lee received support from the Australia Research Council Centre of Excellence for Children and Families over the Life Course (CE200100025). Yue Qian and Cary Wu received support from the Canadian Institutes of Health Research (funding number: OV7-170372 for Qian; FRN-170368 for Wu). Any opinions, findings, and conclusions or recommendations expressed in this paper are those of the authors and do not necessarily reflect the views of the funders.
Notes
Author Biographies
References
Supplementary Material
Please find the following supplemental material available below.
For Open Access articles published under a Creative Commons License, all supplemental material carries the same license as the article it is associated with.
For non-Open Access articles published, all supplemental material carries a non-exclusive license, and permission requests for re-use of supplemental material or any part of supplemental material shall be sent directly to the copyright owner as specified in the copyright notice associated with the article.