
Abstract
Transportation insecurity is a condition in which a person is unable to regularly move from place to place in a safe or timely manner and has important implications for the study of poverty and inequality. Drawing on nationally representative survey data and a new, validated measure of transportation insecurity, the Transportation Security Index, the authors provide the first descriptive portrait of transportation insecurity in the United States, offering national estimates, examining which demographic groups are most likely to experience this condition and considering what factors are correlated with it. The authors find that one in four adults experience transportation insecurity. Adults who live in poverty, do not own cars, live in urban areas, are younger, have less education, and are non-White experience the greatest transportation insecurity. Correlates analyses largely confirm these descriptive differences. Such high rates and large disparities suggest that greater investigation into this form of material hardship is warranted.
Ethnographic depictions of the everyday lives of Americans living below the poverty line reveal that for those for whom resources are scarce, being able to regularly move from place to place in a safe or timely manner can be difficult (see, e.g., Abramson 2015; Duck 2015; Edwards 2018; Hamer 2011; Seefeldt 2016; Stack 1974; Stuart 2021). This form of material hardship, which Gould-Werth, Griffin, and Murphy (2018) call “transportation insecurity,” is generally understudied by sociologists. This is true even of research that explicitly investigates material hardship among Americans. Indeed, although such studies typically consider a wide range of hardship domains (including bill-paying, health, food, housing, consumer durables, neighborhood problems, and fear of crime), reflecting the fact that there are no transportation hardship questions collected in most surveys, rarely is transportation hardship taken into account (see, e.g., Beverly 2001; Iceland 2021; Pilkauskas, Campbell, and Wimer 2017; Rodems and Shaefer 2020).
Yet although understudied, transportation insecurity has important implications for a range of phenomena central to the sociological study of poverty and inequality. For instance, problems with transportation are commonly cited as a primary reason people miss or delay medical appointments (Syed, Gerber, and Sharp 2013) or leave prescriptions unfilled (Hensley et al. 2018), with consequences for individual health outcomes (Etminani-Ghasrodashti, Kan, and Mozaffarian 2021; Evans and Lien 2005; Welty, Willis, and Welty 2010). Studies evaluating housing mobility programs show that transportation access shapes neighborhood selection in ways that likely reproduce existing patterns of residential segregation (Briggs, Popkin, and Goering 2010; Jeon, Dawkins, and Pendall 2018). Similarly, transportation is cited as a barrier parents face in being able to take advantage of “school choice policies” (whereby children can enroll in any school within a district), thereby shaping education outcomes (Ewing 2020; Wilson et al. 2010). Qualitative research also suggests that problems with transportation create significant hurdles for former prisoners reentering society in ways that can make them vulnerable to rearrest (Harding, Morenoff, and Wyse 2019; Miller 2021; Simes 2021; Western 2018). And a large body of research has demonstrated the adverse impact that inadequate access to transportation has on obtaining and maintaining employment and on earnings with implications for the reproduction of poverty (Blumenberg and Pierce 2014; Raphael and Rice 2002; Smart and Klein 2020).
But what share of adults in the United States experience transportation insecurity? Which demographic groups are most likely to experience this condition? And what factors are correlated with it? To date, scholars have not been able to answer these important questions. In large part this is because they have lacked a measure of transportation insecurity to do so and instead relied on proxy measures of transportation insecurity, such as physical distance, commute times, or mode of transit (for an extended discussion, see Gould-Werth et al. 2018). This research fills this gap by providing the first descriptive portrait of transportation insecurity in the United States. Specifically, we draw on nationally representative survey data and a new, validated measure of transportation insecurity, the Transportation Security Index (TSI), to provide national estimates of transportation insecurity in the United States, examine which demographic groups are vulnerable to experiencing this condition, and consider some of the correlates of transportation insecurity.
As this is the first study to shed light on the contours of transportation insecurity in the United States, it is both exploratory and descriptive in nature. We find that one in four adults experience transportation insecurity. Adults who live in poverty, do not own cars, live in urban areas, are younger, have less education, and are non-White experience the greatest transportation insecurity. Correlates analyses largely confirm these descriptive differences. These high rates and large disparities in the experience of transportation insecurity suggest that greater scholarly investigation into this condition and its implications for wellbeing, poverty, and inequality is warranted. Given that this research is a first step in understanding transportation security in the United States, we conclude with suggestions for future research that will deepen our understanding of the preliminary patterns identified here.
Data, Measures, and Methods
We use data from an original survey that was fielded in 2018 using GfK’s nationally representative online panel, the KnowledgePanel®. Members of this panel are recruited first using address-based sampling methods and are then selected using probability-based sampling methods, resulting in a sampling frame that covers approximately 97 percent of all U.S. households (Knowledge Networks 2011). Those who do not have Internet access or a computer are provided with free Internet service and a Web-enabled device. The KnowledgePanel® sample frame’s coverage of minority racial and ethnic groups and households with low incomes, groups of interest in this study, is better than that of most random-digit-dialing samples (Dennis 2010). KnowledgePanel® data are also aligned with benchmarks from U.S. census data (Yeager et al. 2011) and has been used in research published in a number of social science peer-reviewed journals (see, e.g., Bonikowski, Feinstein, and Bock 2021; Flores 2018; Pedulla and Pager 2019; Salazar et al. 2019).
To ensure that our results were not affected by the unique transportation behaviors of college-aged young adults, we restricted our sample to individuals ages 25 and older. To make sure that we had sufficient sample to study those living in poverty, we included an oversample of individuals living in households at or below 100 percent of the federal poverty line. The original panel included 4,627 respondents, 2,447 completed the screening survey 1 (53 percent response rate), and 2,011 met the eligibility criteria for the study. Twelve more respondents were excluded from the final sample because they did not complete all 16 items of the TSI, resulting in a final analytic sample of 1,999 respondents.
GfK designed weights to adjust for the oversample of lower income households and to account for complex survey design and unit nonresponse to ensure that the analytic sample was nationally representative. In Table A1 in the Appendix, we show a comparison of some demographics of the KnowledgePanel® respondents with respondents in the 2018 Current Population Survey, a nationally representative survey conducted by the U.S. Census Bureau. As the table illustrates, the weighted characteristics of the KnowledgePanel® respondents are very similar to national estimates, although respondents in our sample are somewhat less likely to own a car and somewhat more likely to report annual incomes more than $75,000.
Transportation Insecurity
To measure transportation insecurity, we use the TSI, a 16-item, validated measure designed to directly capture the experience of transportation insecurity at the individual level, regardless of geography or mode of transit (Murphy, Gould-Werth, and Griffin 2021). Modeled after the Food Security Index and informed by extensive qualitative research, items in the TSI ask respondents to report how often in the past 30 days they have experienced a given symptom of transportation insecurity (see the Appendix for all 16 items). Symptoms include material symptoms that reflect difficulty getting from place to place in a safe or timely manner, such as not being able to leave the house or having to reschedule an appointment because of problems with transportation. They also include subjective symptoms that reflect the social strains and emotional toll that arise because of transportation problems, such as worrying about inconveniencing those one relies on for rides or feeling bad about not having transportation to meet one’s needs.
Each item in the TSI is scored on a three-point scale—never (0), sometimes (1), and often (2)—with a total possible sum score ranging from 0 to 32 (α = 0.95). To differentiate among people who experience different levels of transportation insecurity, we use the five-category measure of transportation insecurity identified by Murphy et al. (2022): no insecurity/secure (sum scores ranging from 0 to 2) includes those who can regularly move from place to place in a safe or timely manner; marginal insecurity (scores of 3 to 5) includes those who have transportation-related concerns but are able to get to essential destinations; low insecurity (scores of 6 to 10) includes those whose travel to destinations is somewhat constrained; moderate insecurity (scores of 11 to 16) includes those who experience constrained travel and experience negative feelings related to transportation insecurity (e.g., feeling bad or embarrassed about their transportation situation); and high insecurity (scores of 17 to 32) includes those who routinely experience constrained travel, some so much so that they report frequently skipping trips and being unable to leave the house altogether, and who also experience negative feelings related to transportation insecurity. This scale allows us to examine differences in the severity of transportation insecurity; however, we also construct a binary version of transportation insecurity that captures any insecurity (0 = secure, 1 = not secure [i.e., marginal, low, moderate, or high insecurity]).
Other Variables
Because this study is largely exploratory and our goal is to shed light on which groups experience transportation insecurity, we study variation in the prevalence of transportation insecurity among demographic groups that are traditionally more likely to experience poverty and material hardship (women, non-White households, younger individuals, those with less education, immigrants, households with children) and who may similarly face greater levels of transportation insecurity. Specifically, we examine gender (female), race/ethnicity (non-Hispanic White, non-Hispanic Black, Hispanic, and other race/ethnicity), age (25–39, 40–64, and ≥65 years), education (less than high school, high school, some college, and bachelor’s degree or higher), immigration status, and the presence of children in the household. The variable for poverty that we use comes from the 2018 U.S. Census Bureau’s federal poverty thresholds: <101 percent of poverty, 101 percent to 200 percent, and 200 percent or greater. Given that cars are the dominant mode of transit in the United States and that car ownership is correlated with poverty as well as people’s ability to get around (see, e.g., Blumenberg and Pierce 2012), we include a car ownership variable. Finally, because differences in the built environment (e.g., density, zoning) shape people’s ability to get around, we also include a measure of urbanicity (urban, suburban, rural) using the Urbanization Perception Small Area Index (Bucholtz, Molfine, and Kolko 2020). In Table 1 we provide weighted descriptive statistics for our full sample.
Sample Characteristics.

Note: The sample is weighted to be nationally representative of adults older than 25 years. Data are from KnowledgePanel®.
Methods
To examine the prevalence of transportation insecurity in the United States, we use weighted descriptive statistics. We then investigate differences in the prevalence of transportation insecurity by demographic groups—poverty level, car ownership status, urbanicity, race/ethnicity, age, gender, presence of children, immigration status, and education—again providing weighted descriptive statistics. Last, we examine whether the descriptive differences we find by demographic groups hold in the multivariate context. This analysis also allows us to explore some of the potential correlates of transportation insecurity. Because the TSI is an index with five cut points, we first ran regressions examining the association between the demographic correlates in our study and transportation insecurity at each cut point (i.e., the correlates of high insecurity vs. the correlates of moderate insecurity). This allowed us to consider whether the correlates varied by level of transportation insecurity. We found that, in general, the correlates of each of the different levels of transportation insecurity were largely similar. Given the similar findings across levels, because the sample sizes for each cut point are quite small (about 150), and for simplicity, in the text we opted to show the results using the binary version of transportation insecurity. 2 However, we present the cut-point analyses in Table A2.
Results
What Share of Adults in the United States Experience Transportation Insecurity?
In Figure 1 we show the overall prevalence of transportation insecurity for adults in the United States. Twenty-four percent of adults 25 years or older have some form of transportation insecurity: 10 percent experience marginal insecurity, 6 percent low insecurity, 5 percent moderate insecurity, and 3 percent high insecurity.

Prevalence of transportation insecurity.
Which Demographic Groups Are Most Likely to Experience Transportation Insecurity?
To better understand who is experiencing transportation insecurity, and differences in levels of transportation insecurity, in Table 2 we show insecurity by demographic groups. 3 We show insecurity using the five-category measure but also show security versus experiences with “any insecurity” (combining marginal, low, moderate, and high).
Transportation Security Index by Demographic Characteristics (Percentage by Row).

Note: N = 1,999. The sample is weighted to be nationally representative of adults older than 25 years. Data are from KnowledgePanel®.
First, we look at differences by poverty-to-needs ratio. The results show a clear pattern: as income increases, the prevalence of transportation insecurity decreases. Moreover, we find that the rate of transportation insecurity among those living in poverty is very high. Not only are those who live in poverty the most likely to experience some form of transportation insecurity (53 percent, the highest of all demographic groups examined here), but those living in poverty are also the most likely to experience the most severe level of insecurity: 15 percent report experiencing high transportation insecurity.
Next, we examine differences in transportation insecurity by car ownership as car ownership is a key mode of transportation and correlated with poverty (Klein and Smart 2017). We find that those who do not own cars are more than twice as likely to experience transportation insecurity (42 percent) compared with car owners (18 percent). And although car ownership is relatively protective of transportation insecurity, nearly a fifth of those who own cars do report some insecurity. That being said, to the extent that car owners experience any insecurity, very few experience the two most severe levels: 3 percent report experiencing moderate insecurity and only 1 percent report experience high insecurity.
Differences by urbanicity reveal two interesting findings. First, those who live in urban areas are more likely to experience transportation insecurity (at all levels of insecurity) than those who live in suburban or rural areas. Second, those living in suburban areas experience higher rates of transportation insecurity than those in rural areas. These findings are somewhat surprising given the extensive literature on transportation being a significant barrier for rural residents (see, e.g., Arcury et al. 2005; Fletcher et al. 2010). Extant literature also finds that poor people disproportionately live in cities because it provides them better access to public transportation (Glaeser, Kahn, and Rappaport 2008), which should suggest less transportation insecurity among urban residents. In an additional analysis we find that urban dwellers are much less likely to own cars than their rural counterparts (62 percent vs. 76 percent) and more likely to be poor (15 percent vs. 9 percent), suggesting that car ownership and poverty may have a role in shaping some of the higher rates of transportation insecurity in urban areas.
When we examine differences by race/ethnicity, we find that White respondents are less likely to experience any level of transportation insecurity (19 percent) than their counterparts who are Black (33 percent), Hispanic (29 percent), or “other” race/ethnicity (46 percent). Moreover, White respondents are less likely to experience high transportation insecurity (2 percent) compared with respondents who are Black (5 percent), Hispanic (4 percent), or “other” race/ethnicity (9 percent). Notably, we find the highest rates of insecurity among those who report “other” race/ethnicity. Unfortunately, because of data limitations we cannot further disentangle this group. These differences by race/ethnicity are notable and likely reflect wider racial differences that have arisen from decades long racist policies and practices that have led to racial segregation, disinvestment in neighborhoods where people of color overwhelmingly reside, and blocked opportunity for these same groups in the labor market. Poverty and urban residence, both more common among Black and Hispanic respondents, thus likely explains some of these differences in transportation insecurity across racial/ethnic groups.
The pattern of transportation insecurity by age shows similar levels of marginal and low insecurity across age groups; however, the youngest group (25–39 years) is far more likely to experience moderate (12 percent) or high (5 percent) insecurity than the older two groups who experience the same levels of moderate (3 percent) and high (2 percent) insecurity. This is surprising given that older adults (≥65 years) are less mobile than those younger than 65 (Collia, Sharp, and Giesbrecht 2003) and are reported to have high unmet travel needs (Luiu, Tight, and Burrow 2016). In a supplemental analysis, we examined car ownership by age and found that those ages 25 to 39 years were equally as likely to own a car as those 40 to 64 years of age (74 percent) and more likely than those older than 65 to own a car (69 percent). This suggests that car ownership does not explain the higher incidence of high insecurity among the youngest group.
Turning to differences by education, we find that those with less than a high school degree are far more likely to experience any insecurity (44 percent) than those with a high school degree or more. Although rates of marginal insecurity were similar across educational groups (ranging from 7 percent to 12 percent), those with less than a high school degree were far more likely to experience higher levels of transportation insecurity. Interestingly, those with high school degrees have the lowest rates of insecurity, but only slightly less than those with some college or college degrees.
In terms of transportation insecurity by respondent’s gender and by the presence of children, there are few notable differences. Finally, although immigrants were somewhat less likely to experience transportation insecurity, the difference was not significant.
What Factors Are Correlated with Transportation Insecurity?
In Table 3, we examine the correlates of transportation insecurity. Although not a comprehensive list, this analysis provides some insight into the correlates of this form of material hardship. This analysis essentially shows whether the descriptive differences we observed in Table 2 (by income-to-needs ratio, car ownership, urbanicity, race/ethnicity, age and education), remain net of (or controlling for) other characteristics.
Correlates of Transportation Insecurity.

Note: Results from linear probability models regressing correlates on a dichotomous variable indicating 1 = transportation insecure (marginal, low, moderate, or high). The regression is weighted to be nationally representative of adults older than 25 years. Data are from KnowledgePanel®.
p < .05. **p < .01.
We find that except for one demographic characteristic, race/ethnicity, we continue to observe a similar pattern of results as those presented in Table 2. Indeed, poverty remains the strongest correlate of insecurity: those who live in poverty are 25 percentage points more likely and those with incomes in near poverty (100 percent to 200 percent) are 8 percentage points more likely to experience transportation insecurity compared with those with incomes greater than 200 percent of poverty. Car ownership also remains a significant correlate of insecurity: those who own cars are 17 percentage points less likely to experience insecurity than those who do not own cars, net of other factors. As was the case in the descriptive analysis, both urban (18 percentage points) and suburban (9 percentage points) respondents are more likely to experience insecurity compared to rural residents. Compared with those older than 65 years, respondents who are ages 25 to 39 years are significantly more likely to experience transportation insecurity (14 percentage points), again similar to the descriptive results. Finally, those without high school degrees are significantly more likely to experience transportation insecurity (11 percentage points) than those with college degrees and, as was the case in the descriptive results, those with high school degrees are somewhat less likely to experience insecurity (6 percentage points).
Results by race/ethnicity, however, differ somewhat in the multivariate context compared with the mean level differences. As Table 3 shows, once we control for other factors, we find no significant differences in the likelihood of experiencing transportation insecurity among Black, White, and Hispanic respondents. Those in the “other” race/ethnicity group remain far more likely to experience insecurity (18 percentage points) compared with White respondents. These findings suggest that once we control for other factors that account for other differences across White, Black, and Hispanic respondents, transportation insecurity rates are quite similar. However, it is important to note that although race/ethnicity is not a significant correlate, this analysis does not negate the fact that there are large mean differences in transportation insecurity rates across racial/ethnic groups. Instead, it suggests that that the structural racism that leads to inequities in rates of poverty, educational attainment, the age distribution, and places of residence drives the inequity in rates of transportation insecurity, primarily through those channels.
Discussion
Using a newly developed measure, the Transportation Security Index, we are the first to document the prevalence of transportation insecurity in the United States. We find that 25 percent of U.S. adults experienced transportation insecurity in 2018, a rate that is far higher than one of the most well studied forms of material hardship: food insecurity (10.5 percent of households (or approximately 12.4 percent of adults); Coleman-Jensen et al. 2021). We also find that those who live in poverty are the demographic group who are most likely to experience transportation insecurity, at 53 percent, a rate that is also much higher than the percentage of people living below the poverty line who were food insecure (35%; Coleman-Jensen et al. 2021). In addition to those living in poverty, we find that those who do not own cars, live in urban areas, are non-White, are younger, or do not have a high school degree are especially likely to experience transportation insecurity.
Although we were not able to test an extensive list of potential correlates of transportation insecurity, the multivariate (or correlates) analysis largely confirmed what we found in the descriptive (or mean) differences. The only exception was race/ethnicity, for which once we controlled for other factors (such as income or urbanicity), the differences in transportation insecurity among Black, White, and Hispanic respondents were rendered insignificant. As noted earlier, this likely reflects how structural racism has contributed to the intersection of race, income and space.
As the first study to paint a portrait of transportation insecurity in the United States, this work is descriptive. Yet we identify patterns that are interesting and worthy of future study. For example, though our finding that the highest rates of transportation insecurity are among those living below the poverty line is perhaps unsurprising, we also find the relationship between poverty and transportation insecurity to be quite complex. For instance, we find no differences in insecurity by gender, nativity, or presence of children in the household, demographic groups that are much more likely to live in poverty. We also find that 19 percent of respondents above 200 percent of poverty experience some transportation insecurity, a finding that is in keeping with research demonstrating that material hardship extends up the income distribution (Iceland, Kovach, and Creamer 2021). Together, these findings indicate that while poverty and transportation insecurity are highly correlated, the predictors of the two differ, an area worthy of future study.
Also worthy of future study are several patterns documented here that are surprising. For instance, we find that respondents living in rural areas are less likely to experience transportation insecurity than those in urban and suburban areas. We also find that those who are 65 years and older are less likely to experience transportation insecurity than their younger counterparts. These findings run counter to the existing transportation literature that finds that rural residents and those older than 65 years have high unmet travel needs (Combs et al. 2016; Luiu et al. 2016) and report transportation as being a barrier to accessing things like health care (Syed et al. 2013; Wolfe, McDonald, and Holmes 2020). At the same time, there is also research indicating that the relationship between rural residence, age, and transportation may be quite complicated (see, e.g., Alsnih and Hensher 2003; Conrad and Ronnenberg et al. forthcoming). This is an area ripe for future inquiry.
The sample used for this study is relatively small, resulting in small sample sizes for some groups. The sample was also drawn prior to the coronavirus disease 2019 pandemic, which resulted in decreases in public transit ridership (DeWeese et al. 2020; Qi et al. forthcoming) and increases in car ownership (Kamer 2020; Plautz 2021). Including the TSI on future surveys will be important for understanding how such changes have affected the landscape of transportation insecurity in the United States, tracing changes in transportation insecurity over time more broadly, unpacking differences by demographic group found in this study, understanding how transportation insecurity cooccurs with other measures of material hardship, and examining its impacts on families and children. Additionally, it will enable researchers to investigate more deeply the implications of transportation insecurity on domains like health, neighborhood attainment, education, mass incarceration, and employment, where existing sociological knowledge about the importance of transportation has been limited to qualitative work or research that uses measures like car ownership as a proxy for transportation insecurity.
To conclude, these data suggest that transportation insecurity warrants greater scholarly attention. Many Americans experience this form of material hardship, a condition that has important implications for phenomena central to the sociological study of poverty and inequality. Yet it is a material hardship we know very little about. Future investigation into transportation insecurity will be especially important for the development of policies that seek to ameliorate this hardship.
Footnotes
Appendix
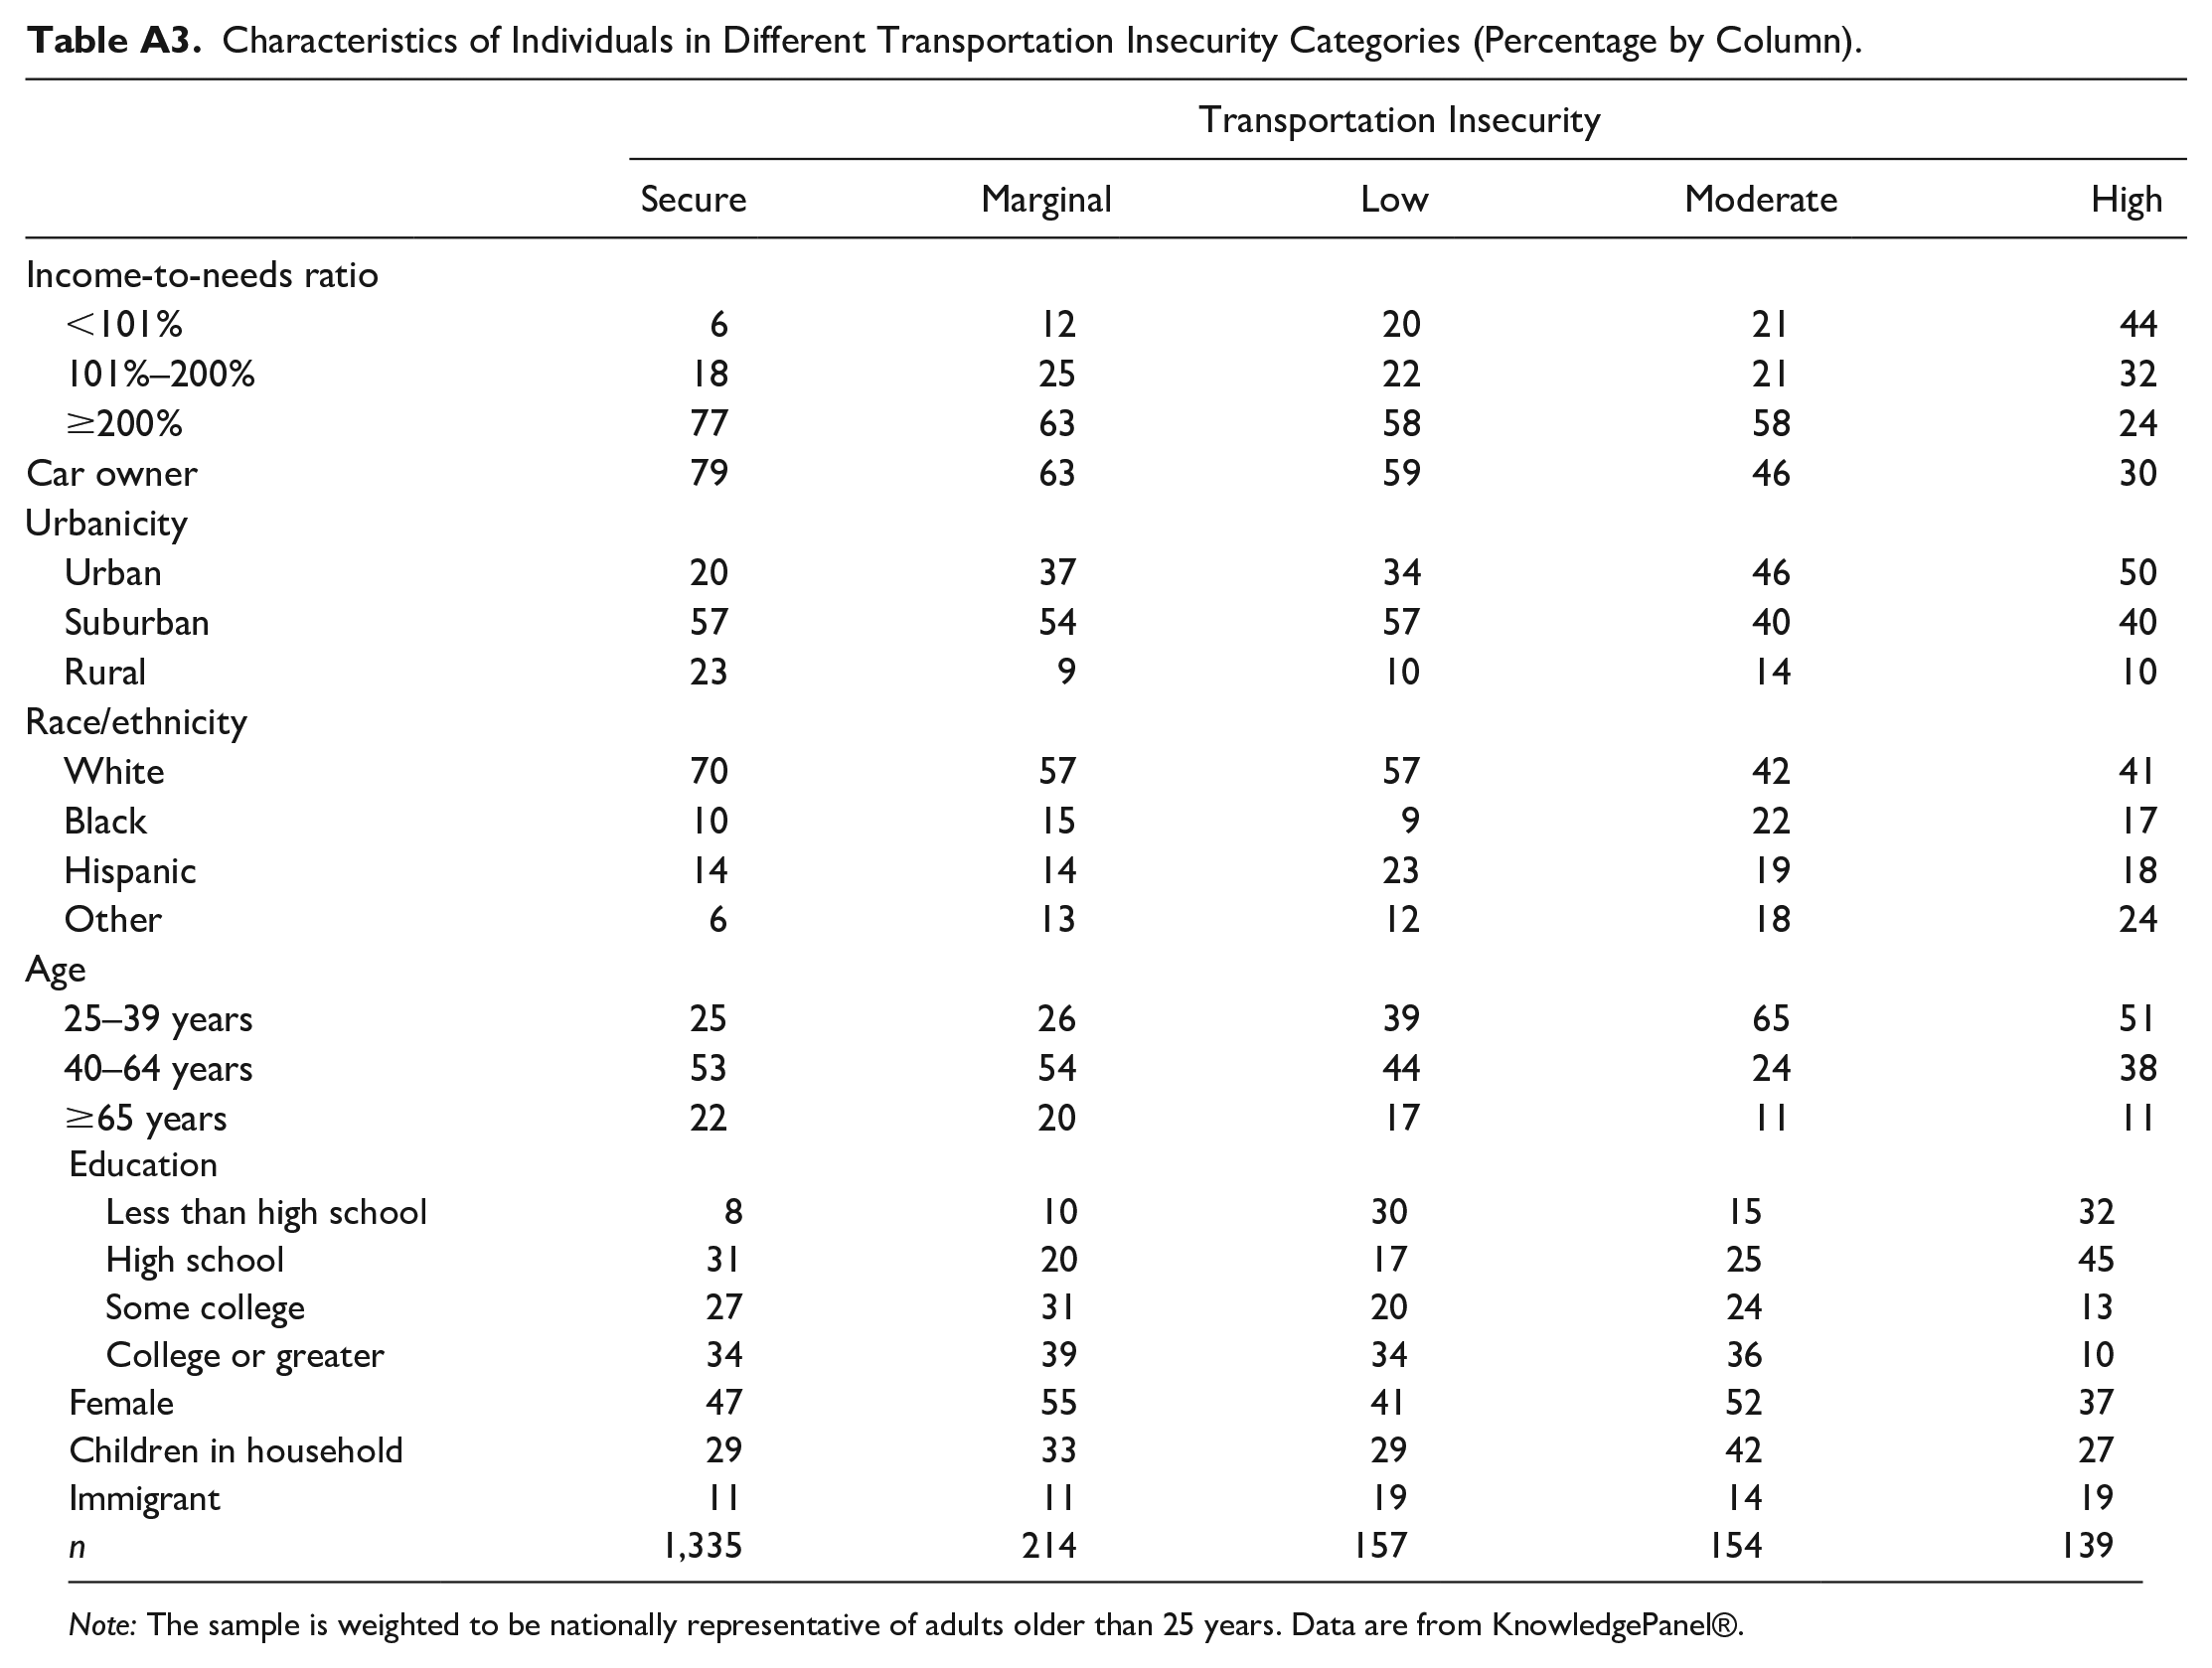
Characteristics of Individuals in Different Transportation Insecurity Categories (Percentage by Column).
| Transportation Insecurity | |||||
|---|---|---|---|---|---|
| Secure | Marginal | Low | Moderate | High | |
| Income-to-needs ratio | |||||
| <101% | 6 | 12 | 20 | 21 | 44 |
| 101%–200% | 18 | 25 | 22 | 21 | 32 |
| ≥200% | 77 | 63 | 58 | 58 | 24 |
| Car owner | 79 | 63 | 59 | 46 | 30 |
| Urbanicity | |||||
| Urban | 20 | 37 | 34 | 46 | 50 |
| Suburban | 57 | 54 | 57 | 40 | 40 |
| Rural | 23 | 9 | 10 | 14 | 10 |
| Race/ethnicity | |||||
| White | 70 | 57 | 57 | 42 | 41 |
| Black | 10 | 15 | 9 | 22 | 17 |
| Hispanic | 14 | 14 | 23 | 19 | 18 |
| Other | 6 | 13 | 12 | 18 | 24 |
| Age | |||||
| 25–39 years | 25 | 26 | 39 | 65 | 51 |
| 40–64 years | 53 | 54 | 44 | 24 | 38 |
| ≥65 years | 22 | 20 | 17 | 11 | 11 |
| Education | |||||
| Less than high school | 8 | 10 | 30 | 15 | 32 |
| High school | 31 | 20 | 17 | 25 | 45 |
| Some college | 27 | 31 | 20 | 24 | 13 |
| College or greater | 34 | 39 | 34 | 36 | 10 |
| Female | 47 | 55 | 41 | 52 | 37 |
| Children in household | 29 | 33 | 29 | 42 | 27 |
| Immigrant | 11 | 11 | 19 | 14 | 19 |
| n | 1,335 | 214 | 157 | 154 | 139 |
Note: The sample is weighted to be nationally representative of adults older than 25 years. Data are from KnowledgePanel®.
Funding
The author(s) disclosed receipt of the following financial support for the research, authorship, and/or publication of this article: The National Science Foundation (NSF) (OIA09936884); Stanford University’s Center on Poverty and Inequality (through funding provided by grant number H79AE000101 from the U.S. Department of Health and Human Services); and the University of Michigan’s Poverty Solutions, College of Literature, Arts, and Science, Office of Research, and Department of Sociology. Any opinions, findings, and conclusions or recommendations expressed in this material are those of the author(s) and do not necessarily reflect the views or official policies of the NSF or HHS.