
Abstract
Concerns around disparities in suspensions and expulsions from schools in the United States have resulted in a concerted effort to reduce the use of exclusionary school discipline. In this article, the authors describe trends in the use of exclusionary discipline in Indiana and Oregon, two U.S. states with different school discipline policy climates. The findings point to a substantial decline in the use of suspensions and other forms of exclusionary discipline in both states. The authors further find that racial and socioeconomic disparities have recently narrowed in both states, though Black students and students who were identified as economically disadvantaged remain likely to be disproportionately exposed to exclusionary discipline. These trends, and their timing, illustrate the broad-based change in disciplinary norms that has occurred in the U.S. over the past decade.
Motivated by concerns about disciplinary disparities and their consequences for youth outcomes, educational leaders and policy makers across the United States have recently mounted a concerted effort to reduce the use of exclusionary school discipline. In 2011, the U.S. Department of Justice required schools to begin collecting new data on schools’ exclusionary discipline rates, and the U.S. Department of Education launched an effort to aggressively investigate civil rights complaints related to school discipline. In 2014, the Department of Education and Department of Justice issued a “dear colleague” letter urging schools to eliminate discriminatory school disciplinary practices and promote more equitable school climates (U.S. Department of Education and U.S. Department of Justice 2014). Although later rescinded by the Trump administration, the 2014 “dear colleague” letter reflected a broad shift in the way schools approach school discipline (Ritter 2018; Steinberg and Lacoe 2017). Educators and policy makers across the United States have responded to these calls by revising school discipline policies, limiting or prohibiting the use of suspensions for younger students and minor misbehavior (Anderson, Egalite, and Mills 2019; McKechnie and Nishioka 2015).
In this study, we use longitudinal administrative data describing elementary and middle school students in Indiana and Oregon to document changes in the use of exclusionary discipline and the magnitude of racial, ethnic, and socioeconomic disciplinary disparities during this reform-oriented period. Although studies drawing on administrative records are typically restricted to a single state, by leveraging two partnerships, we provide information on the trends across two different contexts. As we discuss in more detail below, Indiana’s record on school discipline is relatively punitive, with large disparities between Black and White students’ exposure to exclusionary discipline, whereas Oregon has been the site of considerable policy experimentation with disciplinary reform and has disparities that are below the national average (Losen et al. 2015; Nishioka, Merrill, and Hanson 2021).
In light of the important differences between the two states, it is striking that we find largely parallel trends in exclusionary discipline in Indiana and Oregon. In both states, we find that the percentage of students who were disciplined in a given year declined during the study period for all students, including Black and Latinx students and students who were identified as economically disadvantaged. Although disparities persist, we find pronounced declines of approximately 6 percentage points in Black/White disciplinary disparities in both states and smaller but still statistically significant declines in disciplinary disparities between students who were and were not identified as economically disadvantaged. In contrast, conditional disparities between Latinx and White students are near zero in both states. Declines in disciplinary rates and disparities in both Indiana and Oregon predate the Obama administration guidance and state policy shifts, suggesting that the move away from exclusionary discipline was not driven mainly by state or federal policy that happened in later years. The parallel trends in school discipline rates and disciplinary disparities that we document across these two states point to a broad-based change in the way U.S. educators approach school discipline.
School Discipline over Time
Historical research has traced a broad shift over the twentieth century in how educators interpret their responsibility to manage student behavior in loco parentis (Arum 2005). The evolution of school disciplinary approaches traced broader cultural sentiments and policies around the use of punitive criminal justice (Hirschfield 2008; Kupchik 2010; Weissman, 2015). In the span of several decades, punitive school discipline went from being legally justified as having educational value and necessary to provide order to being seen as overused and tremendously costly (Kim 2011; U.S. Department of Education, Office for Civil Rights 2014). Key to this remarkable transformation was the growing awareness of racial disparities in the use of punitive school discipline and their long-term consequences (Mittleman 2018; Owens and McLanahan 2020).
Although organizations such as the Children’s Defense Fund began to raise concerns about racial disparities in school discipline in the 1970s (Children’s Defense Fund 1975), a broader (and often highly racialized) moral panic over drugs and gang violence led many schools to adopt increasingly draconian disciplinary practices (Hirschfield 2008). During this period, school districts increasingly criminalized student misbehavior; implementing zero-tolerance policies, suspending students for relatively minor infractions, and incorporating criminal justice personnel and tactics in schools (Hirschfield 2008; Kupchik 2010; Weissman 2015). These policies specifically targeted students of color (Hoffman 2014). Unsurprisingly, therefore, suspension rates increased modestly for White middle school students between 1973 and 2006, more than doubled for Latinx students, and almost tripled for Black students during this period (Losen and Skiba 2010).
However, as we note above, the conversation around school discipline has shifted recently as educators, researchers, professional organizations, and policy makers have called on schools to decriminalize student behavior. In addition to the Department of Education’s stepped-up civil rights enforcement efforts and 2014 “dear colleague” letter about exclusionary discipline, policy makers, school leaders, and educators across the United States have recently taken a series of steps attempting to reduce suspensions and narrow disciplinary disparities.
By May 2015, 22 states and the District of Columbia had revised laws to deemphasize the use of exclusionary discipline (Steinberg and Lacoe 2017). As a part of this movement, schools across the United States began to implement restorative justice, Positive Behavioral Interventions and Support and other social-emotional learning strategies and disciplinary systems that move away from suspension and expulsion (Steinberg and Lacoe 2017). Educator training in conflict mediation and trauma-informed practices have also become increasingly common in U.S. schools (Gregory and Fergus 2017). These new approaches to school discipline reflect an effort to consider broader structural factors that influence student behavior and to develop appropriate responses to that behavior (González 2012). Although these interventions rarely explicitly target reductions in racial disparities, preventive and restorative approaches have the potential to reduce both the frequency of exclusionary discipline and the magnitude of disciplinary disparities (Carter et al. 2017; Cruz, Firestone, and Rodl 2021; Davison, Penner, and Penner forthcoming; González 2012; Gregory et al. 2018; Hashim et al. 2018). 1
Steinberg and Lacoe (2017) cited evidence from the Department of Education’s Office for Civil Rights indicating that the rate of suspensions and expulsions reported by U.S. public schools fell by 20 percent between 2012 and 2014 after more modest declines in the late 2000s and early 2010s. This finding suggests that recent shifts in the culture and policy around school discipline correspond to a rapid decline in the incidence of suspension and expulsion in U.S. schools. What is less clear, however, is whether global reductions in exclusionary discipline helped reduce or reinforce racial disproportionalities in their use.
Our analyses describe trends in school discipline in this recent period, shedding light on the extent to which policy actions and recommendations from professional organizations motivated changes at the grassroots level or simply reflected changes that were already under way. We draw on data from Indiana and Oregon, two states that represent different orientations toward school discipline. Although the two states cannot encapsulate the entirety of state responses to federal guidance and societal pressures around discipline, they provide valuable opportunities to document this recent transformation across different contexts.
Given the importance of disciplinary disparities in conversations regarding school discipline, we pay particular attention to changes in disparities. Much of the existing research on school discipline focuses on documenting Black students’ disproportionality in exposure to exclusionary discipline (Fenning and Rose 2007; Ferguson 2010; Rios 2011). Black students represent one sixth of the school-aged population, but they constitute one third of suspended or expelled students (U.S. Department of Education, Office for Civil Rights 2014). Disparities between Black and White students in the likelihood of receiving exclusionary discipline persist even after accounting for student characteristics, including family income and self-reported deviant behavior (Welch and Payne 2010). Administrative data from Arkansas (Anderson and Ritter 2017) and North Carolina (Kinsler 2011) demonstrate that school differences play an important role in explaining Black-White disparities in school discipline, but Black-White disparities exist even among students in the same school (Owens and McLanahan 2020).
Although qualitative work suggests that educators also disproportionately criminalize Latinx students (Rios 2011), the available quantitative evidence is mixed. Wallace et al. (2008) found higher rates of suspension and expulsion among Latinx students in a nationally representative sample than White students, while Anderson and Ritter (2017) showed that Latinx students in Arkansas were less likely to receive exclusionary discipline than White students.
Additional disciplinary disparities exist between students from low-income families and students from affluent families. Anderson and Ritter (2017) demonstrated, for example, that students who were identified as economically disadvantaged were at greater risk for out-of-school suspensions, expulsions, and referrals to alternative schools compared with their economically more advantaged peers within the same school.
Trends in Exclusionary Discipline by Disciplinary Type
Our analyses also explore contemporary shifts in the use of different types of exclusionary school discipline. In addition to out-of-school suspensions and expulsions, many schools utilize in-school suspensions. Although all three measures exclude disciplined students from their regular educational settings, in-school suspensions aim to reduce the adverse impacts of out-of-school suspensions by allowing students to stay in school. Although both in- and out-of-school suspensions are associated with negative student outcomes, these associations are greater for out-of-school suspensions than in-school suspensions (Anderson, Ritter, and Zamarro 2019).
Recent disciplinary reforms in some states have specifically encouraged schools to reduce out-of-school suspensions, which may lead educators to rely more on in-school suspensions. For example, in 2013, the Arkansas state legislature passed a bill banning the use of out-of-school suspensions for truancy (Anderson 2018), and California, Ohio, and Rhode Island have also prohibited or discouraged the use of out-of-school suspension for truancy (Anderson et al. 2019). In Oregon, schools are not allowed to use out-of-school suspensions and expulsions for students in the elementary grades unless offenses are extremely severe (e.g., serious physical harm to a school staff member or student) (McKechnie and Nishioka 2015; Nishioka et al. 2020, 2021). Stevens et al. (2015) suggested that educators in Chicago Public Schools have begun to substitute in-school suspensions for out-of-school suspensions.
However, much of the guidance that educators receive regarding school discipline advocates reducing both in- and out-of-school suspensions. For example, the influential 2014 “dear colleague” letter from the Department of Education and the Department of Justice advocated reducing all forms of exclusionary discipline, including in-school suspension (U.S. Department of Education and U.S. Department of Justice 2014). Because in-school suspensions also remove students from classrooms and deprive students of opportunities to learn, researchers have expressed concerns about the negative effects of in-school suspensions (Hwang 2018; Noltemeyer, Ward, and Mcloughlin 2015). Furthermore, because in-school suspensions require school resources (e.g., space and staff supervision) that out-of-school suspensions do not require, one might not expect increases in this form of discipline as a substitute for out-of-school suspensions. It is thus an open question whether recent trends in in-school suspensions parallel trends in out-of-school suspensions and expulsions or whether in-school suspensions might increase as students are diverted from out-of-school suspensions and expulsions.
Trends in Exclusionary Discipline by Infraction Type
The impacts of disciplinary reform on exclusionary school discipline may also vary across infraction types. Zero-tolerance policies were initially implemented to respond to violent and serious behavioral issues. However, during the 1990s and early 2000s, schools relied heavily on exclusionary discipline even for minor behavioral infractions (Girvan et al. 2017; Kupchik 2010; Skiba and Knesting 2001; Smolkowski et al. 2016; U.S. Department of Education 1997). This move may have increased opportunities for educator bias, which exacerbates disciplinary disparities. For example, Skiba et al. (2002) demonstrated that White students were disciplined more frequently for objective infractions, such as smoking and vandalism, whereas Black students were disciplined more often for subjective infractions, such as disrespect. Skiba et al.’s findings are in line with those of experimental studies that reveal that educators perceive Black students to be more problematic and aggressive than their White counterparts (Neal et al. 2003). Ritter and Anderson (2018) also showed that Black students were more than twice as likely to receive office referrals for subjective infraction types such as insubordination and disorderly conduct.
Recent reforms aim to foster more equitable disciplinary environments and, in theory at least, may particularly reduce the use of exclusionary discipline for subjective infractions, such as disruptive and defiant behavior. In 2013, Los Angeles Unified School District banned suspensions for willful defiance, which accounted for 48 percent of 710,000 suspensions issued in California in the 2011–2012 academic year (Watanabe 2013). Soon thereafter, in 2014, the California legislature abolished suspensions for minor misbehavior. Given concerns about the use of exclusionary school suspensions for nonviolent and nonserious misbehaviors (Anderson 2018; Anderson et al. 2019; Skiba and Knesting 2001), it is plausible that reductions in exclusionary school discipline will be greater for minor infractions, such as disruptive and defiant behavior.
Indiana and Oregon in Context
Our study complements the growing body of research evaluating specific policy efforts and interventions designed to reduce disciplinary disparities (see, e.g., Anyon et al. 2016; Hashim et al. 2018) by investigating disciplinary trends in two states that approached the national conversation about school discipline reform in different ways and with different degrees of urgency.
Indiana was relatively slow to enact explicit policies around exclusionary discipline. Indiana is 1 of 17 states that continues to allow corporal punishment in schools and the state government did not act to limit school suspensions until 2018, after the last year for which we have data (Colias-Pete 2018). By contrast, several Oregon districts pioneered restorative justice approaches in the mid-2000s (Allard 2015), and the state legislature passed bills in 2013 and 2015 designed to limit the use of exclusionary discipline in schools. Oregon emerged as an early leader in the effort to reform school discipline practices, including the implementation of restorative justice models in schools.
Losen et al. (2015) showed that not only does Indiana suspend more students overall than Oregon (Indiana has the 9th highest elementary school suspension rate among U.S. states and the 15th highest secondary suspension rate, whereas Oregon ranks 22nd and 33rd, respectively), but that how this plays out across race differs substantially: Black/White suspension rate disparities in Indiana are some of the highest in the country, ranking 3rd for elementary students and 6th for secondary students, whereas Oregon has Black/White disparities that are below the national median at 32nd and 35th, respectively. Using data from the Civil Rights Data Center, we show that the differences between the Black/White disparities in Indiana and Oregon hold across in-school suspensions, out-of-school suspensions, law enforcement referrals, and school-related arrests (see Appendix Table 1). In addition, Indiana and Oregon represent contexts with different racial and ethnic student compositions, as Indiana is 11 percent Black and 9 percent Latinx, and Oregon is 3 percent Black and 21 percent Latinx. Comparing trends in exclusionary discipline incidence and disparities across these two states thus sheds light on how broader shifts in macro-level pressures and norms can shape inequalities in different local contexts.
Research Questions
In this article, we describe recent changes in exclusionary discipline and disparities in exposure to exclusionary discipline using administrative data from two U.S. states: Indiana and Oregon. Our data cover 2008–2009 to 2015–2016 in Indiana and 2007–2008 to 2014–2015 in Oregon, a period of rapid change in the national conversation around school discipline. We address the following research questions:
How have exclusionary discipline rates changed recently in Indiana (2008–2009 to 2015–16) and Oregon (2007–2008 to 2014–2015)?
How have racial, ethnic, and socioeconomic disparities in exposure to exclusionary discipline changed over this period? Specifically, after controlling for other student characteristics, grade, and school year, we examine differences between Black students and White students, Latinx students and White students, and students who were and were not identified as economically disadvantaged.
To what extent have changes in racial, ethnic, and socioeconomic disciplinary disparities been driven by changes in schools’ use of in-school suspension versus changes in schools’ use of out-of-school suspension and expulsion?
To what extent have changes in racial, ethnic, and socioeconomic disciplinary disparities been driven by changes in rates of suspensions for offenses related to drugs, alcohol, tobacco, weapons, or fighting versus changes in rates of suspension for disruptive or defiant behavior?
In addressing these four research questions, we compare both disparities across the schools overall, as well as within-school differences (i.e., when we only compare students to their peers in the same school).
Data and Method
We use administrative data from the Indiana Department of Education from 2008–2009 to 2015–2016 and the Oregon Department of Education from 2007–2008 to 2014–2015. These data include all students enrolled in the third through eighth grades in Indiana and Oregon and provide information on student demographic characteristics, program participation (e.g., enrollment in special education), educational achievement, and school enrollment, as well as detailed student discipline records. 2 Discipline data include in-school suspensions, out-of-school suspensions, and expulsions, as well as detailed infraction type. 3 Our samples include observations from 1,197,123 students in Indiana and 615,702 students in Oregon. As we have data from each student for each year in which they are enrolled in a public school, we use a total of 3,946,846 student-year observations in Indiana and 2,018,170 student-year observations in Oregon. In the “Results” section, we provide more information about our samples from two states in detail.
Analytic Approach
We address our first research question by describing trends in the rates of student exposure to any exclusionary discipline, including in-school suspension, out-of-school suspension, and expulsion for Black, Latinx, and White students, as well as students who were identified as economically disadvantaged. We then answer the remaining research questions using a series of linear probability models (LPMs) that explicitly model differences in racial/ethnic and socioeconomic disparities in disciplinary exposure. These models, which we estimate separately using data from Indiana and Oregon for each available year, take the following general form: Y
ig
= β0 + β1Race(or Ethnicity)
ig
+ β2EconDisig + β3Controls
ig
+ θ
g
+ ε
ig
. (1)
We address research question 2 by estimating a model in which Yig represents the probability of receiving any disciplinary consequence (i.e., in-school suspensions, out-of-school suspensions or expulsions) for student i in grade g for each year. 4 We then address research question 3 by estimating two separate models in which Yig represents probability of receiving an in-school suspension and the probability of receiving an out-of-school suspension or expulsion, respectively. By contrasting the results of these two models, we assess the extent to which declines in in-school suspensions or more severe out-of-school suspensions account for changes in disparities. Finally, we address research question 4 by estimating two separate models in which Yig represents the probability of receiving any disciplinary consequences for an offense related to drugs, alcohol, tobacco, weapons, or fighting and the probability of receiving any disciplinary consequences for disruptive or defiant behavior, respectively. By contrasting the results of these two models, we assess the extent to which a move away from suspensions for low-level offenses categorized as disruptive or defiant behavior account for changes in disparities. We estimate these models separately for each year to describe the trends over time. In light of recent evidence indicating that disciplinary disparities are narrower within schools than between schools (Anderson and Ritter 2017; Kinsler 2011), we also estimate a version of model 1 that examines only differences within schools (i.e., a school fixed-effects model) and present results from models with and without school fixed effects (Petersen 2004). 5
The key parameters from these models represent the magnitude of racial/ethnic and socioeconomic disparities (net of other student characteristics) in each year for which we have data, allowing us to track recent changes in disciplinary disparities in Indiana and Oregon. Race/ethnicity is a series of dichotomous variables that indicate whether a student is recorded in administrative records as Black, Latinx, Asian, or other race/ethnicity (with White students as the reference group). In our analyses, we focus on how Black and Latinx students’ discipline rates differ from their White peers. EconDis represents whether a student is identified as being economically disadvantaged or not. To facilitate interpretation, we represent coefficients and their standard errors in a series of trend graphs. We report the coefficients for the focal race/ethnicity and economic disadvantage variables, as well as for control variables, including gender, and enrollment in special education, as well as grade fixed effects (θ g ) in several Online Appendix tables indicated below. 6
We also conduct supplemental analyses in which we estimate logistic regression models. We provide the results of these models in Online Appendix tables identified below. The relevant coefficients in our main (LPM) specification can be interpreted in terms of the percentage point difference in the rates at which different groups are suspended, conditional on covariates. By contrast, coefficients from logistic regression models are often reported as odds ratios. LPMs have several desirable properties for group comparisons over time (Breen, Karlson, and Holm 2018). In addition, we believe that percentage point differences are a more intuitive metric for understanding differences in how rates change over time, particularly insofar as ratio-based approaches can change substantially if small base rates experience small changes in absolute value that are nonetheless large in proportional terms (see Girvan, McIntosh, and Smolkowski 2019 and Curran 2020 for a broader discussion on the relative merits of different approaches to capturing race differences in school discipline). 7
Results
Table 1 provides descriptive statistics both for all students and for suspended and expelled students in grades 3 to 8 in Indiana and Oregon, providing average student characteristics across years. Columns 1 and 2 highlight that students in grades 3 to 8 in both states are disciplined at similar rates. Approximately 9 percent (n = 371,467) of students in the Indiana sample and 8 percent (n = 161,941) of students in the Oregon sample have experienced at least one suspension or expulsion in a given year. On average, 5 percent of students receive at least one in-school suspension in a given year in both states, and 6 percent in Indiana and 5 percent in Oregon received at least one out-of-school suspension or an expulsion. Columns 3 and 4 report the same information among the subset students who were ever disciplined.
Descriptive Statistics for Students in Grades 3 through 8 in Indiana and Oregon.

Note: Summary statistics are based on student-year data from between the 2008–2009 and 2015–2016 academic years in Indiana and between the 2007–2008 and 2014–2015 academic years in Oregon. Disciplined students include all students who received at least one ISS, OSS, or EXP. Because students can be disciplined more than once, the rates across all infraction types add up to more than 1. Online Appendix Table 1 shows more detailed information on infraction types. EXP = expulsion; ISS = in-school suspension; OSS = out-of-school suspension.
Both Indiana and Oregon enroll a substantial number of socioeconomically disadvantaged students. In grades 3 through 8, 47 percent of Indiana students and 53 percent of Oregon students are economically disadvantaged. By comparison, 51 percent of K–12 students nationwide enroll in free and reduced-price lunch. Although White students are the majority in both Indiana and Oregon, the demographic profiles of students in the two states vary. Schools in Indiana enroll approximately the same proportion of Black students as schools nationwide: 12 percent in Indiana, compared with 15 percent nationwide. 8 By contrast, just 3 percent of the third through eighth graders we observe in Oregon are Black. Twenty percent of the students we observe in Oregon are Latinx, compared with 26 percent nationwide and 9 percent in Indiana. Asian students represent 5 percent of Oregon third through eighth grade enrollments, a figure that matches their representation among public school K–12 students nationwide, while 2 percent of Indiana students are Asian.
Suspension and expulsion rates differ across student demographic groups in both Indiana and Oregon. Male students, Black students, Latinx students, students who were identified as economically disadvantaged, students who are enrolled in special education, and low-achieving students tend to have disproportionately high rates of exposure to exclusionary discipline. Table 1 also lists the frequency with which students were disciplined for various infractions. Discipline records in Oregon include 31 infraction types and in Indiana include 17 infraction types 9 ; we recategorize these into three distinct infraction types to facilitate succinct cross-state comparisons: (1) drugs, alcohol, tobacco, weapons, and fighting, the offenses initially targeted by zero-tolerance policies (Skiba and Knesting 2001); (2) disruption and defiance (infractions that Skiba et al. 2002 suggested are more subjective); and (3) other infractions. Online Appendix Table 1 describes the infractions that contribute to each of the three categories in detail. All three infraction types are well represented in both states.
Trends in Exposure to Exclusionary Discipline
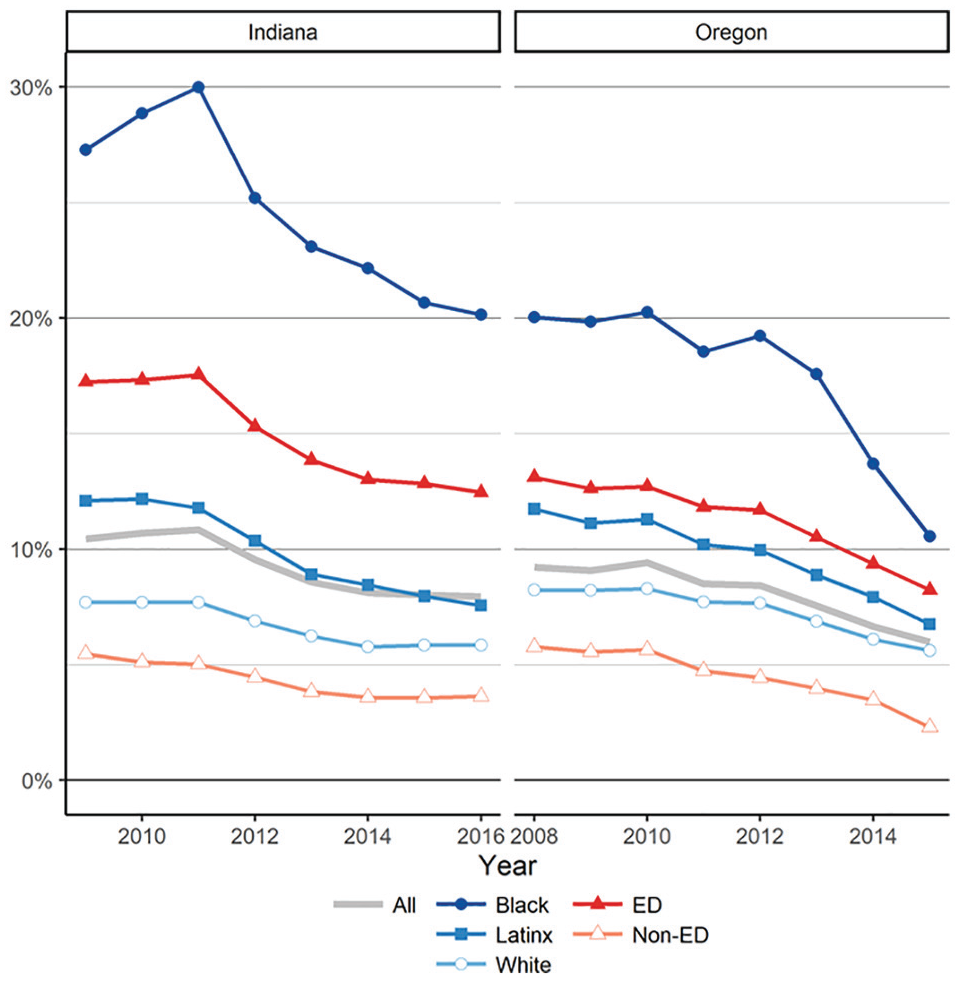
To address our first research question, we examine trends in the exposure to exclusionary school discipline for all without controlling for additional variables. Figure 1 presents trends in the rates at which Indiana and Oregon students in grades 3 through 8 experience any form of exclusionary discipline (in-school and out-of-school suspensions as well as expulsions) during the study period, both for all students and by subgroups. The average discipline rates for the population, reported as a thick gray line, are similar for both states and have declined steadily over time. Overall, in the 2008–2009 academic year, approximately 10.5 percent of all Indiana students in grades 3 through 8 experienced some type of exclusionary discipline, while 9.1 percent of students in Oregon experienced exclusionary discipline in 2007–2008. By the 2014–2015 academic year, 8.0 percent of students in Indiana and 6.0 percent of students in Oregon experienced exclusionary discipline. We can thus answer our first research question by noting that exposure to exclusionary discipline has decreased in two states.
Disciplined student rates across years in grades 3 through 8.
The subgroup lines in Figure 1 are roughly parallel, suggesting that all these subgroups exhibit declines in the use of exclusionary discipline that we observe in Indiana and Oregon over this time period. Both states substantially reduced their use of exclusionary discipline for Black, Latinx, and White students. In Indiana, exclusionary discipline decreased for Black students from 28 percent in 2008–2009 to 20 percent in 2015–2016. Oregon schools made similar reductions, with 20 percent of Black students experiencing exclusionary discipline in 2007–2008 and 11 percent in 2014–2015. The rate of exposure to exclusionary discipline for Latinx students also declined in both states over the study period. Approximately 12 percent of Latinx third through eighth graders in Indiana experienced exclusionary discipline in 2008–2009, falling to 8 percent in 2015–2016. Similarly, 12 percent of Latinx third through eighth graders in Oregon experienced exclusionary discipline in 2007–2008, falling to 7 percent in 2014–2015. For White students, exclusionary discipline rates fell from 8 percent to 6 percent in both states during this period.
We also observe declines in economically disadvantaged students’ exposure to exclusionary discipline. Approximately 17 percent of third through eighth graders students who were identified as economically disadvantaged in Indiana experienced exclusionary discipline in 2008–2009; by 2015–2016 that had fallen to 12 percent. In the same period, the exclusionary discipline rate for students who were not identified as economically disadvantaged in Indiana changed only slightly, moving from 5 percent to 4 percent. Although exclusionary discipline rates for Oregon students who are economically disadvantaged are lower than in Indiana, disparities by economic disadvantage in exclusionary discipline also declined in Oregon. Approximately 13 percent of Oregon students who are economically disadvantaged experienced exclusionary discipline in 2007–2008 and 8 percent in 2014–2015, compared with 6 percent (2007–2008) and 2 percent (2014–2015) of students who were not economically disadvantaged.
Conditional Disparities in Exposure to Exclusionary Discipline
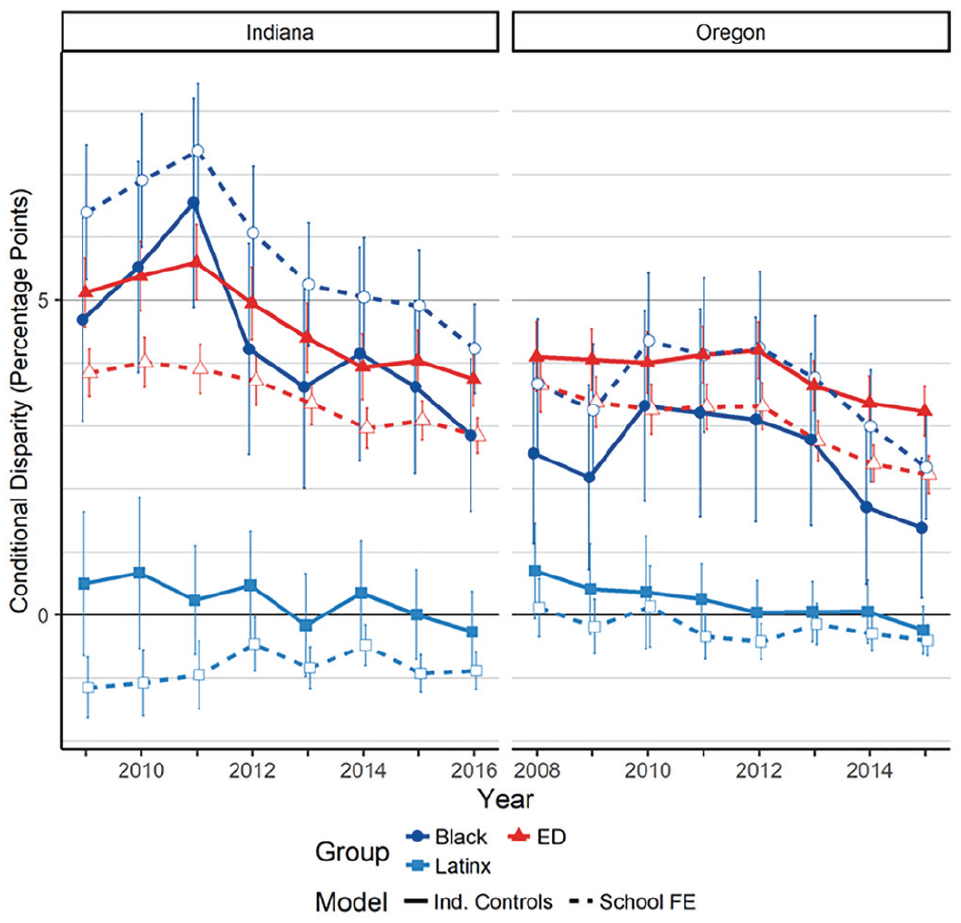
To address our second research question, we describe trends in the conditional disparities of exposure to exclusionary school discipline across subgroups, shown in Figures 2 through 6. We foreground the results from models without school fixed effects (represented as solid lines) that describe trends in discipline disparities comparing all students in each state. We also present and discuss differences that from school fixed-effects models that only compare students to others in their school, providing estimates of the average within school disparity in each state (represented as dashed lines). Figure 2 provides information regarding recent trends in racial, ethnic, and socioeconomic disparities in exposure to at least one disciplinary action (i.e., in-school suspensions, out-of-school suspensions, or expulsions) in Indiana and Oregon for students in grades 3 through 8. The points on this figure represent the disparities (i.e., coefficients reported in the Online Appendix tables), and the bars around those points represent 95 percent confidence intervals. 10 As these models control for race/ethnicity, gender, economically disadvantaged status, and special education identification, we interpret these coefficients as the independent racial, ethnic, and socioeconomic disciplinary disparities represented in percentage point terms after controlling for student characteristics in each state and each year. 11

Conditional disparities in the probability of exposure to at least one disciplinary action in grades 3 through 8.
Conditional disparities in the probability of exposure to at least one in-school suspension in grades 3 through 8.

Conditional disparities in the probability of exposure to at least one out-of-school suspension or expulsion in grades 3 through 8.

Conditional disparities in being disciplined for drugs, alcohol, tobacco, weapons, or fighting in grades 3 through 8.
Conditional disparities in being disciplined for disruptive and defiant behavior in grades 3 through 8.
The circles in Figure 2 represent estimates of Black/White disparities in exposure to any of the three forms of exclusionary discipline. Overall, they suggest that Black/White disparities in exposure to at least one disciplinary action narrowed considerably in both Indiana (p < .001) and Oregon (p < .001) over the study period. In Indiana, we observe a small uptick in Black/White disciplinary disparities between 2008–2009 and 2010–2011, so that by 2010–2011 Black students were 18.5 percentage points more likely to be exposed to exclusionary discipline than White students, net of controls. The Black/White disparities declined in Indiana throughout the rest of the time period, but they remained substantial. 12 By 2015–2016 Black students were 11.5 percentage points more likely to be exposed to exclusionary discipline than White students net of controls. Put differently, even after narrowing considerably during the study period, Black students were exposed to exclusionary discipline at nearly 3 times the rate of White students. 13 Models that include school fixed effects indicate that similar changes in disciplinary disparities occur within schools. The coefficients from these models are several percentage points smaller than for the statewide comparisons, but they still follow a nearly identical pattern of decline over time.
Although Oregon schools had far narrower Black/White disciplinary disparities than Indiana schools initially, they also achieved substantial reductions in Black/White disciplinary disparities during the study period. In 2007–2008, the first year in which data are available in Oregon, Black students were approximately 9.3 percentage points more likely than White students to be subject to in-school suspension, out-of-school suspension, or expulsion net of controls. These disparities declined over the study period, and by 2014–2015, Black students in Oregon schools were 3.2 percentage points more likely to be suspended or expelled than their White counterparts. Despite this notable reduction in Black/White disciplinary disparities, Oregon Black students’ rate of exclusionary discipline remained 1.5 times higher than their White peers at the end of the study period. A similar trend occurs among models that include school fixed effects. In Indiana, within-school differences are smaller in magnitude than the statewide differences and decline over time in parallel.
The analyses reported in Figure 2 indicate that Latinx/White disciplinary disparities remained relatively unchanged during the study period. In Indiana, although Latinx/White disparities change from positive to negative, they were very small and statistically insignificant in all years. In Oregon, the Latinx/White disciplinary disparity was statistically significant only in 2014–2015, when Latinx students were 0.9 percentage points less likely than White students to be subjected to exclusionary discipline (net of controls). This suggests that the differences between Latinx and White students observed in Figure 1 are driven by differences in the other variables that the model controls for (e.g., economically disadvantaged status). Our school fixed-effects models indicate a small advantage for Latinx students relative to White students in the same schools in Indiana (and for Oregon in some years), although these estimates are often not statistically distinguishable from those in the statewide model in Oregon.
Figure 2 illustrates similarly subtle trends in economic disadvantage disciplinary disparities in Indiana and Oregon schools. The exclusionary discipline rate in 2008–2009 for students who were identified as economically disadvantaged in Indiana was 9.1 percentage points higher than the rate for Indiana students who were not identified as economically disadvantaged (net of controls for race/ethnicity, gender, special education, grade, and school year). That gap declined modestly, but significantly, to 6.9 percentage points in 2015–2016 (p < .001). A similarly modest but significant decline (i.e., from 7.0 to 5.4 percentage points) occurred in disparities between students who were and were not identified as economically disadvantaged Oregon schools during the study period (p < .001). Models including school fixed effects largely mirror those without school fixed effects, but with somewhat smaller coefficients across the panel in both states.
The answer to our second research question can thus be summarized as follows: in our study period, we find that Black/White, Latinx/White, and economically disadvantaged/non–economically disadvantaged disparities in the likelihood of experiencing exclusionary discipline all experienced significant reductions. Indeed, although significant Black/White and economically disadvantaged/non–economically disadvantaged remain at the end of the period in both Indiana and Oregon. The conditional differences at the end of the period indicate that Latinx students are no longer disadvantaged relative to White students, and results from school fixed-effect models indicate that, net of controls, Latinx students are less likely to experience exclusionary discipline than White students in the same schools. 14
Variation in Conditional Disparities Trends by Disciplinary Type
To address our third research question, we examine trends in conditional disparities for in-school suspensions separately from trends in out-of-school suspensions and expulsions. Doing so provides insight into the extent to which the declines we observe in racial, ethnic, and socioeconomic disparities in school discipline occur broadly across disciplinary actions, or whether in-school suspensions become a substitute for out-of-school suspensions and expulsions (cf. Stevens et al. 2015). The results of these analyses are reported in Figures 3 and 4. 15
Overall, the results reported in Figure 3 indicate that Black/White disparities in exposure to in-school suspension have declined in both Indiana and Oregon, but the decline is statistically significant only in Indiana (p < .001) during the study period. The conditional Black/White disparity in in-school suspensions peaked in Indiana in 2010–11 at 7.4 percent before declining to 4.2 percent in 2015–16. Although small in percentage point terms, the decline in Black/White in-school suspension disparities that Indiana achieved during the study period is statistically significant and reasonably large in relative terms (i.e., the decline from 7.4 percent to 4.2 percent represents a 43 percent reduction). In Indiana and Oregon, the conditional Latinx/White disparities in in-school suspensions are not statistically significant during most of the study period.
In both states, the models that include school fixed effects indicate larger disparities within school between Black and White students than in the overall estimates. This is the only comparison, both in terms of groups compared and outcome, in which the within-school estimates are larger than the overall estimates. In contrast to the other disparities we observe, these results suggest that, to the degree that Black and White students attend different schools, schools with more Black students are less likely to rely on in-school suspensions as a disciplinary strategy than schools with fewer Black students. As a result, within school disparities in in-school suspension rates are larger than the overall in-school suspension rate from the models without school fixed effects (which averages between and within school suspensions). 16
Similar to Black/White disparities, we observe declines in disparities in exposure to in-school suspension between students who were and were not identified as economically disadvantaged during the study period. In Indiana, the conditional disparity in in-school suspension between students who were and were not identified as economically disadvantaged was 3.8 percentage points in 2008–2009 but decreased to 2.8 percentage points in 2015–2016 (p < .001). Similarly, the conditional disparity in in-school suspensions between students who were and were not identified as economically disadvantaged in Oregon was 4.1 percentage points in 2007–2008 and fell to 3.2 percentage points by 2014–2015 (p < .001).
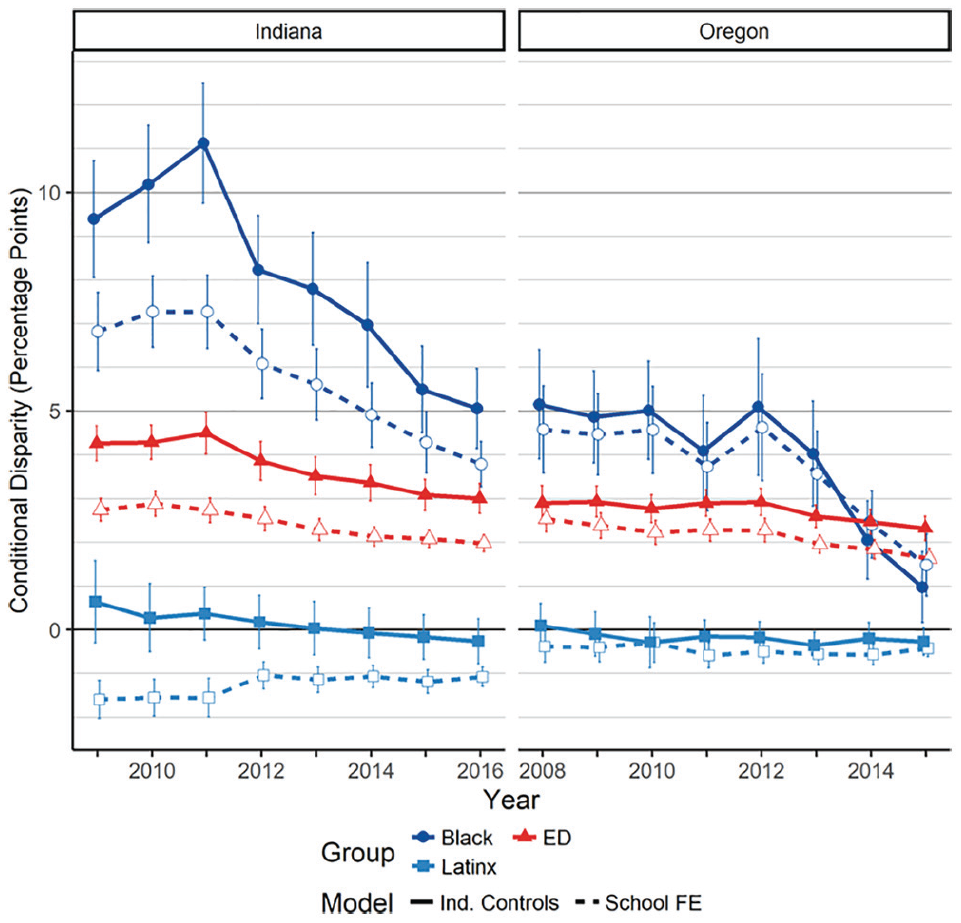
The trends in conditional exposure to out-of-school suspension and expulsion are reported in Figure 4. 17 Results suggest that the decline in Black/White disparities in out-of-school suspension and expulsion is larger than that in in-school suspension. In Indiana, the Black/White disparity in these more severe exclusionary punishments declined from 15.1 percentage points in 2009–2010 to 10.9 percentage points in 2015–2016 (p < .001). In Oregon, these disparities declined from 8.6 percentage points in 2008–2009 to 2.8 percentage points in 2014–2015 (p < .001). The Black/White disparities are generally smaller in the school fixed-effects models, but the decreasing trends are consistent with the versions that exclude these fixed effects.
By contrast, the trends in out-of-school suspension and expulsion disparities between Latinx and White students represented in Figure 4 roughly match the in-school suspension trends represented in Figure 3. Latinx students in Indiana are slightly overrepresented relative to White students among disciplinary cases at the beginning of the study period and achieve parity by the end of the study period, while in Oregon they begin at parity and are slightly underrepresented relative to White students by the end of the study period. The Latinx/White disparities are generally similar in the school fixed-effects models in Oregon, but in Indiana models with fixed effects suggest a small within-school Latinx advantage that is stable over time.
Examining the disparity between students who were and were not identified as economically disadvantaged, we find statistically significant declines in conditional out-of-school suspensions and expulsions in both Indiana (p < .001) and Oregon (p < .001) schools that mirror our findings on in-school suspensions in Figure 3. Trends in the disparities between students who were and were not identified as economically disadvantaged from models including school fixed effects were largely consistent with the models that did not include school fixed effects, although the coefficients in the school fixed-effects models are smaller than those in the overall models.
The answer to our third research question thus depends on the comparison of interest. We find that Latinx/White disparities and economically disadvantaged/non–economically disadvantaged disparities experience similar declines in in-school suspensions as well as out-of-school suspensions and expulsions. By contrast, Black/White disparities experience a more pronounced decline in out-of-school suspensions and expulsions than they do in in-school suspensions. Importantly, however, we find no evidence that in-school suspension disparities are increasing in response to decreases in out-of-school suspensions, as might be expected if in-school suspensions functioned as a substitute for out-of-school suspensions for Black students, Latinx students, and students who were not identified as economically disadvantaged.
Variation in Conditional Disparities Trends by Infraction Type
We address our fourth research question by examining conditional disparity trends separately by type of infraction. In the analyses reported in Figures 5 and 6, we describe the trends for two specific groupings of infraction types: (1) the relatively major offenses initially targeted by zero-tolerance policies and (2) infractions for which teachers’ subjective interpretations of student behavior as defiant or disruptive makes especially important contributions to the disciplinary responses (Skiba et al. 2002). Figure 5 examines infractions originally targeted by zero-tolerance policies (e.g., drugs, alcohol, weapons, tobacco, and fighting), and Figure 6 reports discipline rates for disruptive and defiant behavior. 18 In addition to differences in the degree to which the offenses were a central focus under zero-tolerance policies, teacher discretion plays a particularly salient role in decisions about whether student behavior should be considered disruptive or defiant (Skiba et al. 2002). Given these differences, we might expect differing patterns across the offenses depicted in Figures 5 and 6.
Figure 5 demonstrates that in Indiana, conditional racial/ethnic and economic disparities in exposure to exclusionary discipline for serious and violent infractions declined across the study period. For example, in 2008–2009 Black third through eighth graders in Indiana were 8.6 percentage points more likely than White students to be disciplined for infractions related to drugs, alcohol, tobacco, weapons, or violence. By the 2015–2016 school year, this conditional gap was 6.5 percentage points. We observe smaller changes for the Latinx/White and economic disparities in discipline for drugs, alcohol, tobacco, weapons, or fighting in Indiana during the study period, although by 2015–2016 Latinx students were significantly less likely to be suspended than White students for these infractions. Likewise, we observe little change in the economic disparity in exposure to discipline for infractions related to drugs, alcohol, tobacco, weapons, or fighting in Indiana. In 2008–2009, the conditional disparity between students who were and were not identified as economically disadvantaged in exposure to discipline for drugs, alcohol, tobacco, weapons, or fighting was 4.4 percentage points, but it declined to 3.2 percentage points by 2015–2016.
In Oregon, we also observe a steady decline in Black/White disparities in exposure to discipline for infractions related to drugs, alcohol, tobacco, weapons, or fighting, as the conditional Black/White disparities fell from 7.4 percentage points to 3.1 percentage points in Oregon during this time (p < .001). We see somewhat smaller changes in the conditional disparities between students who were and were not identified as economically disadvantaged, which fell from 4.8 percentage points to 3.6 percentage points (p < .001), and the Latinx/White disparity (p < .001). Between 2007–2008 and 2013–2014, we observe no significant disparities between Latinx and White students in exposure to discipline for serious and violent infraction types. In 2014–2015, we find evidence that Latinx students were 0.7 percentage points less likely to experience exclusionary discipline for serious and violent infraction types than White students, net of controls.
As in most of the previous models, within-school comparisons of Black/White and economically disadvantaged/non–economically disadvantaged disparities generally yield smaller differences than statewide comparisons in both Indiana and Oregon and declining trends that mirror the overall declines observed across all schools. The within-school Latinx/White disparity in Oregon is statistically indistinguishable from the statewide disparity, and in Indiana and Oregon, we find within-school differences between Latinx and White students indicating that Latinx students experience exclusionary discipline at lower rates than the White students who attend the same schools.
In Figure 6, we see evidence of statistically significant and dramatic declines in Black/White disparities in discipline for disruptive and defiant behavior in both states. 19 In Indiana, the Black/White disparities in disciplinary actions for disruptive or defiant behavior fell from 9.4 percentage points in 2008–2009 to 5.1 percentage points in 2015–2016 (p < .001), while in Oregon the disparities declined from 5.2 percent in 2007–2008 to 1 percent in 2014–2015 (p < .001). In Indiana, the Black/White disparity in suspension rates for subjective offenses (Figure 6) decreased by nearly twice as much as for serious and violent offenses (Figure 5), while in Oregon the Black/White disparities in more subjective offenses approached zero. As in Figure 5, Figure 6 shows that disparities between students who were and were not identified as economically disadvantaged also declined (p < .001 in Indiana, p < .01 in Oregon), but less precipitously than the Black/White disparities. 20
That said, our results suggest that changes were not limited to more subjective offenses (Figure 6), but that disciplinary disparities also decreased in more serious offenses (Figure 5) as well. This is important as it underscores that reductions are present both in the infractions originally targeted by zero-tolerance policies and in the infractions that are particularly susceptible to educator discretion. We can thus summarize the answer to our fourth research question by noting that although there were particularly remarkable changes in the Black/White disparities in suspensions for subjective infractions, the overall changes that we observe over this period are not restricted to a specific type of infraction.
Discussion
This study documents recent trends in school discipline, focusing on racial, ethnic, and socioeconomic disparities. School discipline practices became an increasingly controversial topic beginning in the early 2000s as scholars, practitioners, and policy makers drew attention to sharp racial, ethnic, and socioeconomic inequalities in exposure to exclusionary discipline and connected school discipline to mass incarceration. Our analyses use eight years of administrative data for students in grades 3 through 8 in Indiana (2008–2009 to 2015–2016) and Oregon (2007–2008 to 2014–2015) to examine changes in disparities in school discipline. In addition, we assess the extent to which declines in exclusionary school discipline vary by discipline type (i.e., in-school suspension vs. out-of-school suspension or expulsion) and by infraction types (i.e., disciplined for drugs, alcohol, tobacco, weapons, and fighting vs. disciplined for disruptive and defiant behavior), controlling for other student characteristics.
In response to our first research question, we find that although Indiana started the period with a somewhat higher rate of exclusionary discipline than Oregon, the rates of exclusionary discipline declined by nearly half in both states over this period. These declines occurred for in-school suspensions as well as out-of-school suspensions and expulsions. In addition, we find that declines occurred for suspensions for relatively severe infractions as well as suspensions for relatively minor and subjective infractions. In sum, these findings suggest these two states followed national trends and undertook a broad-based effort to reform school disciplinary practices during the study period.
To answer our second research question, we disaggregate disciplinary trends in both states across racial/ethnic and socioeconomic groups. As the school disciplinary systems in Indiana and Oregon differ substantially in the use of exclusionary discipline and the size of racial disparities (Losen et al. 2015), and because these two states took different policy approaches to school discipline during the study period, it is striking that both states experienced largely parallel declines in the use of exclusionary discipline decline for all student groups across the study period. Although conditional Black/White disparities remained larger in Indiana than Oregon, these disparities declined roughly 6 percentage points in both states over the study period.
We also observe parallel trends in Latinx/White disciplinary disparities in both states. Although these declines are modest compared with the declines we observe in Black/White disciplinary disparities, it is worth noting that initial Latinx/White disparities were less pronounced than Black/White disparities and the introduction of control variables for whether students were identified as economically disadvantaged and special education renders disparities between Latinx and White students nonsignificant. Furthermore, when we only compare Latinx students with White students in the same schools, we find that Latinx students are less likely to be exposed to exclusionary discipline throughout the study period in Indiana, and in most of the later years in Oregon, but the differences are small (i.e., about 2 percentage points in Indiana and smaller in Oregon). Given that relatively few studies focus on Latinx/White disciplinary disparities, and those that do have mixed findings, we believe our findings point to the need for more focused research on the Latinx/White disciplinary disparities.
Although disparities between students who were and were not identified as economically disadvantaged were typically smaller than Black/White disparities, students who were identified as economically disadvantaged received suspensions and expulsions more frequently than their counterparts who were not identified as economically disadvantaged throughout our study period in Indiana and Oregon. These disparities continue even with controls. Prior studies that showed disproportionality in school discipline outcomes for students who were and were not identified as economically disadvantaged are in line with our results (Anderson and Ritter 2017; Kinsler 2011).
As our findings suggest that Black/White disciplinary disparities are both larger and more changeable over time than Latinx/White or economically disadvantaged/not economically disadvantaged disparities in both states, our discussion of findings related to our third and fourth research questions focuses primary attention on Black/White disciplinary disparity trends. In response to our third research question, we investigate changes in in-school and out-of-school suspension rates by race, ethnicity, and socioeconomic disadvantage across Indiana and Oregon. Our findings suggest that declines in Black/White disparities in out-of-school suspensions and expulsions largely drove the declines in Black/White disciplinary disparities in both states. This is in part because more severe out-of-school suspensions were more common than in-school suspensions in both states. Importantly, however, we do not find that schools were replacing out-of-school suspensions with in-school suspensions.
Finally, in response to our fourth research question, we find some evidence to suggest that Black/White disciplinary disparities in suspensions attributed to disruptive behavior changed in particularly important ways in these years. Suspensions associated with these sorts of infractions are of particular interest theoretically, as educators may exercise more discretion in their responses to these sorts of behavioral infractions than they do in response to infractions related to alcohol, drugs, weapons, or fighting. It is therefore notable that Black/White disparities in exposure to suspensions associated with disruptive behavior shrunk more than disparities in exposure to suspensions associated with alcohol, drugs, weapons, or fighting in Indiana, while in Oregon Black/White disparities in exposure to suspensions associated with disruptive behavior nearly erased.
The changes we observe over a relatively short period of time highlight the malleability of school disciplinary practices. Sociologists and other scholars often notice a tendency toward the reproduction of inequality, even in the face of policy initiatives aiming to narrow inequalities (Hanselman, Domina, and Hwang 2022). Similarly, educational scholars often remark on the durability core educational practices sometimes referred to as the “grammar of schooling,” despite persistent efforts at systemic educational change (Tyack and Tobin 1994). Our findings provide an important exception to these literatures, suggesting that educational practices can change in a manner that improves educational equity.
Our data do not allow us to isolate the specific factors driving these trends. However, evidence of declines in the use of exclusionary disciplinary and narrowing racial disciplinary disparities during a period in which rhetoric around school discipline shifted nationwide highlights the role that norms and shared understandings about race and discipline play in shaping how educators perceive and respond to student behavior. Importantly, the trends we observe in the use of exclusionary discipline and in disciplinary disparities predate the implementation of state policies aimed to limit suspension. For example, discipline rates and disparities were in decline prior to the laws in effect in Oregon beginning June 4, 2013 (H.B. 2192), and July 1, 2015 (S.B. 553), and in Indiana beginning July 1, 2018 (H.B. 1421). 21 We did not design our study to assess the effects of these particular policies, and Indiana’s H.B. 1421 was passed after the period of our study. Nonetheless, the timing of disciplinary declines in Indiana and Oregon suggests that broader changes in practices around school discipline are not simply a mechanical response to state policies.
This is not to say, however, that policy changes are irrelevant to the disciplinary changes we observe. Indeed, we suspect that district- and school-level changes in disciplinary practice contributed to changes in educator practice and helped build momentum for larger scale policy changes during the policy period. Furthermore, in much the same way that Albiston et al. (2012) argue that the Family and Medical Leave Act interacted with norms in the workplace to interrupt discriminatory practices against mothers and caretakers, we suspect that changes in policies related to school discipline helped reinforce evolving norms in this space. Our findings of particularly rapid declines in the Black/White disparities in suspensions attributed to disruptive behavior may point toward opportunities to better understand the ways that policy shifts and social norms interact to produce organizational change. Research indicates that teachers’ biases lead them to interrupt Black students’ relatively minor behavioral infractions highly troublesome (Okonofua, Walton, and Eberhardt 2016). It is possible that both broad-based changes in the national conversation around race and school discipline and more local changes in disciplinary policy led educators to examine these racial biases, driving reductions in disciplinary disparities in this crucial area.
It is important to emphasize that although we find that Black/White discipline gaps narrowed considerably in both Indiana and Oregon over the study period, important disparities remain. At the beginning of our study period, Black third through eighth graders in Indiana were nearly 4 times as likely as their White peers to be subject to exclusionary discipline. At nearly the same time, Black students in Oregon were approximately twice as likely as their White peers to experience exclusionary discipline. Our findings are consistent with existing studies that show the elevated risk for receiving suspension for Black students (Children’s Defense Fund 1975; Losen et al. 2015). At the end of our study period, the discipline rates for Black students are still higher than for White students even after controlling for school fixed effects and other student characteristics.
It is by no means guaranteed that the reductions in disciplinary disparities that we document will be permanent. In 2018 the Trump administration discontinued the 2014 Obama school discipline guidelines in the name of protecting students’ safety and educators’ autonomy. Furthermore, despite reductions in the use of exclusionary discipline, schools continue to rely upon school resource officers, student surveillance, and other punitive disciplinary approaches (Nance 2016; Theriot 2009). Given the ways school disciplinary practices have changed in recent decades, it is uncertain whether these disparities will continue to decline in the future. Scholars and practitioners should continue to monitor disciplinary disparities as the broader climate and policy landscape around school discipline continue to shift.
Supplemental Material
sj-docx-1-srd-10.1177_23780231221103044 – Supplemental material for Reining in Punitive Discipline: Recent Trends in Exclusionary School Discipline Disparities
Supplemental material, sj-docx-1-srd-10.1177_23780231221103044 for Reining in Punitive Discipline: Recent Trends in Exclusionary School Discipline Disparities by NaYoung Hwang, Emily K. Penner, Miles Davison, Tanya Sanabria, Paul Hanselman, Thurston Domina and Andrew M. Penner in Socius
Footnotes
Appendix
Black-White Differences in the Probability of Experiencing a Disciplinary Outcome by State.

| Overall | In-School Suspensions | Out-of-School Suspensions | Law Enforcement Referrals | School-Related Arrests | |||||
|---|---|---|---|---|---|---|---|---|---|
| Rank | Rank | Disparity | Rank | Disparity | Rank | Disparity | Rank | Disparity | |
| United States | — | — | .069 | — | .098 | — | .005 | — | .002 |
| Alabama | 21 | 21 | .060 | 14 | .117 | 37 | .002 | 21 | .002 |
| Alaska | 38 | 16 | .070 | 33 | .071 | 41 | .002 | 42 | .000 |
| Arizona | 31 | 20 | .061 | 29 | .083 | 29 | .003 | 29 | .001 |
| Arkansas | 11 | 1 | .123 | 15 | .117 | 36 | .003 | 28 | .001 |
| California | 36 | 44 | .024 | 32 | .071 | 10 | .008 | 30 | .001 |
| Colorado | 33 | 27 | .054 | 34 | .071 | 12 | .007 | 36 | .000 |
| Connecticut | 10 | 8 | .082 | 28 | .084 | 19 | .006 | 4 | .004 |
| Delaware | 5 | 13 | .074 | 11 | .119 | 6 | .012 | 10 | .003 |
| District of Columbia | 30 | 45 | .023 | 17 | .108 | 31 | .003 | 14 | .002 |
| Florida | 34 | 23 | .058 | 35 | .060 | 15 | .007 | 33 | .001 |
| Georgia | 20 | 15 | .071 | 21 | .096 | 32 | .003 | 16 | .002 |
| Hawaii | 51 | 51 | .005 | 51 | .014 | 50 | .000 | 45 | .000 |
| Idaho | 50 | 36 | .030 | 50 | .020 | 45 | .001 | 43 | .000 |
| Illinois | 14 | 11 | .077 | 27 | .090 | 16 | .006 | 9 | .003 |
| Indiana | 18 | 24 | .056 | 6 | .142 | 38 | .002 | 17 | .002 |
| Iowa | 1 | 28 | .052 | 26 | .092 | 4 | .014 | 1 | .011 |
| Kansas | 6 | 7 | .094 | 10 | .122 | 11 | .008 | 26 | .001 |
| Kentucky | 13 | 3 | .111 | 22 | .094 | 28 | .003 | 24 | .002 |
| Louisiana | 26 | 12 | .077 | 30 | .078 | 39 | .002 | 20 | .002 |
| Maine | 45 | 25 | .055 | 46 | .036 | 51 | -.001 | 46 | .000 |
| Maryland | 40 | 50 | .006 | 41 | .048 | 21 | .005 | 19 | .002 |
| Massachusetts | 43 | 42 | .028 | 37 | .056 | 47 | .001 | 37 | .000 |
| Michigan | 32 | 39 | .029 | 5 | .143 | 42 | .001 | 31 | .001 |
| Minnesota | 7 | 30 | .049 | 16 | .112 | 3 | .014 | 18 | .002 |
| Mississippi | 28 | 17 | .069 | 18 | .105 | 44 | .001 | 32 | .001 |
| Missouri | 3 | 2 | .117 | 9 | .123 | 13 | .007 | 5 | .003 |
| Montana | 39 | 35 | .032 | 45 | .037 | 7 | .011 | 49 | .000 |
| Nebraska | 29 | 31 | .041 | 8 | .125 | 25 | .004 | 41 | .000 |
| Nevada | 15 | 26 | .055 | 4 | .144 | 22 | .005 | 22 | .002 |
| New Hampshire | 23 | 32 | .039 | 31 | .076 | 14 | .007 | 6 | .003 |
| New Jersey | 27 | 22 | .060 | 23 | .094 | 33 | .003 | 23 | .002 |
| New Mexico | 47 | 33 | .038 | 40 | .051 | 49 | .000 | 48 | .000 |
| New York | 42 | 38 | .029 | 44 | .041 | 30 | .003 | 40 | .000 |
| North Carolina | 25 | 18 | .067 | 19 | .101 | 23 | .005 | 34 | .001 |
| North Dakota | 41 | 43 | .025 | 49 | .027 | 35 | .003 | 11 | .003 |
| Ohio | 19 | 14 | .072 | 2 | .155 | 43 | .001 | 35 | .001 |
| Oklahoma | 8 | 6 | .096 | 13 | .117 | 20 | .005 | 15 | .002 |
| Oregon | 49 | 46 | .021 | 42 | .043 | 48 | .000 | 44 | .000 |
| Pennsylvania | 2 | 41 | .028 | 7 | .138 | 1 | .025 | 2 | .005 |
| Rhode Island | 22 | 49 | .011 | 38 | .056 | 2 | .015 | 7 | .003 |
| South Carolina | 9 | 5 | .098 | 12 | .118 | 27 | .003 | 8 | .003 |
| South Dakota | 35 | 29 | .052 | 39 | .055 | 8 | .010 | 50 | -.001 |
| Tennessee | 17 | 10 | .078 | 3 | .150 | 46 | .001 | 27 | .001 |
| Texas | 12 | 4 | .098 | 24 | .094 | 26 | .004 | 13 | .002 |
| Utah | 46 | 48 | .016 | 47 | .034 | 24 | .004 | 38 | .000 |
| Vermont | 37 | 37 | .029 | 43 | .043 | 17 | .006 | 12 | .002 |
| Virginia | 16 | 19 | .063 | 20 | .097 | 5 | .013 | 39 | .000 |
| Washington | 44 | 40 | .028 | 36 | .057 | 34 | .003 | 51 | -.001 |
| West Virginia | 24 | 9 | .080 | 25 | .093 | 40 | .002 | 25 | .001 |
| Wisconsin | 4 | 34 | .036 | 1 | .158 | 9 | .009 | 3 | .005 |
| Wyoming | 48 | 47 | .018 | 48 | .028 | 18 | .006 | 47 | .000 |
Note: To calculate disparities, we first divide the number of Black students who were subject to a particular disciplinary action by the total number of Black students in the state and then subtract the corresponding rate for White students to yield the disparity in that outcome. To calculate the overall rank, we first subtract the U.S. disparity from the state disparity and divide by the standard deviation of the state disparities; we average these across our four outcomes and report the rank on the basis of this metric. For all of the ranks reported, we rank from the highest disparities to the lowest, so that a ranking of 1 corresponds to the state with the highest disparities. Data for these calculations come from the Civil Rights Data Center for 2015–2016.
Funding
The author(s) disclosed receipt of the following financial support for the research, authorship, and/or publication of this article: This project was supported by the Eunice Kennedy Shriver National Institute of Child Health and Human Development of the National Institutes of Health (R01HD094007) and a National Academy of Education/Spencer Foundation Predoctoral Fellowship.
Supplemental Material
Supplemental material for this article is available online.
Notes
Author Biographies
References
Supplementary Material
Please find the following supplemental material available below.
For Open Access articles published under a Creative Commons License, all supplemental material carries the same license as the article it is associated with.
For non-Open Access articles published, all supplemental material carries a non-exclusive license, and permission requests for re-use of supplemental material or any part of supplemental material shall be sent directly to the copyright owner as specified in the copyright notice associated with the article.