
Abstract
The authors examine how state policy contexts may have contributed to unfavorable adult health in recent decades, using merged individual-level data from the 1993–2016 Behavioral Risk Factor Surveillance System (n = 2,166,835) and 15 state-level policy domains measured annually on a conservative-to-liberal continuum. The authors examine associations between policy domains and health among adults 45 to 64 years old and assess how much of the associations are accounted for by adults’ socioeconomic, behavioral and lifestyle, and family factors. A more liberal version of the civil rights domain was associated with better health. It was disproportionately important for less educated adults and women, and its association with adult health was partly accounted for by educational attainment, employment, and income. Environment, gun safety, and marijuana policy domains were, to a lesser degree, predictors of health in some model specifications. In sum, health improvements require a greater focus on macro-level factors that shape the conditions in which people live.
Improvements in longevity and many dimensions of health in the United States have fallen behind other high-income countries (National Research Council and Institute of Medicine 2013; Ho and Hendi 2018). The United States now ranks near the bottom among high-income nations (Ho and Hendi 2018). The U.S. disadvantage extends to several health-related outcomes as well, such as obesity, diabetes, heart disease, and activities of daily living (Avendano and Kawachi 2014). In addition to falling short of advances in health and longevity made by other high-income countries, the United States has a history of large and pervasive inequalities in those outcomes across geographic areas and population subgroups. Despite public health efforts and high expenditures on medical care, the worrisome trends and inequalities have stubbornly persisted.
The reasons for the unfavorable profile of U.S. health and longevity are not fully understood. The reasons likely entail multiple factors operating at multiple levels, such as economic and policy environments (macro-level), workplace and family environments (meso-level), and individual behaviors and attitudes (micro-level) (NASEM 2021). Some researchers have emphasized the central role of macro-level explanations, especially political and policy contexts, noting that they are the “causes of the causes of the causes” of geographic inequalities in health and longevity (Bambra, Smith, and Pearce 2019:38). Indeed, the importance of policy and political contexts for U.S. life expectancy trends was recently shown in a study of the period from 1970 to 2014 (Montez et al. 2020). Examining an extensive set of policy domains, the study revealed that the policy contexts of U.S. states, which hyperpolarized during that period, appear to have suppressed gains in U.S. life expectancy (Montez et al. 2020). Furthermore, the study showed that certain policy domains, such as labor, civil rights, and the environment, may be powerful levers for improving longevity.
Building on this recent work, in the present study we investigate how adult health is associated with the same set of state policy domains. The ways policies shape health may differ from the ways they shape longevity. We extend prior work in two additional ways. We assess how the policy domains are associated with adult health for subgroups of the population defined by education level, sex, and race. This provides insights into whether the health of some groups is more vulnerable to policy contexts and whether some contexts are salubrious for some subgroups but deleterious for others. In addition, because we use individual-level data, we can examine whether the association between the policy domains and adult health can be accounted for by adults’ socioeconomic conditions, health-related behaviors and lifestyles, and family factors.
U.S. States and Population Health
Several indicators of U.S. population health have exhibited troubling signs in recent decades, especially among midlife adults, those without a bachelor’s degree, and those living in states in the South and Midwest (Case and Deaton 2021; Fenelon 2013; NASEM 2021; Sasson and Hayward 2019). The present study focuses on physical health. A previous analysis of functional limitations among adults 45 to 64 years of age during 2002 to 2016 found that the prevalence of limitations increased by 26 percent during the period, net of adults’ demographic characteristics such as sex and race (Zajacova and Montez 2018). That study examined many potential explanations, such as economic conditions and health behaviors and lifestyles, showing that they explained about half of the increase.
To explain trends and inequalities in population health, it is essential to examine the overarching power structures and processes that produce and sustain them (Gkiouleka et al. 2018). Indeed, an emerging literature is challenging researchers to consider the macro-level contexts in which people live as a precursor to common explanations of health inequalities such as health behaviors and lifestyle “choices” (Bambra et al. 2019; Beckfield and Bambra 2016; Montez et al. 2020). The economic, social, and policy contexts in which people are embedded offer opportunities and impose restrictions that shape behaviors, experiences, and life chances. Moreover, these contexts vary across the United States and influence lives in different ways on the basis of people’s social statuses, identities, resources, and risks. A macro-level contextual approach to understanding health inequalities is consistent with several perspectives, such as the theory of fundamental social causes (Link and Phelan 1995), institutional theories of health inequality (Beckfield et al. 2015), and contextual frameworks (Montez, Hayward, and Zajacova 2019). These perspectives draw attention to the ways in which institutional arrangements distribute health promoting resources and influence the importance of those resources for health.
As mentioned above, an important macro-level factor for population health is the policy environment. Numerous policies have both intended and unintended consequences on population health, as illustrated in the “Health in All Policies” approach (CDC 2016; WHO 2014). Indeed, population health is affected by much more than health care policy. Estimates indicate that just 10 percent to 15 percent of preventable mortality in the United States can be attributed to shortfalls in health care (McGinnis, Williams-Russo, and Knickman 2002). Social, economic, and other policies are also crucial. Policies that affect employment, wages, criminal justice, and housing, to name a few examples, influence the conditions in which people live and are increasingly viewed as health policies (Adler et al. 2016). For instance, Hahn, Truman, and Williams (2018) argue that civil rights laws are social determinants of health because they affect health by affecting intermediate factors such as housing, employment, and transportation which, in turn, affect the distribution of health risk and protective factors, such as pathogens and environmental toxins, and the resources for prevention and treatment. (p. 18)
Recent research points to the growing role of U.S. state policy contexts in shaping individuals’ risks and resources for health (Grumbach 2018; Montez et al. 2020). Those contexts shape nearly all facets of life, such as human capital development, economic circumstances, access to affordable health care, lifestyles, and social ties. Over the past 40 years or so, U.S. states have acquired considerable policy-making authority, in large part because of two main policy movements (Montez 2020; Montez et al. 2020). First, there has been a transfer of certain policy-making authorities from the federal to state governments, often referred to as devolution. State governments have been given greater responsibility for designing, funding, and implementing a host of policies, particularly those related to the economic safety net (Bruch, Meyers, and Gornick 2018). Second, state-level preemption of local policy-making authority has proliferated over the past decade (Huizar and Lathrop 2019; Pomeranz and Pertschuk 2017). Preemption occurs when state governments restrict or prohibit the authority of local governments. As an example of the rapid rise in these laws, between 2000 and 2019, the number of states that preempted localities from raising the minimum wage increased from 2 to 25, and the number of states that preempted localities from mandating paid leave grew from 0 to 20 (Huizar and Lathrop 2019).
A key consequence of the two policy movements described above are that states have crafted vastly different policy contexts which hyperpolarized across partisan lines (Grumbach 2018). Some states created an overarching policy context that invests in the well-being and health of their residents, but many others have not invested or even disinvested. For example, states such as New York invest in human capital development through public schooling expenditures, provide an economic floor for working adults (e.g., through a higher minimum wage and a supplemental earned income tax credit [EITC]), provide a relatively generous Medicaid program, and discourage deleterious behaviors, such as smoking, through tobacco excise taxes. In sharp contrast, states such as Mississippi invest less in schools, do not set a minimum wage (thus defaulting to the federal minimum wage), do not offer an EITC, provide an austere Medicaid program, do little to discourage risky behaviors, and even prohibit their localities from implementing such legislation.
U.S. States and Population Health by Education, Sex, and Race
Some of the largest and most persistent health inequalities are by race, sex, and education. Across several health outcomes, Black adults are at higher risk for poor health, earlier onset of disease, and more severe illness than white adults (Williams 2012). Although racial inequalities in health for some outcomes such as life expectancy have narrowed over the past few decades, stark inequalities persist in the burden of morbidity and mortality experienced by Black adults (National Center for Health Statistics 2016; Williams 2012). Health inequalities by sex and gender have also persisted over time. Women tend to live longer than men but have higher rates of disabling conditions (Crimmins and Zhang 2019). The unfavorable health profile of U.S. adults compared with other high-income countries is glaring among women (National Research Council 2011; National Research Council and Institute of Medicine 2013). Among the largest health inequalities are those by education level, which have continually widened over the past half century. The growing gap is documented across several health-related outcomes and reflects improvements in health among adults with a bachelor’s degree or higher alongside little improvement or even declines in health among less educated adults (Case and Deaton 2021).
State policy contexts may have a differential impact on adults’ health according to their level of education, sex, and race. In some ways, this is intentional, as is the case with means-tested policies. Temporary Assistance for Needy Families, for example, redistributes resources and provides an economic floor for low-income individuals and families. Consequently, state policy contexts may be more consequential for lower educated adults than their higher educated peers. State policy contexts may also have different consequences for men and women. Montez et al. (2017) suggested that “state policies and contexts may be more relevant for women given that they are more likely than men to be poor, raising children, caring for elders, and interacting with the health care system” (p. 116). Resources, protections, and power have also historically been withheld from Black adults. Although some civil rights policies have been linked to better health outcomes among Black adults, others have been ineffective in eliminating discrimination and its pernicious effects on health (Hahn et al. 2018). Even if policies aim to ensure equitable opportunities for Black and white adults, Black adults may see diminished returns because of structural factors such as institutional racism (Assari 2018). Efforts of U.S. states to correct the power imbalance burdening historically marginalized individuals varies across states and time.
Connections between U.S. Policies and Population Health
State policy contexts may influence health through myriad direct, indirect, and unanticipated ways. Here, we draw on extant studies isolating the effects of specific policies to highlight how the 15 policy domains we examine herein may affect population health. The policy domains come from Grumbach (2018) and include tobacco excise taxes, health and welfare, private sector labor, public sector labor, taxes, gun safety, environment, abortion, housing and transportation, LGBT rights, immigration, civil rights and liberties, marijuana, criminal justice, and education. Below, we highlight key studies supporting a link between each policy domain and population health.
Some policies have been extensively studied. One such policy, tobacco excise taxes, benefits health in part by deterring smoking (Sharbaugh et al. 2018). Health and welfare policies such as Medicaid expansion are linked to a host of salubrious outcomes (Allen and Sommers 2019). Policies in the labor domain, such as minimum wage and paid leave, benefit health via myriad pathways such as reduced financial strain, smoking, and obesity, as well as better medical care access, housing, nutrition, and exercise (Bullinger 2017; Gertner, Rotter, and Shafer 2019; Komro et al. 2016; Van Dyke et al. 2018; Lenhart 2017). In the taxes domain, policies such as EITC and income taxes can improve nutrition and economic conditions and reduce income inequality (MacKenzie et al. 2019; Muennig et al. 2016; Rehkopf et al. 2014). Gun safety policies could affect health through pathways such as nonfatal firearm injuries, which are estimated to be three times as frequent as fatal injuries, and have long-term consequences for disability, morbidity, and mental health (Fowler et al. 2015; Kalesan et al. 2017; Kaufman et al. 2021). Policies on environmental protections and exposures can affect multiple bodily systems including respiratory, cardiovascular, and endocrine function, and affect gene expression (Birnbaum and Jung 2011). Abortion policies have implications for women’s poverty risk, employment opportunities, anxiety, and intimate partner violence, all of which have adverse health consequences (ANSIRH n.d.). Last, as stable and safe housing is critical for health, policies that facilitate access to such housing may have a host of benefits (Taylor 2018).
The potential health effects of other policy domains have received less attention, but available evidence suggests an effect. For instance, LGBT-related policies can influence health through pathways such as stigma, unhealthy coping behaviors, and access to medical care (Raifman et al. 2017). State-level immigration policies may shape health through stress from structural racism, access to social institutions such as education, access to medical care and related services, and material conditions such as wages (Philbin et al. 2017). Policies on civil rights may benefit health by protecting people from the deleterious health effects of racism, sexism, ablism, and other forms of discrimination (McGowan et al. 2016). Emerging research on the health effects of states’ marijuana policies are inconclusive, finding both negative and null effects (Pacula and Smart 2017). Criminal justice policies may also influence population health by, for example, disrupting marriages and families, and through direct effects of health and health care on incarcerated persons (Binswanger et al. 2012). Policies that facilitate access to quality K–12 education may have significant population health benefits, given that education is one of the strongest social determinants of health.
Aims
In this study we examine how an extensive set of U.S. state policy domains, measured on a conservative-to-liberal continuum, are associated with physical health among midlife adults in recent decades. The study has two primary aims. The first is to assess how state policy domains individually and collectively predict physical health among all adults 45 to 64 years of age and among key sociodemographic groups, identified by level of educational attainment, sex, and race. The second aim is to estimate the extent to which the associations between the policy domains and adult health can be accounted for by adults’ socioeconomic, behavioral and lifestyle, and family factors. To address these aims, we merge annual data on 15 state-level policy domains with annual data on physical health from more than 2 million adults 45 to 64 years of age from 1993 through 2016.
Methods
Data and Sample
This study uses data on adults from the 1993–2016 Behavioral Risk Factor Surveillance System (BRFSS). The BRFSS is an annual cross-sectional survey coordinated by the Centers for Disease Control and Prevention (CDC) and administered by state health departments. In 1993, the BRFSS became a nationwide survey, collecting representative data from all 50 states throughout the year regarding chronic health conditions, health-related behaviors and lifestyles, and the use of health services among community-dwelling adults (CDC 2020a).
To collect health information in BRFSS, the CDC created and validated a survey instrument described as the Healthy Days measures (CDC 2000b; Moriarty, Zack, and Kobau 2003). These measures have been collected annually since 1993, with a few exceptions. Those include Rhode Island in 1993, Wyoming in 1994, Hawaii in 2004, and 28 states in 2002, when the Healthy Days measures were considered an optional module of the BRFSS. Our analytic sample excludes observations from the three missing state-years and all observations from 2002.
The last year of BRFSS data that we use is 2016, to correspond with the state policy measures. Described in detail below, the state policy measures span 1970 through 2014. Including BRFSS data for 2015 and 2016 allows us to lag the policy data by 2 years (i.e., policy data for year t are merged with health data for year t + 2). We focus on adults 45 to 64 years old at the time of survey. The reasons are threefold. It represents the ages when differences between states in the prevalence of physical functioning problems are particularly large (Montez et al. 2017). It represents ages when physical health problems often emerge, yet mortality selection has not materially biased the sample. It is also an age range when many of the state policy domains we examine, such as labor and welfare, are quite relevant in the life course. Our analytic sample ranges from 22,641 to 166,117 adults per year, totaling 2,166,835 adults during the study period.
Physical Health
We assess physical health using one of the Healthy Days questions, “Now thinking about your physical health, which includes physical illness and injuries, for how many days during the past 30 days was your physical health not good?” Like prior studies, we use this question because it is a global measure that reflects the burden of disease experienced by individuals, it captures health-related quality of life, and it is associated with chronic health outcomes (Slabaugh et al. 2017), health care utilization, and mortality (Dominick et al. 2002). We dichotomized this measure to indicate “frequent poor physical health” as 14 or more days in poor physical health versus fewer than 14 days in poor physical health. This generally accepted threshold is used in empirical research and by the CDC for tracking the health of states (e.g., Slabaugh et al. 2017).
State-Level Policy Contexts
We include annual information on 15 policy domains. These domains have been used in recent studies examining how state policies shape life expectancy (Montez et al. 2020). Most of the domains come from Grumbach (2018), who collected data on 135 different state policies from 1970 to 2014 using various sources (see also Caughey and Warshaw 2016). Grumbach categorized the policies into 16 domains: abortion, civil rights and liberties, criminal justice, marijuana, education, environment, gun safety, health and welfare, housing and transportation, immigration, private sector labor, public sector labor, LGBT rights, taxes, voting, and campaign finance. For each policy, Grumbach assigned every state-year observation a score from 0 to 1 on a conservative-to-liberal continuum. A policy is considered liberal if it expands state power of economic regulation and redistribution, protects the rights of marginalized groups, or restricts state power to punish deviant behavior (Grumbach 2018). Policies that do the opposite are considered conservative. Using the abortion domain as an example, a state-year score of 0 means that state in that year had the most conservative configuration of abortion policies across all state-year observations. A score of 1 means that state in that year had the most liberal configuration of abortion across all state-year observations. These scores represent the actual, not hypothetical, range of policy orientation. We include all domains in the analysis except for voting and campaign finance. These are excluded because there is little empirical evidence that convincingly links these domains to adult health. 1
We also include state excise taxes on tobacco, measured as cents per pack of cigarettes and converted to 2014 dollars using the Consumer Price Index–Retroactive Series (Orzechowski and Walker 2014). This measure was among the policies collected by Grumbach but not included in the 16 policy domains. Because tobacco is the leading cause of preventable death, we include this policy in our analysis. Like the other policy domains, excise taxes are normalized across all states and years to range from 0 to 1.
Core Covariates
We include core covariates. Some are measured at the respondent level. All models adjust for age in single years. Sex is a dichotomous variable (male, female). Race/ethnicity is a four-category variable including non-Hispanic white, non-Hispanic Black, non-Hispanic other, and Hispanic.
Other covariates are measured at the state level. These include fixed effects for states to capture characteristics that are stable during the study period but differ between states (e.g., geographic location, poor state vs. rich state). Consequently, our model uses within-state variation, not between state variation, to estimate the coefficients. Similarly, we include fixed effects for calendar year. The annual percentage of the state population that is foreign born is also included, given the health advantage of immigrants and the increase in immigration populations in certain states during the study period. As in prior work (Montez et al. 2020), we include a state-level policy innovation score to capture any residual policy-making activity that is not being captured by the other policy measures. The annual innovation score measures the number of policies adopted by a state divided by the total number of adoption opportunities across all states (Boehmke and Skinner 2012). It is normalized across states and years to range from 0 to 1.
Additional Covariates
In analyses for aim 2, we include additional covariates to assess how robust the model results are to accounting for respondents’ socioeconomic conditions, health-related behaviors and lifestyles, and family factors. If including these covariates has no bearing on the model results, this suggests that the covariates do not explain why the policy domains predict adult health. If including the covariates does modify the results, the interpretation is less straightforward. On the one hand, some covariates may represent indirect pathways through which certain domains influence health. For example, policy domains such as civil rights and tobacco tax may influence health through their effects on adults’ employment and smoking, respectively. On the other hand, some covariates may represent confounders of the associations between other domains and health. As our model includes all domains, the covariates may operate as pathways for some domains and as confounders for others. Despite this complexity, our analysis can provide useful insights and suggest research priorities.
We incorporate seven covariates that could conceivably be affected by several policy domains, have been associated with adult health in extant literature, and are available in all BRFSS years used in our study. This includes three socioeconomic factors. These are educational attainment, measured as a college degree or higher compared with some college or less; income, measured as $20,000 or greater compared with less than $20,000; and employment, measured as currently employed versus otherwise. The behavior- and lifestyle-related factors include smoking (current smoker = 1) and obesity, measured as a body mass index of 30 kg/m2 or greater. Also included are two family-related factors. These include an indicator for marital status (currently married = 1) and the number of children younger than 18 living in the household.
We anticipate that incorporating these covariates in the models will attenuate the associations between some policy domains and health. For instance, conceptually these covariates may help explain associations between the labor domain (e.g., via adults’ employment and income), education domain (e.g., via adults’ educational attainment), tobacco tax domain (e.g., via adults’ smoking), and civil rights domain (e.g., via adults’ employment and income) and adult health. Our expectation is that they will be less helpful for explaining associations between policy domains such as gun safety, environment, and marijuana on adult health. The potential linkages between these types of policy domains and adult health (e.g., marijuana consumption, air pollution, lead exposure) are either relatively direct or not measured in the BRFSS.
Analyses
To assess how state policy domains are associated with the probability of reporting frequent poor health (i.e., 14 or more days in the past 30 days spent in poor physical health) we estimate a series of logistic regression models. So that the timing of the policy measures precedes the health measures, all models lag the health measures by two years. For example, 1991 policy data are merged with the 1993 health data. The models include standard errors clustered by state. All models are estimated using Stata 16.
We first estimate the odds of frequent poor health from 15 separate models, in which each model includes one policy domain plus the core covariates, state and year fixed effects, and percentage foreign born (the baseline models). Next, we include all policy domains in one model (the adjusted model). We present both the baseline and adjusted models to illustrate that the model results change little when accounting for any collinearity among the policy measures. To address our first aim, we replicate the models by education level, sex, and race (Black, white).
To address our second aim, we reestimate the adjusted model for the full sample and include adults’ socioeconomic, behavioral and lifestyle, and family covariates. We assess whether the association between each state policy domain and adult health can be accounted for by these factors. We conduct this analysis using the method developed by Karlson, Holm, and Breen (2012) (KHB). This method was developed to assess mediation in nonlinear probability models by comparing the logit coefficient, X, between a model that includes X and the mediators, and one that includes X and a residualized version of the mediator or a group of mediators.
Supplementary Analyses
We conducted sensitivity analyses to assess the robustness of our results. First, we adjusted the models for the complex survey design of the BRFSS; we obtained similar results. Given similar results and that the khb command in Stata is not compatible with the svy command used to adjust for the survey design elements, our models do not adjust for the complex survey design. Second, we examined the extent to which item missing data could have affected our results. All variables have less than 5 percent missing except for income, which has 11 percent missing. We used several single imputation techniques (we were restricted to single imputation techniques, as the khb method’s disentangle option is not designed for multiply imputed data) to impute missing values for income including listwise deletion, mode imputation, regression imputation, hot deck, and random assignment. The model results were similar across methods, so we used listwise deletion in all models. Results from supplementary analyses are available upon request.
Results
Among the full sample of midlife adults, 14.3 percent reported frequent poor physical health. However, the percentage of the sample in frequent poor health varies considerably across U.S. states, as shown in Figure 1. In 2016, the last year of the study period, the percentage with frequent poor health ranged from 10.9 percent in North Dakota to 22.8 percent in West Virginia. The figure also shows that disparities in physical health across states slightly grew during the study period.
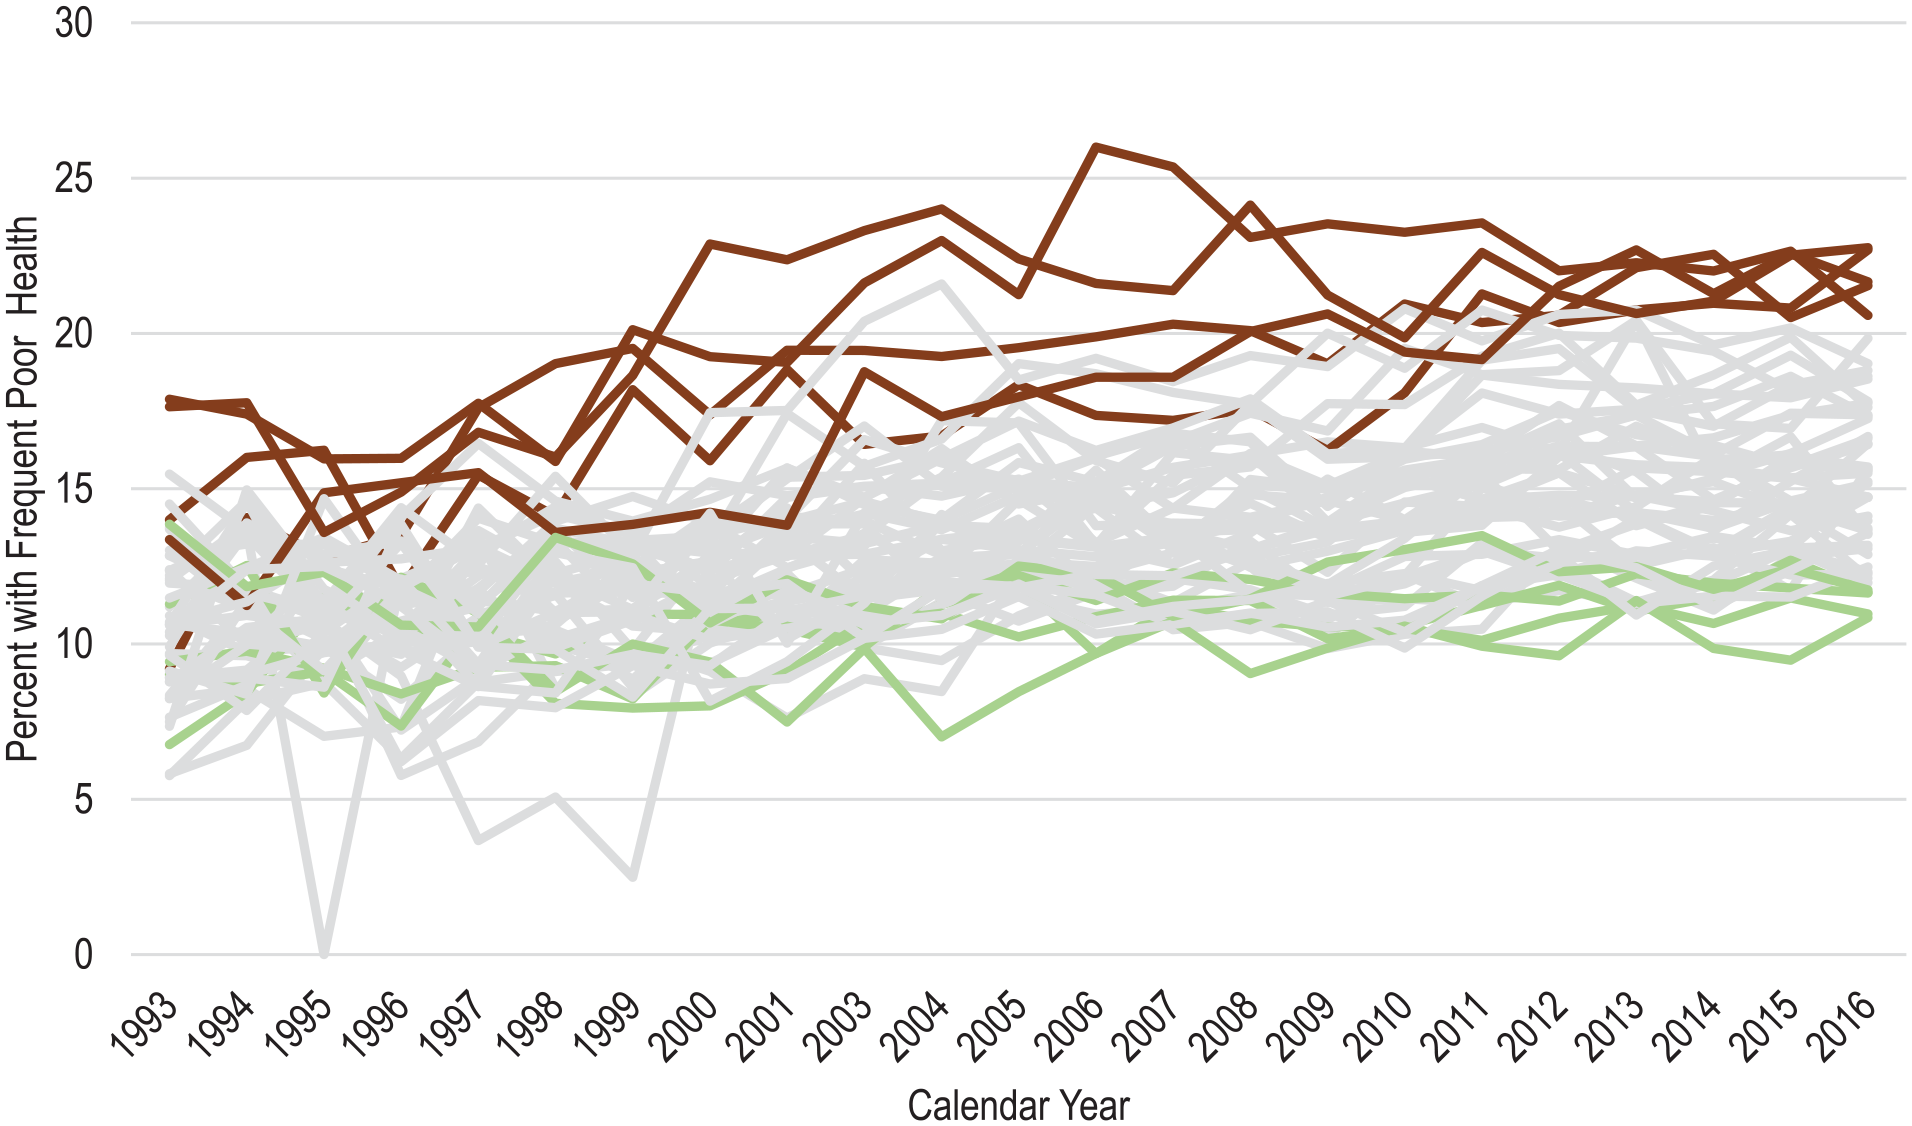
Percentage in frequent poor health among U.S. adults 45 to 64 years of age, by state, 1993 to 2016.
As expected, there are large disparities in health across education, sex, and race. Our descriptive results (not shown) reveal that in 2016, 20.2 percent of adults with a high school credential or less reported frequent poor health, compared with 11.0 percent of adults with at least some college. In 2016, 15.3 percent of women and 12.9 percent of men reported frequent poor health, as did 19.0 percent of Black adults and 13.3 percent of white adults.
Aim 1: State Policy Domains and Physical Health of Midlife Adults
We address our first aim with the models in Table 1, which are estimated from the full sample of midlife adults, as well as from subgroups defined by education, sex, and race. The “Models 0” column shows results from 15 baseline models using the full sample of midlife adults, in which each model includes just one policy domain and the core covariates (age, sex, race/ethnicity, year fixed effects, state fixed effects, and, in each year, the state policy innovation rate and percentage foreign born). The results are expressed in odds ratios (ORs). The ORs estimate the odds of frequent poor health within a state if it had the most liberal score for the policy domain (score = 1) divided by the odds of frequent poor health in the same state if it had the most conservative score for the policy domain (score = 0). Therefore, ORs < 1 indicate that a more liberal configuration of a policy is associated with lower odds of frequent poor health, while ORs > 1 indicate that a more conservative configuration is associated with lower odds. Table 1 (and all other tables) is sorted by the ORs in the “Models 0” column. The ORs in that column indicate that, among the three policy domains that are significantly associated with poor health (civil rights, gun safety, environment), a more liberal version of each domain is associated with a lower odds of frequent poor health.
Odds Ratios Predicting Frequent Poor Health from State Policy Domains, among All U.S. Adults 45 to 64 Years of Age, and by Education Level, Sex, and Race, 1993 to 2016.

Note: Models adjust for respondents’ age, sex, and race/ethnicity; state fixed effects; year fixed effects; and, in each year, the state policy innovation rate and percentage of the population who are foreign born.
Coefficients from 15 separate models including one policy at a time.
p < .10. *p < .05. **p < .01.
Because the political orientations of state policies are increasingly correlated, we estimate a single model 1 with all 15 policy domains and the core covariates. Like the previous models, the magnitude of the associations between the policy domains and health is largest for civil rights, gun safety, and environment. The statistical significance of some ORs attenuates from models 0 to model 1, but the direction of the associations generally remain. For example, in models 0, the odds of frequent poor health within a state are estimated to be 14.8 percent lower (100[1 – 0.852]) if the state had the most liberal environmental policies than if it had the most conservative policies. In model 1, that percentage attenuates to 11.1 percent after adjusting for the other policy domains.
In addition to the environment policy domain, the other domain significantly associated with better health in model 1 is civil rights. Again, a more liberal version is associated with better health. The odds of frequent poor health within a state are estimated to be 23.8 percent lower if the state had the most liberal civil rights policies than if it had the most conservative policies. Another way to capture the magnitude of this association is in terms of probabilities. The probability of frequent poor health is 16.0 percent in a state with the most conservative configuration of the civil rights domain and 12.6 percent with the most liberal configuration, when all other variables are held at their mean. This difference is meaningful. It is comparable with that between the probability of frequent poor health among persons 50 years of age (12.4 percent) compared with persons 60 years of age (15.6 percent), holding other variables held at their mean (these probabilities are estimated from our BRFSS sample).
To assess how the policy domains are associated with the health of population subgroups, we reestimate model 1 (the model with all 15 policy measures) by education level, sex, and race. Table 1 shows the results. The third column contains the results for adults with a high school credential or less. Again, the civil rights domain is particularly important. The odds of frequent poor health among less educated adults are estimated to be 27.6 percent lower if their state had the most liberal civil rights domain than if it had the most conservative, net of other domains (ORless educated = 0.72, ORmore educated = 0.81). The civil rights domain is also significantly associated with the health of women (ORwomen = 0.73, ORmen = 0.82) and white adults (ORwhite = 0.76, ORBlack = 0.96). The association between the environment domain and health is of similar magnitude across the subgroups, with ORs ranging between 0.86 to 0.92, except for Black adults, whose OR is 1.00. Nevertheless, supplementary analyses reveal no statistically significant education, sex, or race differences in the associations between the domains and health. Therefore, subgroup differences should be interpreted cautiously. Confidence intervals (CIs) for the coefficients in Table 1 are provided in Tables S1 and S2 in the online supplement.
To help extract additional insights from the subgroup analyses, in Figure 2 we plot the ORs and their 95 percent CIs from the models stratified by education, sex, and race. Several key insights emerge. First, there is no clear and consistent pattern in how the policy domains are associated with health for each group. For instance, the domains are not consistently most consequential for less educated adults and consistently least consequential for more educated adults. Second, the civil rights domain stands out as an important policy domain for the health of several subgroups, particularly for less educated adults, women, and white adults. Although these associations are statistically significant and of a meaningful magnitude, supplementary analyses that formally compare coefficients across models using the suest command in Stata reveal no statistically significant differences between subgroups (e.g., between men and women). Another interesting finding is that when a certain domain’s policy orientation (liberal or conservative) is associated with good health, that same orientation predicts good health for each subgroup.

Odds ratios for policy domains predicting frequent poor health among U.S. adults 45 to 64 years of age, by education, sex and race, 1993 to 2016.
Aim 2: Policy Domains and Adult Health, Net of Additional Individual-Level Covariates
For this aim, we estimate the extent to which the associations between the policy domains and adult health can be accounted for by adults’ socioeconomic, behavioral and lifestyle, and family factors. Using the full sample of midlife adults and all 15 policy domains, core covariates, and additional covariates (e.g., income, smoking), we implement the KHB method to partition the total association between the policy domains and the odds of frequent poor health into two components. One component represents the portion of the total association that is accounted for by the additional covariates, while the other component represents the portion that is not due to the additional covariates. 2 This latter component may include unmeasured covariates, including direct effects of the policy domains on health through, for example, air pollution, medical care, or marijuana consumption.
The results are provided in Table 2. The ORs for the total associations between the policy domains and adult health in Table 2 are comparable with those in model 1 in Table 1, except that they have been rescaled as part of the KHB method. As expected, results from this rescaled model are similar to those in model 1 of Table 1. More liberal versions of the civil rights domain (OR = 0.76, 95 percent CI = 0.63–0.90, p = .002) and environment domain (OR = 0.89, 95 percent CI = 0.80–0.99, p = .03) are associated with lower odds of poor health. In addition, the gun safety domain is significant in this rescaled model (OR = 0.86, 95 percent CI = 0.73–1.00, p = .05), although the magnitude of the OR is similar to that in model 1 in Table 1 (OR = 0.86).
Associations between Policy Domains and the Odds of Frequent Poor Health, before and after Adjusting for Additional Covariates, among U.S. Adults 45 to 64 Years of Age, 1993 to 2016 (n = 2,166,835).

Note: Models adjust for respondents’ age, sex, and race/ethnicity; state fixed effects; year fixed effects; and, in each year, the state policy innovation rate and percentage of the population who are foreign born. Additional covariates include educational attainment, employment status, household income, marital status, number of children in the household, smoking status, and obesity. OR = odds ratio.
p < .10. *p < .05. **p < .01.
The final two columns in Table 2 partition the total associations into the two components described above. The “Contribution of Measured Covariates” column represents the portion of the total association that is accounted for by the additional covariates, while the “Contribution of Unmeasured Covariates” column represents the portion that is not due to the additional covariates. We also used the KHB disentangle option in Stata (results not shown) to estimate the percentage of the total associations accounted for by each of the additional covariates and to identify which ones were most important. Results for four policy domains are noteworthy. Approximately 40 percent of the total association between the civil rights domain and adult health was accounted for by the additional covariates, with 78 percent of that due to the socioeconomic covariates. Nevertheless, after accounting for the covariates, the remaining association was still marginally significant (OR = 0.84, 95 percent CI = 0.71–1.01, p = 0.06). About 32 percent and 57 percent of the total associations between the environment and guns safety domains and adult health, respectively, were accounted for by the additional covariates. Unlike the civil rights domain, the remaining associations were not significant. Last, although the total association between the marijuana domain and health was not statistically significant, the total association masks a significant relationship between the domain and health (OR = 1.04, 95 percent CI = 1.00–1.09, p = .07) that operates through mechanisms not included in our study.
Discussion
In this study we take a structural view of the determinants of population health levels and inequalities. We are fundamentally concerned with policies and the political choices that undergird those policies, which Bambra et al. (2019:38) referred to as “the causes of the causes of the causes” of health inequality. We focus on U.S. state policy contexts. These contexts have hyperpolarized along partisan lines since the early 1980s, giving rise to diverse social and economic living conditions important to health (Grumbach 2018). During the same period, many dimensions of population health moved in an unfavorable direction, especially among midlife adults and those without a bachelor’s degree (Case and Deaton 2021; NASEM 2021). In this study we assessed how state policy domains are associated physical health among midlife adults, how those domains are associated with the health across education level, sex, and race, and the extent to which adults’ socioeconomic conditions, health-related behaviors and lifestyles, and family factors contribute to those associations.
We discuss four key findings. First, some state policy contexts predict health in midlife. Whereas extant studies tend to focus on one or a few specific policies, we examined an extensive set of 15 policy domains to gain a more comprehensive view of how policy contexts are associated with adult health. The strongest evidence of an association between the policy domains and health was for the civil rights domain. A more liberal version of that domain predicted significantly better adult health. The civil rights domain in particular may have especially varied ways through which it may shape health. As Hahn et al. (2018) argued, “Civil rights laws and their enforcement are social determinants of health because they affect other social determinants of health, that is, elements of a society’s organization and process” (p. 17). Indeed, the policies that make up the civil rights domain used herein could influence several domains of life. For instance, some of the policies in this domain include no-fault divorce, gender-equal-pay laws, and discrimination bans on public accommodations, which may influence family dynamics, job safety and equality, and public accommodations, respectively.
In addition to the civil rights domain, we found that the environmental, marijuana, and gun safety domains were associated with adult health, although these associations were smaller in magnitude and their statistical significance was contingent on other covariates in the models. More liberal versions of the environment and gun safety domains, and a more conservative version of the marijuana domain, predicted better adult health. The connections between environmental pollution and health (Landigran et al. 2018) corroborate our findings that state policies aimed at curbing pollution and providing clean air predict better health. The literature is inconclusive about the relationship between marijuana and health outcomes (Pacula and Smart 2017), but a recent study showed that more conservative state marijuana policies predicted longer lives (Montez et al. 2020). Gun policies could link to health through pathways such as nonfatal firearm injuries, or possibly through elevated blood lead levels among firearm users (Cook et al. 2015). Nonfatal firearm injuries are roughly three times as frequent as fatal injuries (Fowler et al. 2015; Kalesan et al. 2017; Kaufman et al. 2021). A study of the period from 2009 through 2017 showed that, on average, each year there were 85,894 nonfatal firearm injuries (i.e., 235 each day) and 34,538 fatal injuries (Kaufman et al. 2021). Nonfatal injuries can cause a host of issues, such as physical impairment, disability, morbidity, and poor mental health (see discussion in Fowler et al. 2015).
Second, we found few differences between social groups in how state policy domains are associated with adult health. The association between the civil rights domain and health was statistically significant and of a meaningful magnitude for less educated adults, women, and white adults but not significant for more educated adults, men, or Black adults. These group differences should not be overinterpreted, as no difference reached statistical significance. Nevertheless, the findings are consistent with the reality that this policy domain is, in fact, disproportionately relevant for less educated adults and women. Civil rights policies such as equal-pay laws are particularly salient to the lives of economically marginalized individuals. The null findings for the civil rights domain for Black adults might reflect a number of factors. For one, the health-related benefits of civil rights policies for Black adults may be muted by a host of pernicious circumstances experienced by these adults. Numerous studies have shown that Black adults do not receive the same health benefits as whites from some resources such as education or income, with one of the most fundamental explanations being that of racism (Williams, Priest, and Anderson, 2019).
The lack of an association between the civil rights domain and frequent poor health for Black adults may also reflect data-related factors. The sample size of Black adults was considerably smaller than that for white adults, although it was still large, with 163,607 adults. A likely explanation is that there may be too little temporal variation during our study period in the civil rights domain within the states where most Black adults reside for the models to detect an association between the domain and health. To illustrate this possibility, Supplementary Figure S1 shows relatively small changes in the average civil rights policy domain score across time among seven states with the highest percent of Black residents.
Our third set of noteworthy findings comes from our analyses that reestimated the models, accounting for adults’ socioeconomic conditions, health-related behaviors and lifestyles, and family factors. Our objective was to assess how robust the associations between the policy domains and adult health were to inclusion of these additional covariates. The civil rights policy domain remained significant even after accounting for the covariates. The covariates collectively accounted for 40 percent of the total association between the domain and adult health, with socioeconomic conditions (education, employment, and income) making the dominant contribution. These results are plausible: we would expect the covariates to best able to explain the links between policy domains and health for those domains whose influence on health is likely to (1) be indirect and (2) operate by shaping adults’ socioeconomic conditions, health-related behaviors and lifestyles, and/or family factors. We would also expect the civil rights domain to be more consequential for socioeconomic than behavioral and lifestyle or family factors, given the types of policies included within the domain such as equal pay and employment discrimination. In contrast to the civil rights domain, and as expected, the covariates did little to explain the association between the marijuana domain and health. It may instead reflect unmeasured factors such as marijuana consumption. We also found that approximately 57 percent and 32 percent of the associations between the gun safety and environment domains and adult health were accounted for by the covariates (primarily education, employment, and obesity) and that the associations were not significant after accounting for the covariates. Interpreting these findings is not straightforward. The interpretation depends on whether the covariates are conceptualized as confounders (i.e., a common cause of state policy and adult health) or mediators (i.e., a pathway linking state policy to adult health). We are agnostic on this issue, which is outside the scope of this study. We leave teasing out this issue to subsequent studies designed to identify causal effects.
Fourth, the ways that state policy contexts shape health differ somewhat from the ways they shape longevity. Comparing our findings with those of a recent study of how the policy domains predict life expectancy (Montez et al. 2020) reveals interesting similarities and differences. For these comparisons, we draw mainly from our findings using the full sample of adults in Table 1, model 1. We find that some policy domains are related to both life expectancy at birth and physical health in midlife, especially policies on the environment and civil rights. For those policies, more liberal versions are associated with better health and longer lives. Some state policy domains are related to life expectancy but not health. For instance, policies on tobacco and immigration (e.g., drivers’ licenses for undocumented persons) were associated with life expectancy at birth, with more liberal versions predicting longer lives, but not with midlife health. These differences in which policies matter for which outcome may partly reflect the fact that life expectancy at birth summarizes mortality risk across all ages, whereas our health measure only captures midlife.
Limitations and Future Directions
Although this study contributes to a growing literature on the importance of macro-level contexts for population health, several limitations must be considered. First, we cannot assert that policy contexts have a causal effect on health. Second, our data do not capture potential state-level differences in how policies are implemented. Another potential shortcoming is that we do not have information on respondents’ interstate migration histories. Although most U.S.-born individuals do not move from their states of birth, those who do move tend to be healthier than those who stay. Consequently, interstate migration patterns may (dis)advantage the health profiles of some states. Prior work indicates that interstate migration is unlikely to bias our results (e.g., Couillard et al. 2021; Fenelon 2013). A study of adult disability prevalence across states found that the cross-state pattern persisted and became stronger when restricting the sample to those who were born in the state in which they resided (Montez et al. 2017). The implication is that not accounting for migration could make cross-state differences in health and the associations between policies and health more difficult to detect.
Overall, our study provides insights into how health in midlife is associated with U.S. state policy domains, which domains may be most consequential for health, and for whom state policy contexts may matter most. Many other questions remain to be answered, however. For example, do the policy domains have a causal effect on health, and if so, through what mechanisms? Are there certain parts of the life course when state policy domains are most consequential for health? For example, is exposure in childhood, young adulthood, or midlife especially important? Or do the effects simply accumulate across the life course? Of course, the answer to those questions will likely depend on the particular policy domain. Another open question is whether there are synergistic or compensatory effects among the policy domains. For instance, could implementing more liberal education policies compensate for less generous Medicaid policies?
Conclusions
From Chadwick’s (1842) report highlighting ways in which social conditions influence poor health to W.E.B. Du Bois’s (1899) research on racial inequalities in health during the turn of the twentieth century, it has long been demonstrated that the economic, social, and physical environments in which people live play a strong role in shaping health and health inequalities. Over the past few decades, these environments have been changing in complex ways that partly reflect diverging policy environments of states. Heeding recent calls to leverage these growing differences across states, this study found that some policy domains are associated with physical health in midlife, and they may be most important for less educated adults and women. Our study echoes the claim that improvements in health and reductions in health inequalities require a greater focus on malleable macro-level factors such as policy that have the power to generate, maintain, exacerbate, or reduce inequalities in the distribution of risks and resources important for health.
Supplemental Material
sj-docx-1-srd-10.1177_23780231221091324 – Supplemental material for U.S. State Policy Contexts and Physical Health among Midlife Adults
Supplemental material, sj-docx-1-srd-10.1177_23780231221091324 for U.S. State Policy Contexts and Physical Health among Midlife Adults by Blakelee R. Kemp, Jacob M. Grumbach and Jennifer Karas Montez in Socius
Footnotes
Funding
The author(s) disclosed receipt of the following financial support for the research, authorship, and/or publication of this article: This work was supported in part by the National Institute on Aging (grants R01AG055481 and R24AG045061) and the Carnegie Corporation of New York (grant G-F-18-56197). The content is solely the responsibility of the authors and does not necessarily represent the official views of the National Institutes of Health or the Carnegie Corporation.
Supplemental Material
Supplemental material for this article is available online.
1
Justification for the included domains is provided in the section “Connections between U.S. Policies and Population Health.” Supplementary analyses using all 16 policy domains from Grumbach showed similar results (available upon request).
2
These two components are often referred to as indirect and direct effects, respectively, in causal analyses. We avoid this terminology because (1) we do not examine causal effects, (2) our study does not include all potentially important covariates, and (3) any given covariate in the model may conceptually serve as a mediator for some policy domains but as a confounder for other domains. We define mediators as being on the (presumably causal) pathway between the policy domains and adult health, while confounders are common causes of the policy domains and adult health (Cinelli, Forney, and Pearl 2021). The OR for the total association between any given policy domain and poor frequent health is the product of the two ORs. For example, in ![]() , the OR for the total association between civil rights and adult health is 0.755, which is 0.845 × 0.894.
, the OR for the total association between civil rights and adult health is 0.755, which is 0.845 × 0.894.
Author Biographies
References
Supplementary Material
Please find the following supplemental material available below.
For Open Access articles published under a Creative Commons License, all supplemental material carries the same license as the article it is associated with.
For non-Open Access articles published, all supplemental material carries a non-exclusive license, and permission requests for re-use of supplemental material or any part of supplemental material shall be sent directly to the copyright owner as specified in the copyright notice associated with the article.