
Abstract
Although existing scholarship notes that homelessness thrives in concentrated poverty, models estimating the association between the intensity of residential poverty segregation and local homelessness rates across communities remain absent from the literature. To fill this gap, the author considers this relationship for 272 homelessness Continuums of Care covering urban and suburban spaces spanning 43 states and the District of Columbia. Models suggest that poverty segregation is positively associated with the expected homelessness rate of a Continuum of Care, a relationship that remains significant when controlling for a range of established drivers of the condition. The author discusses this finding within a framework qualifying residential poverty segregation as both a cause and a consequence of the local prevalence of economic disadvantage that predicts homelessness via its relationship with disadvantage and unique spatial effects.
In the American city and suburb, homelessness is governed partly by a spatial logic, a twofold system of geographic exclusion and seclusion that confines homelessness to neighborhoods of concentrated economic disadvantage (Herring 2014; Wacquant 2010). In communities across the country, persons experiencing homelessness are banished from areas typically reserved for nonpoor actors by means such as selectively enforced ordinances that criminalize activities associated with homelessness (e.g., panhandling) and the strategic placement of hostile architectural deterrents like antisleep benches and visible security cameras (Amster 2003; Beckett and Herbert 2009; Rosenberger 2020). Conversely, neighborhoods of concentrated poverty—spaces from which homeless episodes disproportionately originate (Culhane, Lee, and Wachter 1996; Tsai, Mares, and Rosenheck 2011)—offer the unhoused refuge from some forms of policing and surveillance while also constituting the locations generally reserved for the homeless service infrastructure: emergency shelters, soup kitchens, and the like (Brinegar 2003; Dear and Gleeson 1991; Harris 2017). 1 This infrastructure, however well intentioned, typically satisfies only short-term needs without addressing the long-term housing and resource stability of those seeking support (Desmond 2016; Poethig 2014; Vitale 2017). This arrangement suggests that poverty segregation should be positively associated with local homelessness rates across communities, as concentrated economic disadvantage provides the ideal environment for the production, management, and concealment of homeless episodes, generally without encouraging the development or maintenance of clearly defined organizational solutions promoting exit from the condition. The purpose of the present piece is to test whether this relationship is observable across homelessness Continuums of Care (CoCs), the local or regional administrative bodies responsible for the administration of homeless services in the United States.
I model associations between the intensity of residential poverty segregation and homelessness rates for 272 CoCs spanning predominately urban or suburban areas across 43 states and the District of Columbia. 2 Residential poverty segregation is defined as the extent to which households earning less than $15,000 annually are located in neighborhoods distinct from those inhabited by higher income households and is estimated via the bias-adjusted binary variance ratio index, R, using data from the 2014 to 2018 American Community Survey (ACS) Five-Year Estimates (Reardon et al. 2018). 3 Following previous scholarship modeling rates of homelessness at the CoC level (e.g., Byrne et al. 2013; Fargo et al. 2013), I use a linear mixed modeling strategy that nests CoCs within states to estimate homelessness rates measured during the January 2019 Point-in-Time (PIT) Count, the biennial census of persons experiencing homelessness in the United States.
Models suggest that poverty segregation is positively associated with a CoC’s overall and sheltered homelessness rates, relationships that remain significant when controlling for a range of established drivers of the condition. I discuss findings within a framework qualifying residential poverty segregation as both a cause and consequence of the local prevalence of economic disadvantage. Poverty segregation is theorized to influence local homelessness rates via its interconnection with disadvantage and unique spatial effects that can negatively affect the self-efficacy of those experiencing homelessness and normalize the condition as an accepted social category for the housed.
Framework
The U.S. Department of Housing and Urban Development (HUD) estimated that 567,715 people were homeless on a single night in January 2019. 4 These cross-sectional, midwinter counts have steadily declined from about 650,000 people in 2007, constituting a nontrivial shift in the desired direction. However, gains have been slower than anticipated: CoC-level 10-year plans to end homelessness, originally implemented in communities across the country with the support of the George W. Bush administration, were expected to be completed by the late 2010s (i.e., toward the conclusion of the longest period of economic expansion in U.S. history) (Harris 2017; NLIHC 2014, 2015; Roberts 2012). In this context, the observed 13 percent decrease in homelessness between 2007 and 2019 is something less than a total success. 5
Despite public opinion polling reflecting widespread support for increased public aid to combat homelessness and develop a more robust affordable housing stock—and more than two decades of research demonstrating the cost-effectiveness of housing-first initiatives that subsidize housing expenses while providing optional support services—homelessness remains and is concentrated in densely populated areas of the country: roughly 80 percent of the American homeless population resides in CoCs covering primarily urban or suburban spaces (Gillespie et al. 2020; NLIHC 2019a; HUD 2020; Vitale 2017). In practice, nonpoor, housed residents tend to prioritize keeping homelessness out of their neighborhoods over implementing meaningful solutions, ostensibly because of practical fears such as increased crime rates and the potentially negative impacts of visible homelessness on property values, but also because of the classist assertion that those experiencing homelessness do not belong in their spaces (Dear and Gleeson 1991; Gilderbloom, Squires, and Wuerstle 2013; Lee and Farrell 2004; Oakley 2002). This creates a strategic opportunity for local political actors who, concerned that pursuing actual solutions to homelessness will violate the American doctrine of rugged individualism and ultimately be politically unpopular, commonly embrace strategies to obscure homelessness by concentrating it in high-poverty neighborhoods where nonpoor residents seldom venture (Gilderbloom et al. 2013; Harris 2017; Marcuse 1988).
Prior research (e.g., Dear and Wolch 1987; Lee and Price-Spratlen 2004) has established that the spatial distribution of homelessness within communities parallels the geographic distribution of poverty but has yet to explore whether the concentration of poverty is associated with the size of a CoC’s homeless population. To explain why we should expect a positive association between residential poverty segregation and homelessness rates across CoCs, I first discuss the forces that concentrate housed poverty and homelessness in the same neighborhoods. I then explain how poverty and its segregation affect the generation and management of homeless episodes. I frame this second part of the discussion in terms of the dual patterns of structural determination linking the arrangement of bodies and objects in physical space to structures of the economic order, that is, (1) economic effects on the spatial arrangement of bodies and objects and (2) spatial impacts on the economic order (Bourdieu [1991] 2018; Fogle 2011). In the case of the former, I discuss how economic stratification generates and spatializes both poverty and homelessness. For the latter, I consider how poverty segregation, itself driven by the local prevalence of economic disadvantage, could affect homelessness rates via spatial effects independent from the association between economic disadvantage and homelessness. I use this framework as a basis for hypothesizing a positive relationship between poverty segregation and homelessness that will be partly, but not completely, attributable to community-level measures of economic disadvantage.
Spatial Constraints on Poverty and Homelessness
I define residential poverty segregation as the extent to which households earning below some low-income threshold (i.e., those in poverty) are clustered in neighborhoods distinct from those occupied by more advantaged residents. I illustrate this concept in Figure 1. In a simple case with two groups, those in poverty and those not in poverty (Figure 1A), a low-segregation community observes a near random assortment of households such that knowing the poverty status of one unit is not meaningfully predictive of the status of another in its neighborhood (Figure 1B). In a highly segregated community (Figure 1C), the economic order is clearly inscribed on the larger community with distinct advantaged and disadvantaged neighborhoods, such that the poverty status of most units in a given neighborhood is the same. The concentration of low incomes is associated with the clustering of other disadvantages such as lower access to quality public resources, higher exposure to crime and violence, and, perhaps the ultimate expression of social divide, gaps in life expectancy relative to nearby nonpoor neighborhoods exceeding corresponding disparities between the United States and countries in the developing world (Ansell 2017; Phelan, Link, and Tehranifar 2010; Reardon and Bischoff 2011; Sharkey and Elwert 2011; Wolch and Dear 1993). 6 Nonpoor actors seeking housing tend to avoid these neighborhoods in search of spaces that have higher quality public resources, are perceived to be safer, and are associated with higher social status (i.e., “good neighborhoods”).

Conceptual diagram of communities characterized by low poverty segregation and high poverty segregation.
Over the past half century, income segregation in American cities and suburbs has been increasing along with economic inequality (Reardon and Bischoff 2011; Reardon et al. 2018). The social forces influencing local levels of income segregation are numerous, nonlinear, and complex, but the spatial philosophy of Pierre Bourdieu provides a useful shorthand for how to interpret their expected aggregate effect: to the extent that the physical layouts of cities and suburbs represent a spatial objectification of a stratified social order, sites in physical space represent physical materializations of capital within that stratified order. 7 In competitive housing markets, high levels of income inequality imply an environment in which the most advantaged actors can easily outbid lower-income shelter seekers to claim housing in their most desired neighborhoods. The least desired neighborhoods—marginal spaces with scant economic value—are ceded to the poorest local (housed) residents who cannot afford units in other neighborhoods and who are often severely rent burdened and on the cusp of entering homelessness themselves (Desmond 2016, 2018; Snow and Anderson 1993; Wolch and Dear 1993).
Homelessness is concentrated in high-poverty neighborhoods through a series of exclusionary and seclusionary forces (Herring 2014; Wacquant 2010). Communities across the country maintain sets of ordinances that criminalize the correlates of homelessness (e.g., bans on camping, begging, loitering, sitting or lying in designated spaces, sleeping in cars, or sharing free food) (Amster 2003; NLCHP 2019; Vitale 2017). Such ordinances are most strictly enforced in prime spaces (i.e., those used by nonpoor actors) and are often complemented by hostile design features such as antisleep benches and visible security cameras that similarly encourage those experiencing homelessness to exist elsewhere (Amster 2003; Beckett and Herbert 2009; Rosenberger 2020; Snow and Anderson 1993). Exclusionary strategies force persons experiencing homelessness from all but the poorest neighborhoods, which are spaces often corresponding to (perceived or real) threats to their physical well-being. As a result, the majority of unhoused persons are unaware of outdoor locations where it is both safe and legal to sleep (Beckett and Herbert 2009; Vitale 2017; Western Regional Advocacy Project 2014). The lack of suitable outdoor sleeping quarters invites the criminalization of visible homelessness given that several CoCs do not maintain a stock of shelter beds sufficient to reliably house their entire homeless population, which leaves some people with few other options but to embrace dangerous sleeping arrangements or have their existence outlawed (NAEH 2017; NLCHP 2019).
The infrastructure supporting unhoused populations is similarly relegated to economically depressed neighborhoods via exclusionary processes. When homelessness reemerged on the public agenda in the 1980s, major U.S. city governments and private organizations responded by increasing local inventories of shelter beds (Brinegar 2003), but before the beginning of the 1990s, there emerged “a dangerous trend that place[d] the aesthetic concerns of select groups of business and property owners above the life-or-death needs of the homeless” and designated the placement of local homeless service infrastructures as among the most contentious topics on local public agendas (Safety Network 1988:2, cited in Wolch, Dear, and Akita 1988). Economically advantaged actors (e.g., business owners, longtime homeowners) have generally focused on keeping homelessness and homeless services out of the spaces they claim, which is consequential given that, in most cases, community and professional coalitions have considerably more leverage over local politics than persons experiencing homelessness and those representing the service industry (Gilderbloom et al. 2013; Hall and Yoder 2018; Herbert 2009). As a consequence, homeless services are typically excluded from nonpoor spaces.
The exclusionary processes that concentrate the service infrastructure in marginal spaces also facilitate a set of seclusionary features that qualify these same spaces as the most accommodating residential options for those experiencing homelessness. Given the legal and infrastructural arrangements described above, residing in marginal spaces minimizes police harassment and other forms of unwanted attention while increasing proximity to social services relative to those experiencing homelessness in low-poverty spaces. For these reasons, the latter case is relatively uncommon: residential and public spaces used mostly or exclusively by nonpoor actors tend to be sanitized of homelessness (Alexander-Eitzman, Pollio, and North 2013; Amster 2003; Daiski et al. 2012; Lee and Price-Spratlen 2004; Wright and Vermund 1999).
Poverty Segregation and the Generation and Management of Homeless Episodes
The relationship between the arrangement of objects and bodies in physical space and the economic order is characterized by two simultaneously occurring modes of structural determination, (1) economic effects on the spatial order and (2) spatial effects on the economic order, both of which are mediated by the internalized norms, dispositions, and resulting actions of all relevant actors (i.e., by the collective achievements of all stakeholders in a defined space, each possessing a sufficiently predictable habitus and likelihood of realizing her will). 8 I diagram this relationship with respect to homelessness in Figure 2 and discuss its implications over the next two subsections. Using this framework, I arrive at the hypothesis that poverty segregation will be positively associated with CoC-level homelessness rates and that this association will be partly attributable to the local prevalence of economic disadvantage across communities, which produces both segregated poverty and segregated homelessness.

General structure of the dialectical relationship between the economic and physical orders as it applies to homelessness.
Economic Impacts on the Generation, Legitimation, and Spatialization of Homelessness
At its root, homelessness emerges from local economic systems that permit, or are otherwise incapable of preventing, poverty deep enough to limit some persons from accessing housing (Liebow 1993; Wolch and Dear 1993). We should therefore expect a strong, positive relationship between the increasing prevalence of economic disadvantage and homelessness rates across CoCs. 9 Widespread economic disadvantage, assuming it is long-standing, also indirectly legitimates the existence of homelessness by facilitating its enduring presence, which normalizes homelessness as an accepted social category via social psychological processes (Figure 2, path A → B → A). Research in neuroscience (e.g., Fiske 2009; Harris and Fiske 2006) suggests that members of extreme out-groups, such as those experiencing homelessness, are preconceived by others as subhuman and that reactions to being presented images of homelessness are consistent with neurological patterns indicating disgust. Such judgements can be prereflexive, implying that internalized socialization processes legitimating the inferiority of those experiencing homelessness affect both what we think with (i.e., our cognitive structures) and how we think of homelessness. They are also a function of an observer’s class position: actors situated higher in the economic order are more likely to blame those experiencing homelessness (and housed poverty) for their own conditions (Babjaková, Džuka, and Gresty 2019; Moore 2015). Although positive affect toward those experiencing homelessness tends to be higher for actors who interact with or see people lacking housing more frequently (Lee, Farrell, and Link 2004), exposure to homelessness is itself partly conditioned on one’s location in the economic order (i.e., economic class is positively associated with segregation from homelessness). Path A → B → A in Figure 2 should therefore operate such that high rates of economic disadvantage generate both homelessness and the social psychological conditions necessary to justify its existence. This relationship is key, as the widespread generation of homelessness without legitimation could also lead to its swift eradication via community action or government intervention, especially given the strong public consensus that more needs to be done to address the issue (NLIHC 2019a). However, if homelessness is legitimated as a social category, and can therefore be ignored or deprioritized on local agendas, the community-level association between economic disadvantage and homelessness rates should be clearly identifiable.
In competitive markets, economic stratification also indirectly shapes the spatial order (Figure 2, path A → B → C), as housing costs are among the largest investments most owners and renters will make, and prices are set partly on the basis of the status assigned to particular neighborhoods (Bourdieu [1991] 2018; Desmond 2018). 10 When competition is unequal, individuals and families of sufficient means tend to self-segregate in neighborhoods characterized by social statuses they (consciously or unconsciously) deem appropriate (Reardon and Bischoff 2011; Trounstine 2018). The least desirable spaces are ceded to the poor and homeless. In this respect, poverty segregation is a social segregation: it is a projection of the system of economic relations onto geographic space. These two orders, the economic and spatial, are mutually reflective, but they are not one and the same. The spatialization of poverty and homelessness has the potential to affect homelessness rates in ways distinct from the effects stemming from the economic order described above.
Spatial Effects on the Visibility and Experience of Poverty and Homelessness
The ability to reside in a desired neighborhood constitutes one of the central power struggles inherent to housing markets. In general, those looking for housing aim to optimize their proximity to desired goods and services, the symbolic value of the properties they inhabit, the amount of land over which they have control, the mix of people they are likely to encounter, and the visibility of that which is aesthetically pleasing (Bourdieu [1991] 2018; Fogle 2011). They also aim to keep away that which is undesirable (e.g., crime and visible poverty). In scenarios in which a sizable group of people in poverty are forced to bid for shelter against others with higher means, the expected high degree of residential poverty segregation legitimates the stratified economic order for nonpoor residents through their observance of relatively consistent profiles of the people who reside in certain spaces (e.g., given the relationship between racial identity and household wealth, see, e.g., Urban Institute 2017) and the semipermanence of the built environment (Figure 2, path C → B → A). 11 In other words, the spatialization of economic disadvantage creates a façade for advantaged residents who misunderstand the economic despair of others concentrated in these spaces as a naturalistic and inevitable outcome.
Because the spatial profits accruing to housed residents are partly conditioned on the absence of visible expressions of poverty, nonmarginal spaces tend to be arranged such that the poor and homeless are continuously threatened by probabilistic surveillance. Security cameras and spatial exclusion ordinances, for example, do not guarantee arrest or other forms of trouble. They only suggest that trouble might happen, especially if individuals experiencing homelessness draw attention to themselves. Such arrangements create a risk-reward scenario for those experiencing homelessness who, aware of the high-resolution, polynucleated form that poverty segregation typically takes in American cities and suburbs, 12 strategically design subsistence strategies that involve selectively traversing prime spaces or navigating around them to reach service nodes or other resources (e.g., day labor), while minimizing risks (Snow and Anderson 1993; Snow and Mulcahy 2001). In this regard, the clustering of homelessness in spaces of concentrated poverty has a certain breathability: persons experiencing homelessness can temporarily enter nonpoor spaces without encountering unreasonable risks, as long as their existence is transitory and purposeful. Thus, it is not immediately clear that poverty segregation drives homelessness by limiting resource access.
It is plausible that the clustering of poverty and homelessness in distinct neighborhoods facilitates social psychological normalization effects encouraging those without housing to accept their social positions as inevitable outcomes, driving a positive association between poverty segregation and homelessness across CoCs. Prior research suggests that virtually everyone prefers housing over homelessness and that people experiencing extreme poverty typically use whatever means available to escape or avoid the latter (Desmond 2016; Edin and Shaefer 2015; Liebow 1993; Snow and Anderson 1993; Snow and Mulcahy 2001). Over time, however, such struggles can become unbearable even for the most resilient poor people (Ehrenreich 2010). The causal nexus is messy, but if widespread economic disadvantage facilitates the spatialization of housed poverty and homelessness in the same neighborhoods, it stands to reason that clustering unhoused persons close to one another and other symbols of despair (e.g., cracked sidewalks) normalizes homelessness for those experiencing homelessness by creating an immediately observable, accepted social category corresponding to the bottom of the social order. This does not imply that persons experiencing homelessness in highly segregated communities give up on upward mobility, but it does suggest that constant reminders of one’s own marginality can negatively threaten a person’s ability to overcome it. Establishing the precise spatial mechanism(s) linking poverty segregation to homelessness (e.g., via statistical analysis) is beyond the scope of the present study, but it is important to note that if poverty segregation is positively associated with CoC-level homelessness rates, the relationship is likely partly attributable to the way symbols from the built environment become inscribed in the minds of those experiencing the condition.
The Present Study
I ask two novel questions about the relationship between poverty segregation and homelessness rates across urban and suburban CoCs:
Is the degree of poverty segregation observed in a CoC associated with its expected homelessness rate?
If an association between poverty segregation and homelessness rates is identified, can it be explained by the local prevalence of economic disadvantage, as the latter is theorized to drive both poverty segregation and homelessness?
I expect that poverty segregation will be positively associated with local homelessness rates in unadjusted models and that this relationship will be partly attributable to the CoC-level prevalence of economic disadvantage. Furthermore, consistent with prior research (e.g., Byrne et al. 2013; Lee, Price-Spratlen, and Kanan 2003), I expect that fully adjusted models will have nontrivial explanatory power, demonstrating that the local prevalence of homelessness is tightly related to community-level processes. Assuming that unique spatial effects stemming from poverty segregation affect local homelessness rates, I expect the relationship between poverty segregation and homelessness to remain significant in regression models controlling for a full set of CoC-level drivers of homelessness previously established in the literature that do not measure a degree of spatialization. 13
Data and Methods
Data
The PIT Count is the biennial census of persons experiencing homelessness in the United States. During odd-numbered years, communities are required to count and report the number of persons experiencing sheltered and unsheltered homelessness on a single night during the last 10 days of January. Local enumerations are reported at the CoC level. CoCs range in size from the subcounty level to spanning multiple counties and do not always correspond to typical census geographies. 14 To accurately merge PIT Count data with community-level demographic information, I use a publicly available crosswalk file that identifies the specific census tracts within each CoC. 15 I gather tract-level demographic measures from the 2014 to 2018 ACS Five-Year Estimates, and I aggregate these data to the CoC level. 16 Local average temperatures for January 2019 are estimated by overlaying HUD’s publicly available CoC shapefiles onto a map of weather stations reporting data to the PRISM Climate Group (https://prism.oregonstate.edu) and taking the simple average of all stations located within the boundaries of each CoC. Given prior research (e.g., Byrne et al. 2013) indicating that the drivers of homelessness vary across rural and nonrural settings, and the focus of the present study on the latter, I restrict this analysis to CoCs primarily responsible for managing homeless services in urban or suburban spaces, as designated by HUD. I also omit a set of CoCs that exist outside of the contiguous United States, Alaska, and Hawaii (e.g., those in Puerto Rico). Using this strategy, I derive a sample of 272 CoCs spanning 43 states and the District of Columbia. A map of the CoCs used for this analysis can be found in Appendix A.
Dependent Variable
The outcome variable of interest is the number of persons experiencing homelessness per 10,000 residents living within the boundaries of a CoC. Because the forces that physically concentrate persons experiencing sheltered homelessness are distinct from those that concentrate people experiencing unsheltered homelessness, 17 I disaggregate homelessness into its sheltered and unsheltered subtypes and model the determinants of homelessness for all three outcomes (i.e., unsheltered, sheltered, and overall homelessness rates). Because of the heavy right skews of the distributions of all three outcome variables, I use their natural logarithms in all regression models.
Poverty Segregation
My goal is to accurately measure the extent to which households within each CoC are unevenly distributed across neighborhoods by poverty status to assess if poverty segregation is associated with local homelessness rates. I use census tracts as proxies for neighborhoods, and I calculate poverty segregation across tracts for each CoC. For this analysis, households earning less than $15,000 in annual income are defined as being in poverty, and all other households are defined as not in poverty. This operationalization is justified by prior research (e.g., Culhane et al. 1996) suggesting that homelessness is disproportionately generated in neighborhoods where typical incomes fall considerably short of the official poverty line ($21,330 for a family of three in 2019). In the supplemental appendix, I reestimate all models presented here using 14 alternative definitions of poverty segregation. Supplemental models collectively demonstrate that homelessness is most closely associated with the segregation of the lowest income households from everyone else.
I calculate poverty segregation using the bias-adjusted binary variance ratio index, R, which explicitly accounts for the upward bias that arises when constructing segregation measures using sample data, an important issue given the lowering of ACS sampling rates over recent iterations (Reardon et al. 2018). Using this measurement strategy involves an important trade-off relative to using simpler and more common segregation measures such as the index of dissimilarity. R has several appealing features that other common segregation measures do not, but its interpretation is less straightforward. 18 Following Bischoff and Reardon (2014), I interpret R as follows: segregation ranges from a theoretical minimum of zero (no segregation) to a maximum of one (complete segregation). When segregation is low (i.e., close to zero), the poverty status of any unit within a neighborhood does not meaningfully predict the status of another randomly chosen unit in the same neighborhood (Figure 1B). As R approaches one, the poverty status of any unit in a neighborhood becomes more strongly predictive of the status of all others in the neighborhood, which more frequently share the same status (Figure 1C). In the hypothetical case of complete segregation, poverty status can vary across neighborhoods belonging to the same CoC as long as within-neighborhood homogeneity is maintained. The magnitude of this measure does not have any intuitive meaning, but it is useful for relative comparisons across geographic units.
Control Variables
A summary of all variables used in this analysis can be found in Table 1 and corresponding descriptive statistics are presented in Table 2. Control variables were selected to mirror community-level predictors of homelessness previously established in the literature (see, e.g., Byrne et al. 2013; Lee et al. 2003). Because of high correlations between two sets of predictor variables—(1) CoC-level poverty, unemployment, and public assistance use rates and (2) CoC-level median rents and renter median incomes—I create two composite measures using principal-component analysis (PCA): (1) an index of economic disadvantage explaining roughly 84 percent of the total variation in the first set of variables and (2) an index of renter market accessibility capturing 95 percent of the variation in the second set (see Appendix B). Because of heavy right skews in the distributions of some predictor variables and the potential for outlier observations to disproportionately influence coefficient estimates, some variables are log transformed when entered into regression models. I note these transformations where appropriate.
Summary of Study Variables.

Note: ACS = U.S. Census Bureau American Community Survey 5-Year Estimates, 2014 to 2018; HUD CoC shapefiles = U.S. Department of Housing and Urban Development geographic information system data sets denoting physical boundaries of Continuums of Care; HUD PIT Count = U.S. Department of Housing and Urban Development Point-in-Time Count estimates of persons experiencing homelessness in January 2019; PRISM = Northwest Alliance for Computational Science and Engineering PRISM Climate Group at Oregon State University.
Segregation variable constructed via bias-adjusted variance ratio index, R.
Indicates variables constructed via principal-component analysis (see Appendix B).
Descriptive Statistics.

Modeling Strategy
I assume that CoCs nested within the same state are not statistically independent from one another and are likely to share more similar characteristics than they do with CoCs located in different states (e.g., because of potentially related, state-funded programs addressing issues such as mental health among low-income populations; see Byrne et al. 2013). This type of clustering violates the independence assumption of ordinary least squares regression and must be explicitly considered in statistical models. To address this issue, I follow Byrne et al. (2013) and build a series of linear mixed-effects models with CoCs as the first level of analysis and states as the second. This strategy allows me to account for statistical dependence among CoCs nested within the same state by specifying random slopes and intercepts. For all models, I regress the natural logarithm of the outcome on a series of predictor variables, all of which are continuous and mean centered.
Results
Unadjusted Models: Does Poverty Segregation Predict Homelessness Rates?
In Figure 3, I summarize the expected, unadjusted association between a CoC’s degree of residential poverty segregation and local homelessness rates, estimated via models including state-level random intercepts and slopes. 19 A 1 standard deviation increase in poverty segregation is associated with a 30.9 percent increase in a CoC’s expected total homelessness rate and a 32.2 percent increase in its expected sheltered homelessness rate. The estimated association between poverty segregation and unsheltered homelessness rates is null. Marginal R2 values, measuring the explanatory contribution attributable to fixed effects only, are .12 and .14 for models predicting total and sheltered homelessness rates, respectively, and virtually zero for the model predicting unsheltered homelessness. Collectively, these unadjusted models suggest an affirmative answer to the first research question with an important caveat: across urban and suburban communities, homelessness, particularly sheltered homelessness, tends to be more prevalent in CoCs where poverty is more highly concentrated.

Estimated relationships between residential poverty segregation and Continuum of Care–level homelessness rates (95% confidence intervals displayed).
Does the CoC-Level Prevalence of Economic Disadvantage Explain the Association between Poverty Segregation and Homelessness?
In Figure 4, I retest the association between poverty segregation and homelessness while including an indexed term for a CoC’s level of economic disadvantage summarizing its poverty rate, unemployment rate, and rate of public assistance use (see Appendix B). Adding this control reduces the magnitude of the association between poverty segregation and sheltered homelessness by 35 percent and the association with overall homelessness by 44 percent relative to unadjusted models, but poverty segregation remains a meaningful predictor of sheltered and overall homelessness at the p < .01 level. A reduced effect size is expected given the strong conceptual relationship between the CoC-level prevalence of poverty and its segregation. However, the significant, adjusted relationship between poverty segregation and homelessness that remains when accounting for economic disadvantage broadly indicates that poverty segregation caries its own social inertia that can drive CoC-level homelessness rates independent from the effect that widespread economic disadvantage has on homelessness.
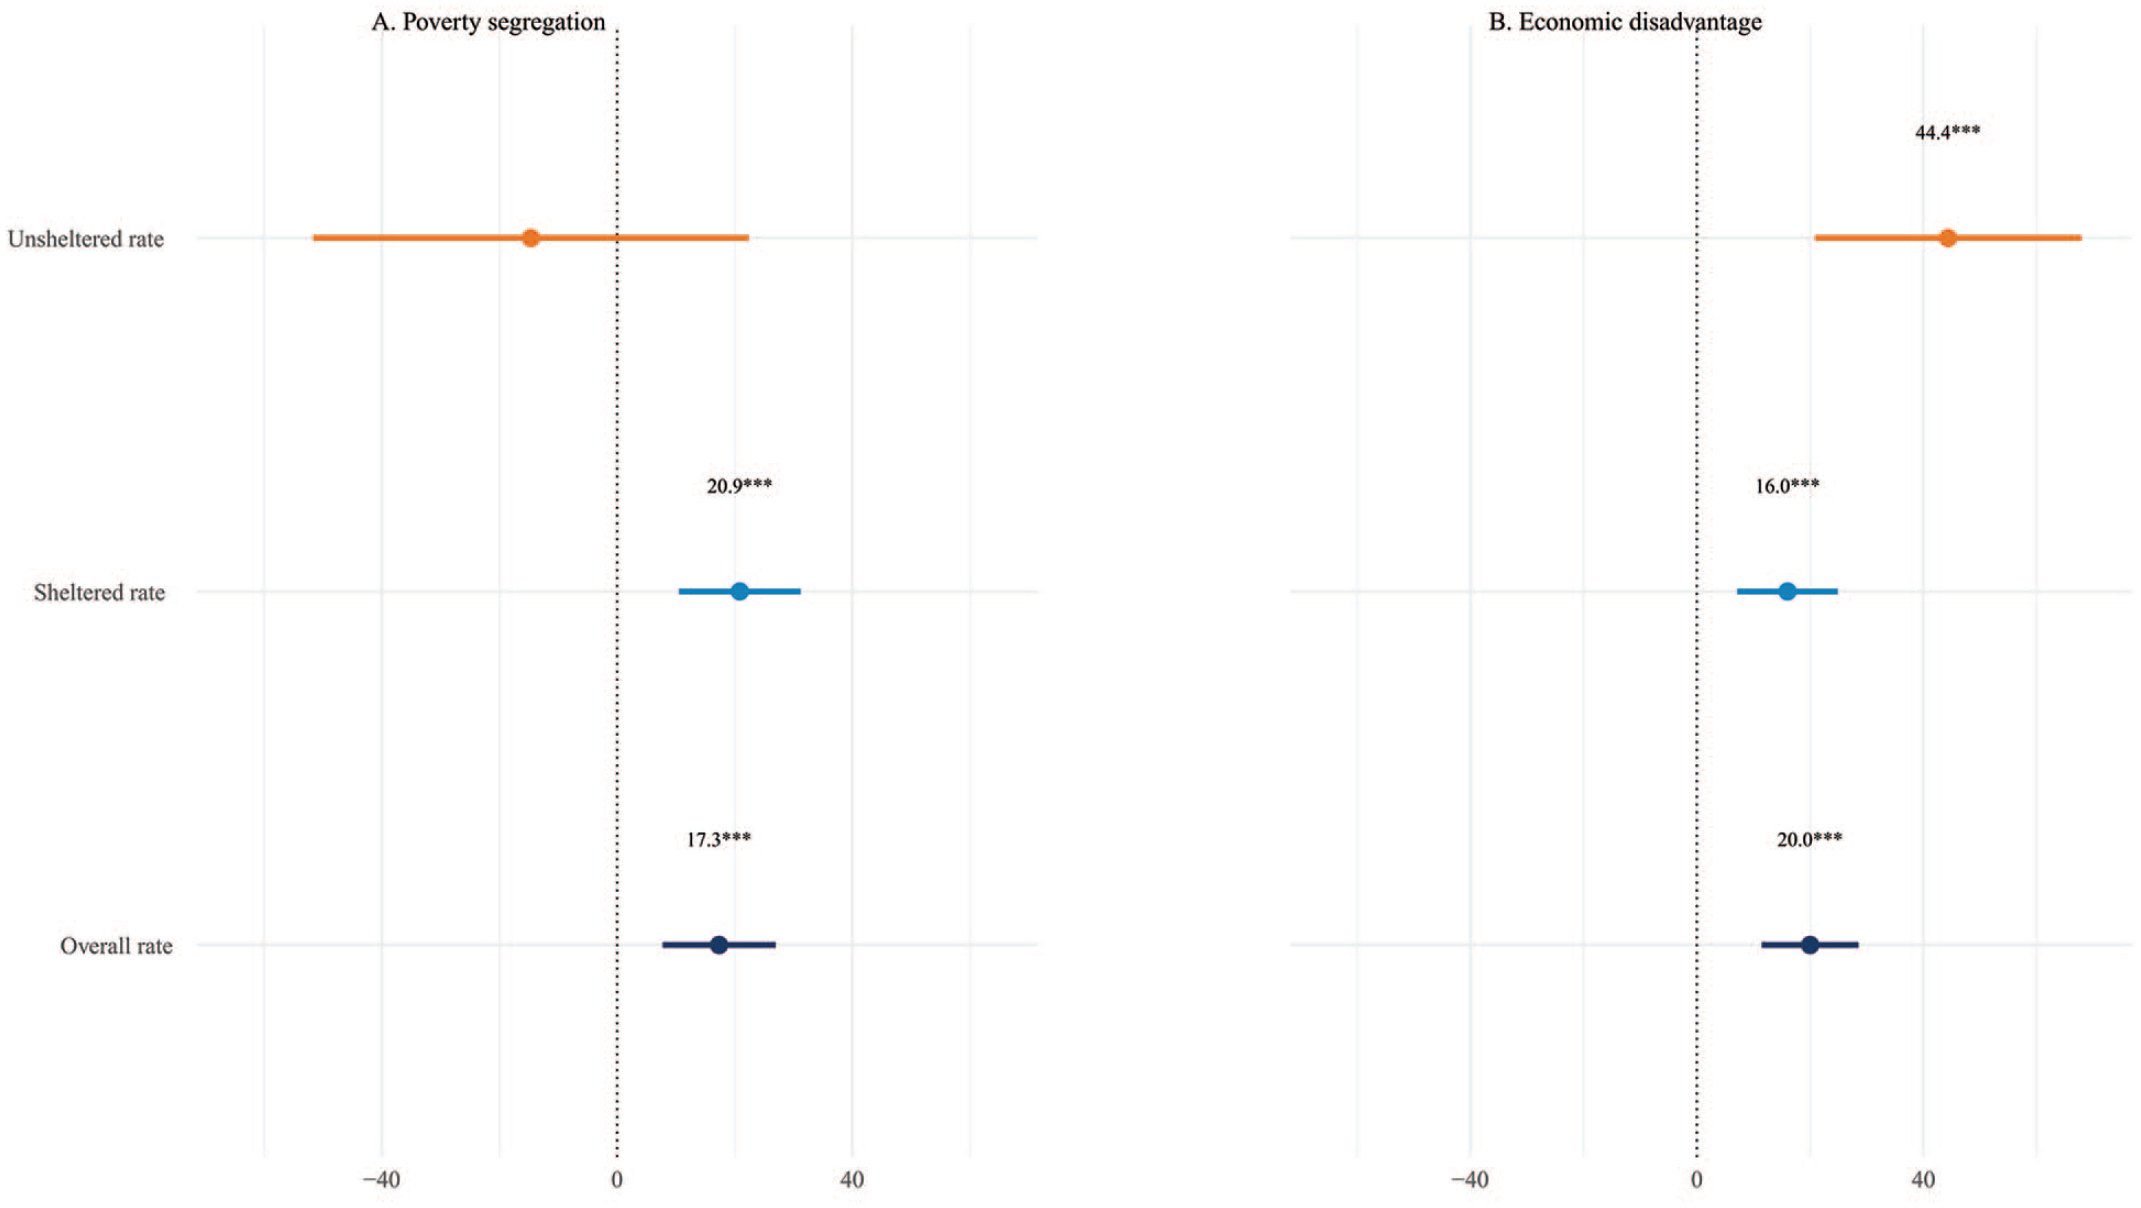
Estimated relationships between residential poverty segregation, local levels of economic disadvantage, and Continuum of Care homelessness rates (95% confidence intervals displayed).
Fully Adjusted Models: What Are the Community-Level Correlates of Homelessness?
In Figure 5, I summarize results from fully adjusted regression models estimating CoC-level homelessness rates. All else equal, a 1 standard deviation increase in poverty segregation is associated with a nontrivial 12 percent increase in a CoC’s expected rates of sheltered and overall homelessness. I find marginal evidence suggesting the adjusted relationship between poverty segregation and a CoC’s unsheltered homelessness rate is negative, but combined with previous models indicating a null relationship between poverty segregation and unsheltered homelessness, it is not immediately clear that this relationship is practically meaningful. Model controls generally operate as expected. A CoC’s expected unsheltered, sheltered, and overall homelessness rates are positively associated with the local prevalence of economic disadvantage, indicating that homelessness tends to be more prevalent in places with higher rates of poverty, unemployment, and public assistance use. Rental market accessibility is negatively associated with all three outcomes, though only marginally so for the model predicting unsheltered homelessness, suggesting that homelessness rates are systematically lower in CoCs with lower median rents and a more robust demand for lower income units. A CoC’s single occupancy rate, which has been theorized to predict homelessness because of the limited income streams typically associated with single-earner households and the increased competition these residents face for low-cost units (Byrne et al. 2013; Desmond 2018), is positively associated with homelessness rates for all three outcomes, but this effect is statistically significant only for models predicting sheltered and overall homelessness rates. Other things equal, CoCs containing more census tracts (which have systematically larger populations) tend to observe lower rates of sheltered and overall homelessness but higher rates of unsheltered homelessness. Although local average temperatures do not meaningfully predict overall homelessness rates, they do predict particular expressions: all else equal, warmer CoCs tend to observe more unsheltered homelessness, and sheltered homelessness is more common in places experiencing colder winters. The negative association between the percentage of a CoC’s population identifying as black or African American and all three outcomes deserves increased attention, as it is counterintuitive given the increased risk for entering homelessness faced by black Americans (HUD 2020), but this exploration is beyond the scope of the present project. As in previous research (Byrne et al. 2013; Lee et al. 2003), CoC-level homelessness rates are highly predictable using community-level characteristics. This set of 13 predictor variables, along with state-level random effects, explains roughly half of the variation in unsheltered homelessness rates across CoCs and more than half of the variation in sheltered and overall homelessness rates (see Appendix E).

Continuum of Care–level drivers of homelessness (95% confidence intervals displayed).
Discussion and Conclusion
This analysis has two basic implications for homelessness research. First, I confirm more than three decades of scholarship arguing that homelessness is driven mainly by issues of economic insecurity and housing affordability (see, e.g., Byrne et al. 2013; Desmond 2016; Liebow 1993; Rossi 1989; Wolch and Dear 1993). Second, I provide new statistical evidence establishing a positive association between poverty segregation and homelessness rates across urban and suburban CoCs. Homelessness thrives in concentrated poverty partly because when poverty prospers, its expressions, including homelessness, tend to be concentrated in geographic space. Models presented here further suggest that poverty segregation also carries its own social inertia stimulating homelessness independent from the local prevalence of economic disadvantage and other previously established CoC-level drivers of the condition.
The precise spatial mechanism(s) linking CoC-level poverty segregation to homelessness rates remain poorly understood. I propose three potential links in no particular order. First, poverty segregation might limit resource access for those experiencing homelessness if such resources are located in prime spaces or in distant locations separated by advantaged neighborhoods. I do not find strong support for this mechanism, as previous scholarship (e.g., Desmond 2016; Edin and Shaefer 2015; Snow and Anderson 1993; Snow and Mulcahy 2001) suggests that housed and unhoused persons in deep poverty typically engage in whatever struggles they can to improve their conditions, including strategically navigating class-segregated environments in order to reach needed resources. Second, experiencing homelessness in concentrated poverty (compared with relative class integration) surrounds those in the condition with constant reminders of their own marginality, which itself shapes their collective habitus and might legitimate homelessness for those experiencing it. It stands to reason that, other things equal, being immersed in the reminders of one’s own social inferiority prevalent in the poorest neighborhoods (e.g., old, chipped paint and other signs of economic neglect) has negative impacts on a person’s self-efficacy, which, in turn, might limit the proactive strategies used by those experiencing homelessness. Last, the segregation of homelessness in areas of concentrated poverty might constitute a de facto local solution to homelessness that permits episodes to go unchecked (e.g., Harris 2017; Marcuse 1988). Poverty segregation allows homelessness to be largely ignored by influential and engaged local political actors who might otherwise vocally disapprove of visible homelessness existing in their preferred spaces or the implementation of social programs that actually solve the problem. It also normalizes homelessness as a legitimate social category for nonpoor residents, who come to view the condition as an inevitable outcome limited to other social groups tacitly understood as inferior (i.e., poverty segregation shapes the habitus of nonpoor residents toward understanding the homeless as a group beneath them in the social order). It is plausible that, all else equal, normalizing homelessness in the collective consciousness of housed actors via its spatialization might downgrade the importance of meaningful antihomelessness initiatives on community agendas and limit other contributions that nonpoor actors can make (e.g., volunteer service or charitable donations). Although I do not explicitly test these ideas here, further exploration of such mechanisms constitutes a potentially fruitful avenue for future research.
Null associations between poverty segregation and unsheltered homelessness deserve a nuanced interpretation. Although I do not recover a meaningful relationship between poverty segregation and unsheltered homelessness rates, I suspect that this result might be partly a consequence of measurement error. If those experiencing unsheltered homelessness prefer to render themselves invisible in order to avoid surveillance or harassment, then higher poverty segregation might provide more concealment opportunities (e.g., in abandoned buildings), including from street volunteers conducting local PIT Counts. With this in mind, the relationship between poverty segregation and unsheltered homelessness across CoCs also deserves further attention.
Limitations to this analysis are considerable and include its cross-sectional design and issues associated with sample selection and variable operationalization. 20 Generalizing results of this research should be done carefully. Although I find a statistically meaningful relationship between poverty segregation and homelessness rates for those CoCs administering services in predominately urban and suburban areas, these units do not represent all American cities and suburbs. 21 Although this analysis was carefully designed, results should be retested regularly, especially as higher quality data become available.
I conclude by directly returning to the core concerns of this study. I add to the existing literature by providing evidence of a positive association between poverty segregation and homelessness across CoCs that is partly, but not completely, attributable to the former’s relationship with the local prevalence of economic disadvantage. Furthermore, the relationship between poverty segregation and homelessness is robust to a full set of established CoC-level drivers of homelessness, which, along with state-level random effects, explain nearly 60 percent of the variation in homelessness rates across CoCs. Although poverty segregation is a spatial manifestation of the stratified economic order, findings support the idea that it carries its own social inertia that meaningfully drives homelessness.
Supplemental Material
sj-pdf-1-srd-10.1177_2378023121996871 – Supplemental material for On the Relationship between Poverty Segregation and Homelessness in the American City and Suburb
Supplemental material, sj-pdf-1-srd-10.1177_2378023121996871 for On the Relationship between Poverty Segregation and Homelessness in the American City and Suburb by Paul Muniz in Socius
Footnotes
Appendix A
Appendix B: Dimension Reduction
Because of high correlations among some potential CoC-level predictors of homelessness and correspondingly high variance inflation factors in multiple regression models, I perform PCAs for two sets of variables that are conceptually related. First, strong correlations exist among CoC-level poverty rates, rates of public assistance use, and unemployment rates (all measures logged). The first principal component of the PCA including these three variables explains 84.18 percent of their total variation, and all variables load in the positive direction. Given that the use of public assistance programs—defined here to include Supplemental Security Income, cash public assistance, and the Supplemental Nutrition Assistance Program—indicates the presence of economic hardships that are conceptually similar to the underlying constructs being measured by poverty and unemployment rates, I refer to this first principal component measure an index of economic disadvantage. Second, I conduct a PCA on two rental market characteristics: (1) CoC median rent and (2) the natural log of renter median income. I interpret these measures as interrelated products of rental market supply and demand (i.e., rent levels generally increase proportionally to what current renters can afford). Both of these factors load negatively on the first principal component, which explains 95.5 percent of their total variance. Given that these are correlated measures that determine rental market affordability, with lower median renter incomes and median rents implying higher scores, I refer to this measure as an index of rental market accessibility. Using this technique allows the preservation of information while explicitly addressing issues of multicollinearity that could otherwise threaten the stability of model estimates.
Appendix C. Unadjusted Mixed-Effects Regression Models Predicting Rates of Homelessness per 10,000 Persons in a Continuum of Care Net of Residential Segregation
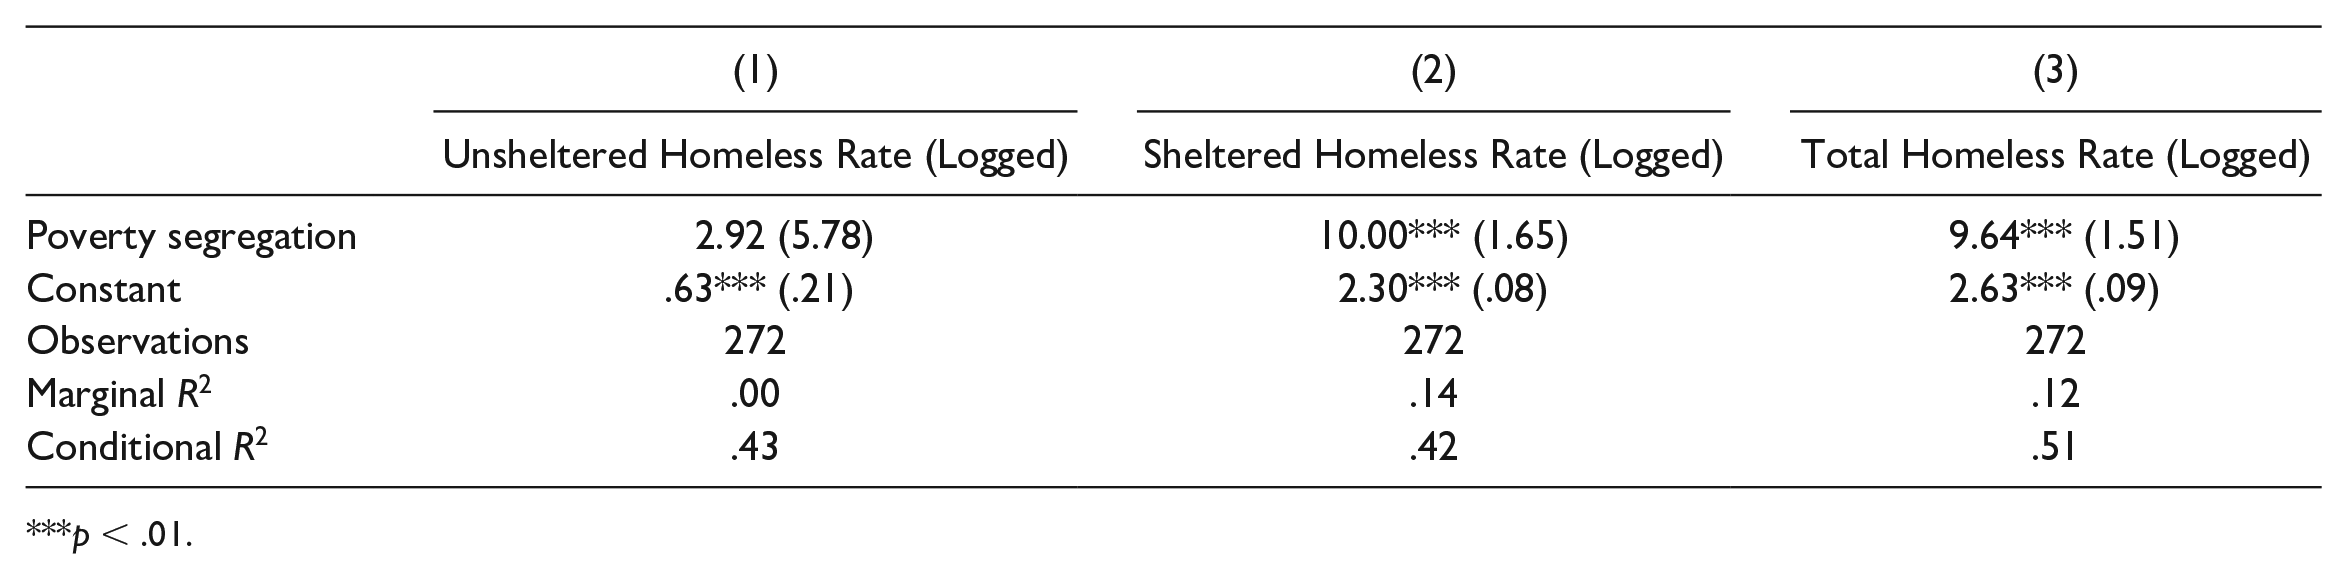
| (1) | (2) | (3) | |
|---|---|---|---|
| Unsheltered Homeless Rate (Logged) | Sheltered Homeless Rate (Logged) | Total Homeless Rate (Logged) | |
| Poverty segregation | 2.92 (5.78) | 10.00*** (1.65) | 9.64*** (1.51) |
| Constant | .63*** (.21) | 2.30*** (.08) | 2.63*** (.09) |
| Observations | 272 | 272 | 272 |
| Marginal R2 | .00 | .14 | .12 |
| Conditional R2 | .43 | .42 | .51 |
p < .01.
Appendix D. Mixed-Effects Regression Models Predicting Rates of Homelessness per 10,000 Persons in a Continuum of Care Net of Residential Poverty Segregation and Economic Disadvantage

| (1) | (2) | (3) | |
|---|---|---|---|
| Unsheltered Homeless Rate (Logged) | Sheltered Homeless Rate (Logged) | Total Homeless Rate (Logged) | |
| Poverty segregation | –5.68 (6.19) | 6.78*** (1.84) | 5.72*** (1.71) |
| Economic disadvantage | .23*** (.07) | .09*** (.03) | .12*** (.03) |
| Constant | .65*** (.20) | 2.32*** (.08) | 2.64*** (.09) |
| Observations | 272 | 272 | 272 |
| Marginal R2 | .03 | .15 | .15 |
| Conditional R2 | .44 | .44 | .52 |
p < .01.
Appendix E. Fully Adjusted Mixed-Effects Regression Models Predicting Continuum of Care–Level Homelessness Rates

| (1) | (2) | (3) | |
|---|---|---|---|
| Unsheltered Homeless Rate (Logged) | Sheltered Homeless Rate (Logged) | Total Homeless Rate (Logged) | |
| Poverty segregation | –9.67* (5.72) | 4.15** (1.75) | 4.04** (1.69) |
| Economic disadvantage | .35** (.14) | .12** (.05) | .20*** (.05) |
| Rental market accessibility | –.27* (.15) | –.12** (.05) | –.19*** (.05) |
| Renter occupancy rate | –.01 (.02) | .01 (.01) | .00 (.01) |
| Vacancy rate | –.13 (.30) | –.13 (.11) | –.14 (.10) |
| Crowded rate | .39 (.35) | .24** (.12) | .24** (.12) |
| Percentage moved in last year | 1.86*** (.55) | .08 (.20) | .20 (.20) |
| Percentage black | –.34** (.15) | –.14*** (.05) | –.22*** (.05) |
| Percentage Hispanic/Latinx | .09 (.19) | .03 (.07) | .05 (.07) |
| Median age | .01 (.04) | .01 (.02) | .01 (.02) |
| Single occupancy rate | .06 (.04) | .07*** (.01) | .07*** (.01) |
| Tracts | .28** (.12) | –.12*** (.04) | –.11** (.04) |
| Average temperature | .04*** (.01) | –.02*** (.01) | .00 (.01) |
| Constant | .63*** (.14) | 2.27*** (.05) | 2.62*** (.05) |
| Observations | 272 | 272 | 272 |
| Marginal R2 | .36 | .46 | .46 |
| Conditional R2 | .50 | .55 | .57 |
p < .10. **p < .05. ***p < .01.
Notes
Author Biography
References
Supplementary Material
Please find the following supplemental material available below.
For Open Access articles published under a Creative Commons License, all supplemental material carries the same license as the article it is associated with.
For non-Open Access articles published, all supplemental material carries a non-exclusive license, and permission requests for re-use of supplemental material or any part of supplemental material shall be sent directly to the copyright owner as specified in the copyright notice associated with the article.